<< Building Views with IBM Engineering Lifecycle Optimization – Engineering Insights (ENI) Part One – Introduction
In this article, we’ll build our first view. Later we’ll make it look visually appealing and introduce some dynamic visualization but we’ll start by simply reporting the data we are interested in and see just how quickly and easily views can be designed. We’ll be building this view using the out-of-the-box sample data that ships with ELM – JKE Banking (or whatever you choose to call it when you deploy it). That sample just happens to be a finance sample, but it has the same kinds of an artifact that IT and Engineering projects have, it has requirements, it has test cases and it has work items.
Conceptual Roles
ENI has three conceptual roles (these are not tool-based roles that appear in the UI)
- Consumers: Project managers, engineers and so on that simply want to view the graphical analyses, typically on dashboards. Consumers need very little knowledge of ENI (only perhaps how to modify the parameters a view designer has included to allow dynamic customization of the returned data)
- View Designers: As the name implies, designers build the views that the consumers use. Designers need to know (a) how to use the tool to build views and (b) the information model. How is the data being created? What link types are being used? How many levels of traceability have been implemented? What kinds of analyses are required?
- Custom Artifact Element Designers: This is the deepest level of customization and requires all the knowledge of a View Designer but also the concepts of RDF and the SPARQL query language.
For most of this series, we will flip back and forth between Consumers and View Designers. A later series of articles will focus on the concepts around Custom Artifact Elements, how they are used and how they are designed.
Building a View
Creating the Project
One of the major differences between an ENI project and any other Jazz-based project is that it does not scope the visible data. As we discussed in the previous article, ENI sits on top of LQE and LQE sees all. The visible data is only scoped by (a) the users’ permissions to see the data and (b) the scoping that the View Designer decides to apply and this is done in the View – not at a project level.
Creating a View
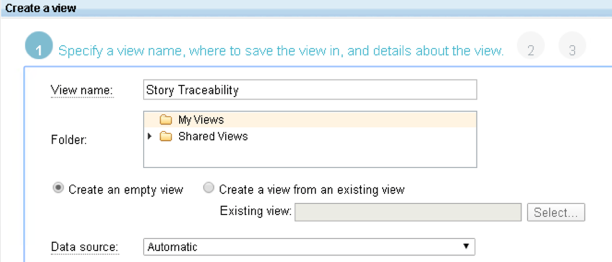
Creating a new View is an exercise in simplicity; there are multiple menu items and indicated buttons to do so.

Your new View can be created in the Shared section and thus instantly available to anyone else who is a member of this ENI project; or it can be in the My Views section, visible only to you (until you choose to move it).
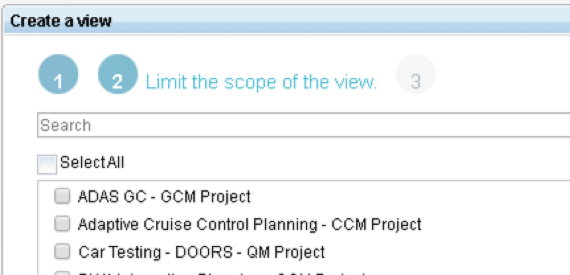
When you create the view, you can if you wish to limit its scope immediately to only specific projects. You don’t have to do that; you can add project-level filtering later, in containers or links (you’ll see that later). My recommendation is this: don’t limit it until you have to / want to, so we can skip this page (selecting nothing means we don’t want to apply any project filtering)
Populating a View
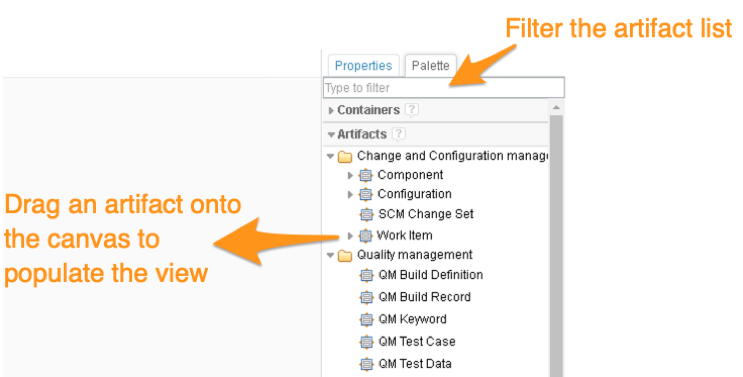
Views are populated by dragging elements from the palette onto the canvas:
Artifacts and Custom Artifact Elements
It’s worth at this point acknowledging that the palette has three sections:
- Containers
- Artifacts
- Custom Artifact Elements
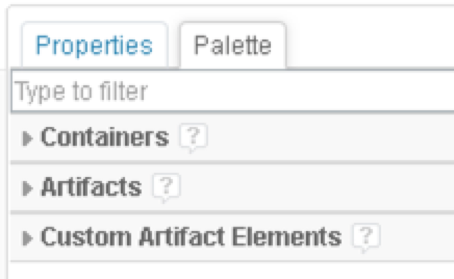
Leaving Containers aside for a moment, the two major sections are Artifacts and Custom Artifact Elements. Both represent “stuff” in your database. For example, work items, test cases, requirements and so on. However, they have some key differences:
- Artifacts
- Are populated automatically by ENI by asking the data source ‘hey – what do you have ?’
- Custom work item types, requirement attributes and so on all appear automatically with no effort at all on your part
- They are limited to what the data source returns (more on this later)
- Custom Artifact Elements
- Do not appear automatically. They have to be hand-crafted using a query language called SPARQL (although a sample set can be deployed)
- Are more flexible than Artifact Elements; you can write a query to interrogate the data source in any way you like.
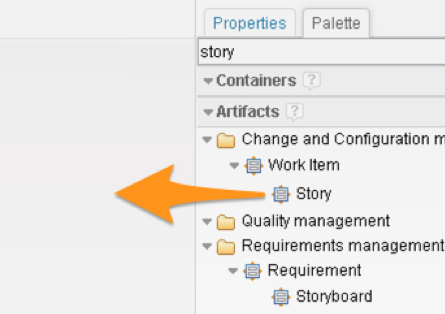
For this first set of articles, we’ll use the automatically-generated Artifacts. Since the sample data has a work item type called Story, we can drag that Artifact onto our canvas:
Refining Container Content
When an Artifact is dragged onto the canvas, it turns into a container. That container will be populated with graphical nodes that represent the data source, in this case, Stories. Before that happens, we can choose to filter that population in several ways; by the project (Edit scope tab); by the presence of outgoing links (Link types tab); or by any attribute of the data source (Edit conditions tab).
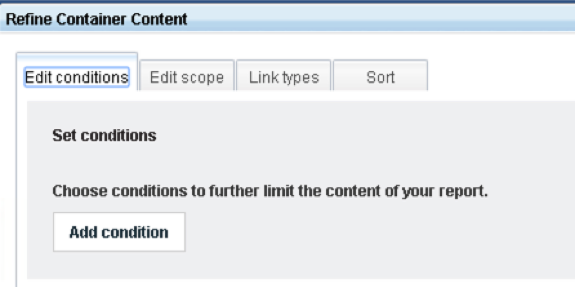
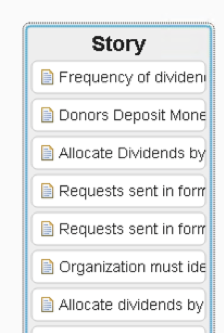
This is optional and we can invoke the same dialog later so, for now, we can click OK to see All Stories:
Showing a Count
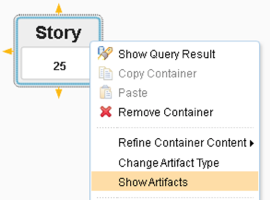
Using the right-click menu for a container we can toggle it between showing the artifacts or a count of those artifacts:

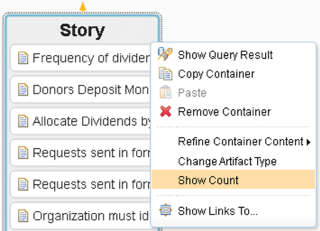
Adding Connected Artifacts
If the container is showing artifacts (not a count) then we can add a new container that populates with connected artifacts by right-clicking the existing container (in this case Story) and selecting the menu Show Links To:
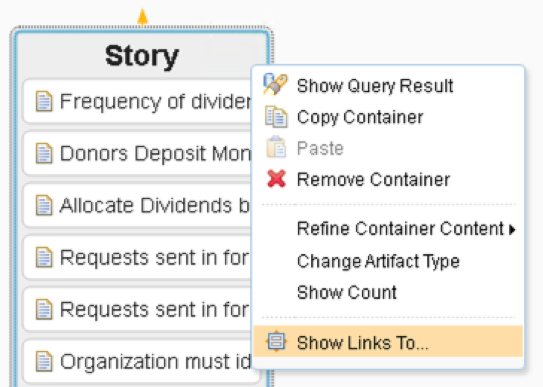
This starts a wizard with several pages where we can:
- Create a new container or add connections to an existing one (in this case we are creating a new container)
- Filter by the project (useful if our Stories connected to artifacts in multiple projects – they don’t so we can skip this page)
- Select the type of artifact and the type of link we want to use to populate the new container:
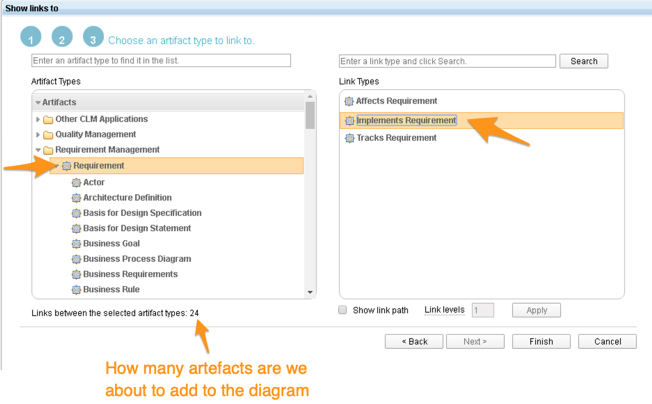

We can continue adding more containers to show whatever traceability we want. This is where the information model becomes important!

Filtering a Container
Remember when we first dragged the Story artifact onto the view and we had a chance to apply to filter? Let’s invoke that again. We can right-click any container (in this case we’ll right-click the Story container) and select Refine Container Content > Edit conditions.
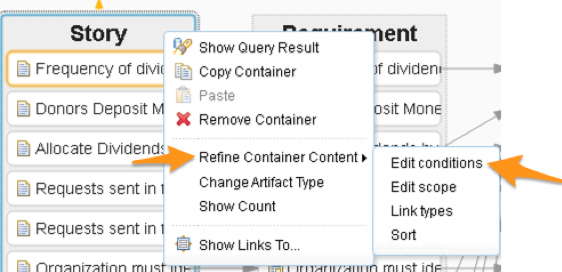
It doesn’t matter which of that four sub-menus we choose since they all invoke the same dialog that has those menu entries as tabs.
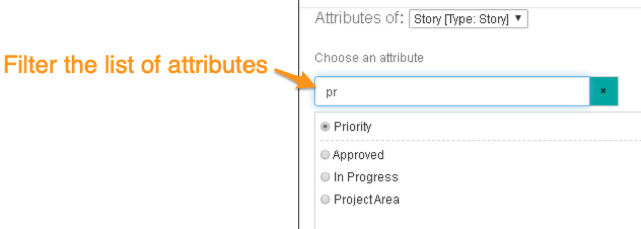
On the Edit conditions tab, we can filter the container based on any of the data source attributes. For example, we could filter based on the Priority of the Story:
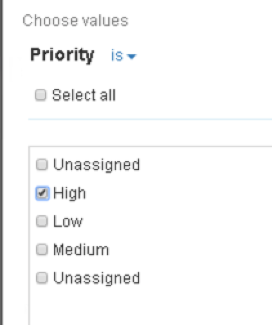
We can also decide if the Consumer of the view can change the condition to see different data (the default is yes, they can – but they don’t have to)

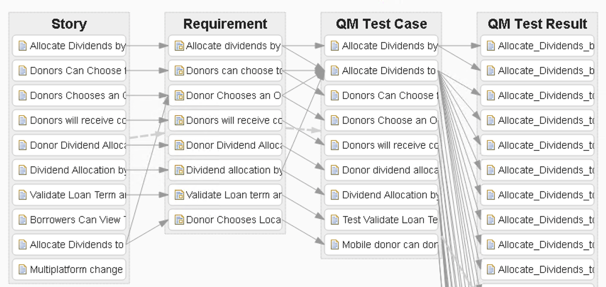
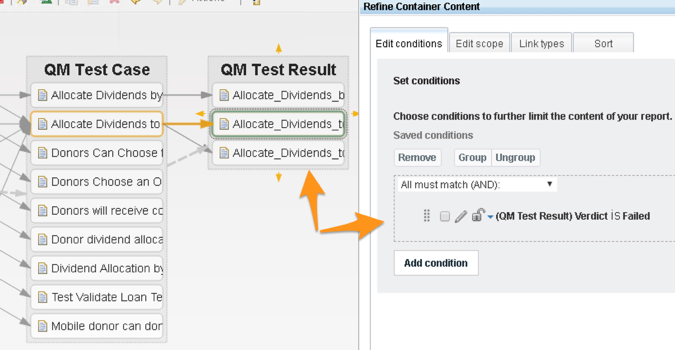
We can apply filters to any of the containers, not just the first one:
Consuming the View
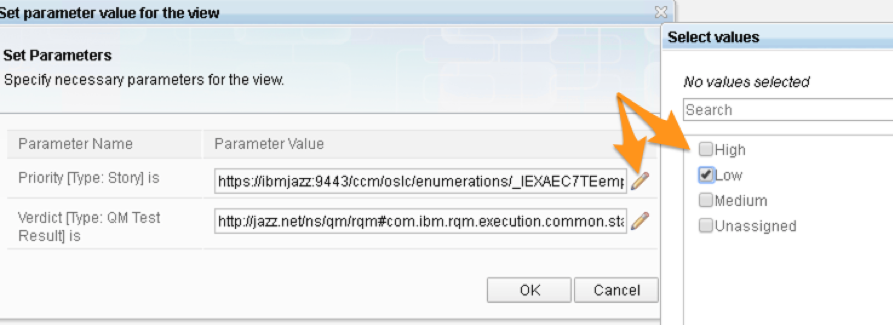
By clicking Save and Close we can switch from designing the View to consuming it (of course the View appears on the menus and can also be added directly to dashboards in other parts of the platform). To change the filter values, we click the ‘ruler’ symbol in the tools bar:

Creating an Impact Analysis Style View
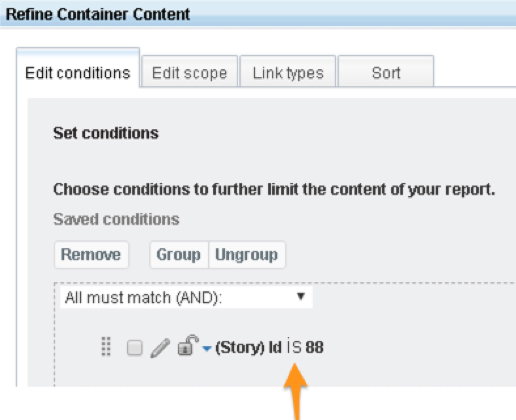
These types of views typically start with a single artifact. We can implement that easily by applying a filter to our starting container that only returns a single artifact. ID or URL are both good choices:
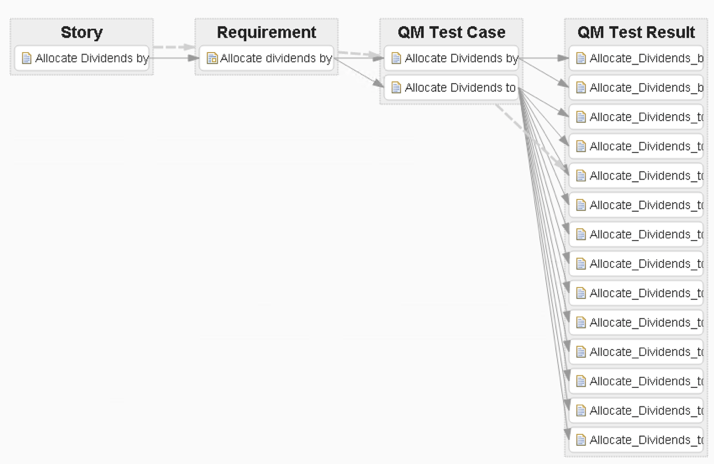
That’s all for now; later we’ll see how to make this view dynamic so that the Consumer of the view can easily select a Story with a single click and instantly see the traceability view change. We’ll also see how we can make the view more visually appealing by changing the colors, line shapes and so on.
Building Views with IBM Engineering Lifecycle Optimization – Engineering Insights (ENI) Part Three – Customizing the Look and Feel of Views (The Basics) >>
Andy Lapping
Technical Enablement Specialist
Watson IoT & Engineering Lifecycle Management





You must be logged in to post a comment.