Monitoring the increasing footprint of IBM Rational Team Concert (RTC) project areas can help customers develop accurate sizing and forecasts for future enterprise upgrades, in particular for customers who have been using RTC for some time. Moreover, the varying level of activity of individual projects provides valuable information which can drive the enterprise decision to archive selected projects or even identify obsolete ones. This blog elaborates on the means to generate such project metrics using the Report Builder of IBM Jazz Reporting Service (JRS) and IBM Collaborative Lifecycle Management (CLM) application Managed Beans (MBeans).
Report Builder of JRS
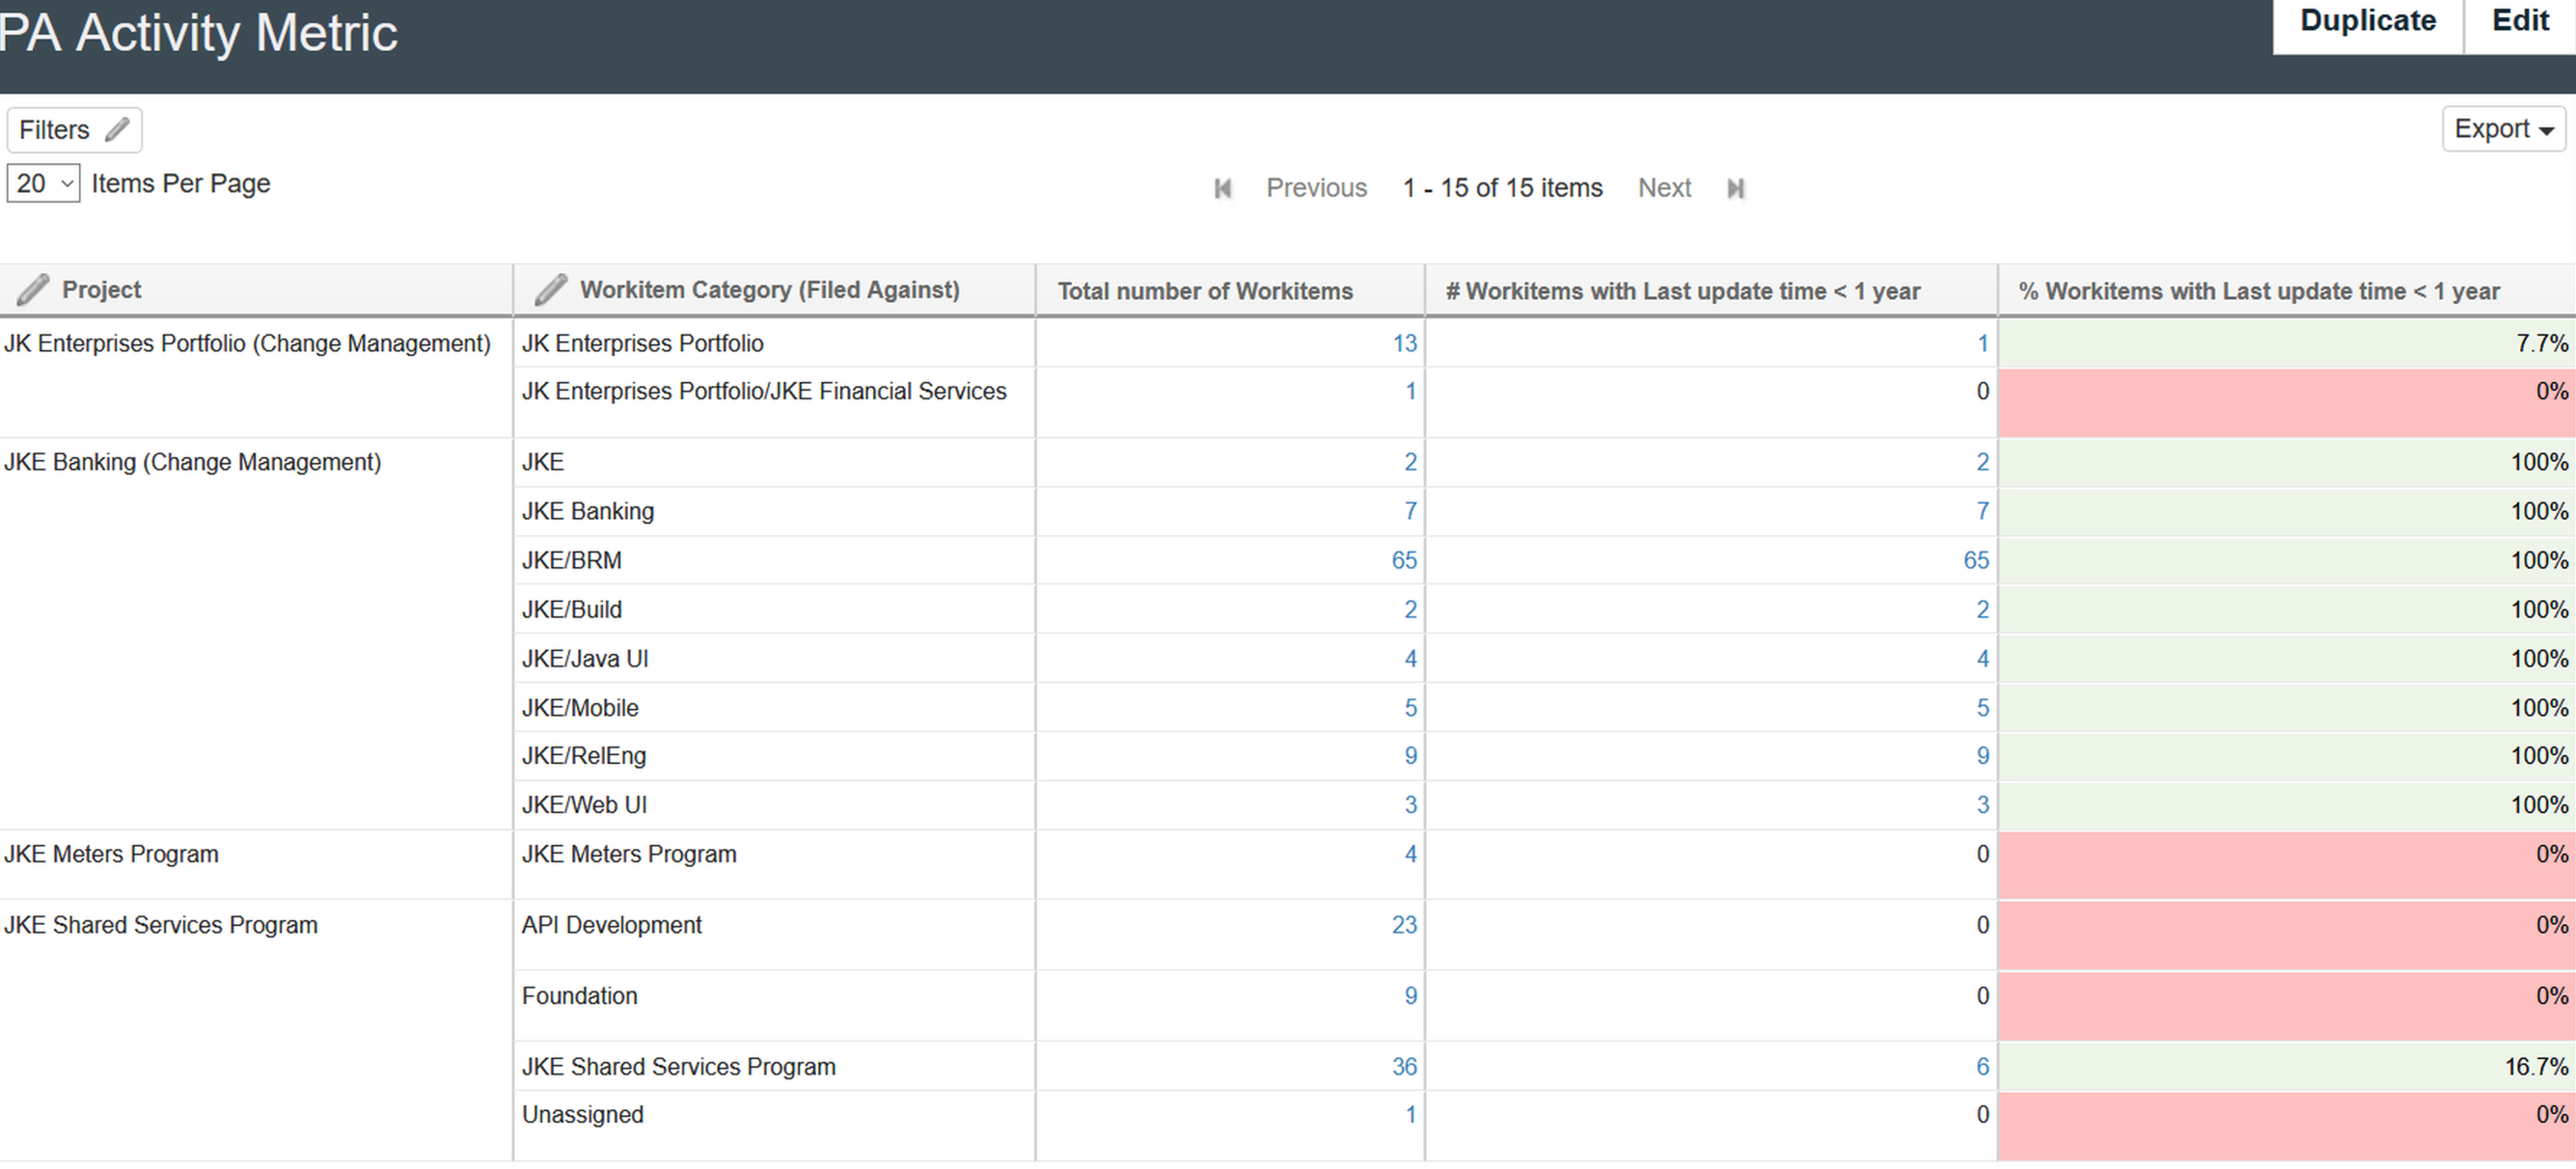
One measure of the activity level of an RTC project area is the percentage number of work items that have been updated within a specific configurable time frame (last year, for example). JRS Report Builder can be used to generate a report that produces the total number of work items and the percentage of active work items in all RTC projects within a repository, broken down according to their category (“Filed Against” is used here as the work item category).
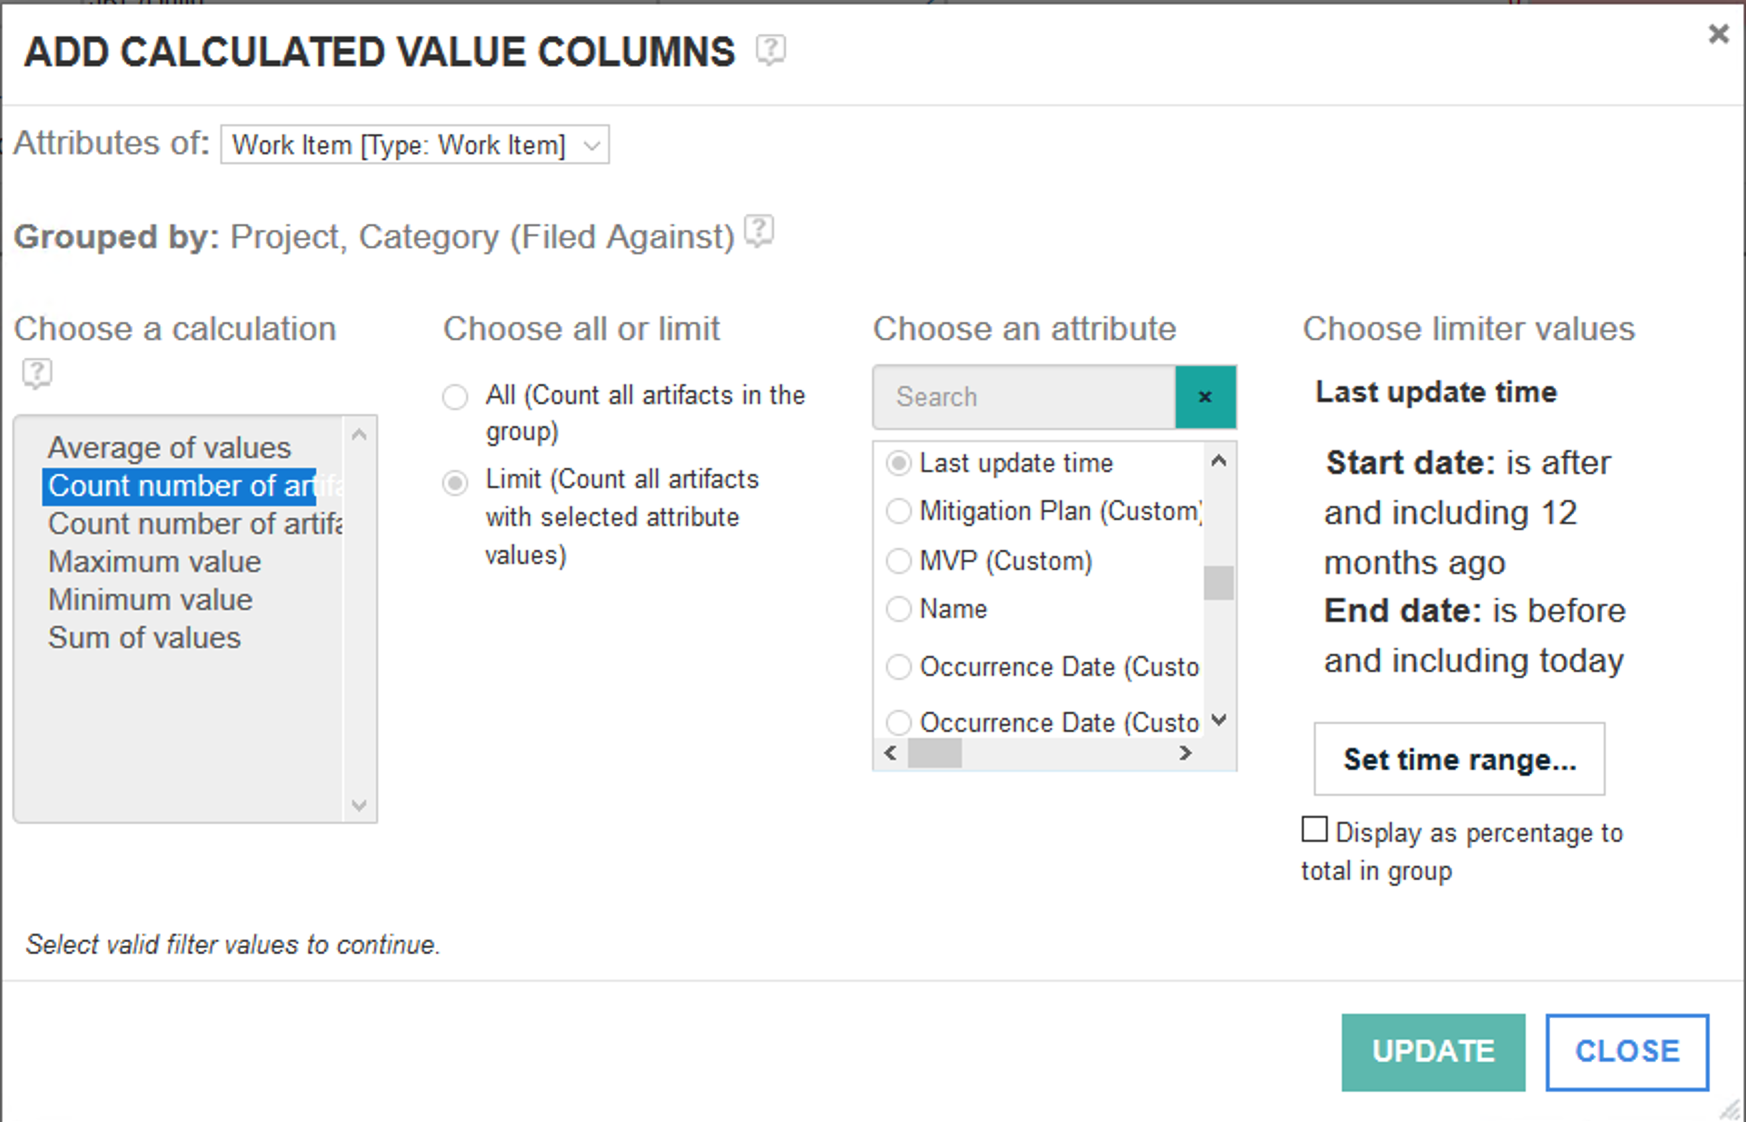
The definition of an active work item can be realized in the Report Builder using the Calculated Value Column with a time range setting, where the start date is set to 12 months ago and the end date is set to today’s date for a one-year time frame configuration. A screenshot showing the calculation of the count of active work items within a project area is provided in Figure 1.

Figure 1 – Count of active work items in an RTC project area
The report output (shown in Figure 2), which has been generated using test data, highlights the inactive or obsolete projects that have not been updated for the last year. The total count of work items in each project area can also give some indication of the project area size, albeit not necessarily an accurate measure as the number and total size of the work item attachments represent a major factor contributing to the project area footprint in the repository. Generation of a more accurate metric of the project footprint using MBeans is provided in the next section.

Figure 2 – RTC project area activity metrics
CLM MBeans
MBeans are Java objects that represent a manageable resource, available through Java Management Extensions (JMX) agent. CLM applications can be instrumented using MBeans to collect data for enterprise monitoring purposes. Part of this collected data is the Project Area Information which publishes the work items count and total attachments size for each project area in the repository.
For Derby database and WebSphere Application Server (WAS) on Windows environment, the steps to set up MBeans for generating project metrics are provided in this Section. For regular monitoring of projects footprint over time along with a large number of projects, Application Performance Monitoring (APM) solution will be needed to extract the data and generate the required dashboard reports and create the required alerts/warnings.
It is worth noting here that Repotools commands can be used to generate count and size of artifacts at the repository level, as addressed in this blog.
Steps for setting-up MBean monitoring
- Log in using the Jazz server Administrator user credentials.
- Navigate to RTC Application Administration > Advanced Properties.
- Set the current value to “true” in the CommonMetricsCollectorTask and ProjectMetricsCollectorTask to enable Projects Metrics MBean as shown in Figures 3 and 4, respectively.
- Set the Current Value to “true” in the DebugService to enable repodebug service as shown in Figure 5.
- Navigate to folder … >IBM>JazzTeamServer606>server>liberty>servers>clm
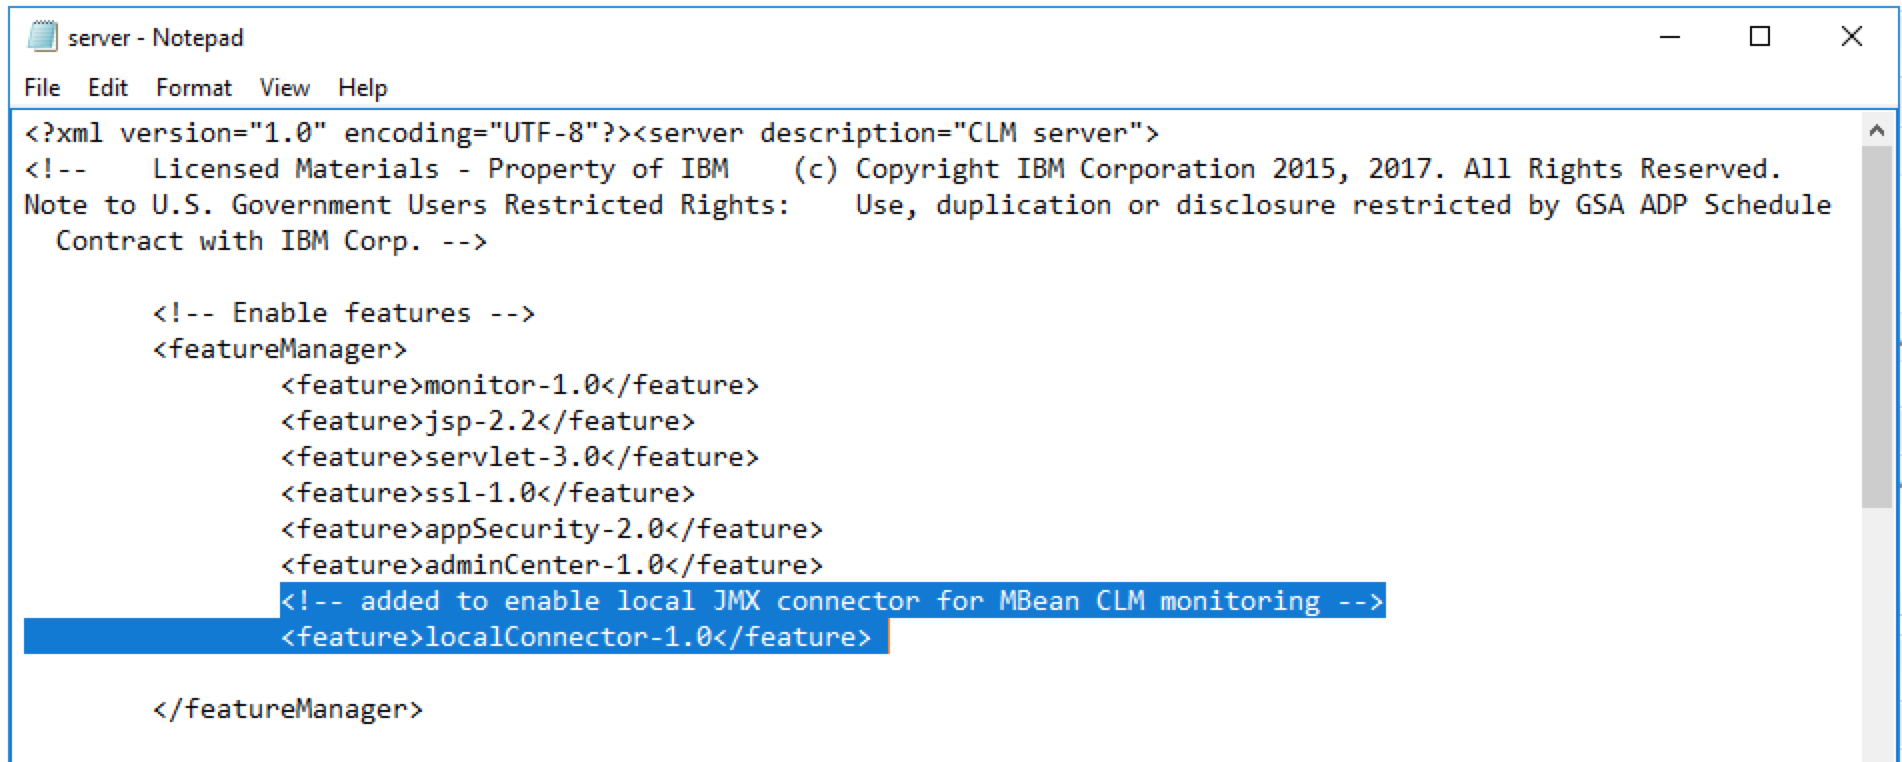
- Edit server.xml file (see Figure 6) to enable the local JMX Connector for MBean CLM monitoring.
- Restart JTS server.
- Open browser window and navigate to <domain name>:9443/ccm/repodebug
- Select “mxBeans” from the main menu.
- Populate the following fields in the JMX management beans service window as follows:
- Select “com.ibm.team.foundation.projectarea” in Domain field
- Select “projectMetrics” in Type field
- Optional – type “isArchived=’false’,Boolean” in Attribute Filters field to filter out Archived Projects
- Select the project in the MxBean Objects window
- The project metrics information is displayed in a separate window including the number of work items, number of attachments, and total size of attachments (in Bytes) as depicted in Figure 7.

Figure 3 – Enable MBeans property in CommonMetricsCollectorTask

Figure 4 – Enable MBeans property in ProjectMetricsCollectorTask

Figure 5 – Enable repodebug service

Figure 6 – Update of server.xml file

Figure 7 – MBeans project metrics information
Conclusion
In this blog, we have discussed how to proactively monitor RTC project size and level of activity at the enterprise level. JRS Report Builder provides a straightforward and systematic approach to develop a dashboard widget for regular monitoring by the repository administrator. For an accurate estimate of the project footprint in the repository, CLM MBeans can be instrumented to collect project area metrics. The details of each approach are provided with screenshots of the steps and the output results.
Useful Links
- IBM Knowledge Center – Jazz Reporting Service
- IBM Knowledge Center – Authoring Reports with Report Builder
- Jazz.Net Tim Feeney’s Blog – Monitoring Jazz Applications using JMX MBeans
- Tim Feeney’s Blog – How many artifacts do I have in my Jazz application repository?
- IBM Knowledge Center – Connecting to Liberty by using JMX
- Jazz.Net – Common Metrics Collector Task
- Jazz.Net – Project Metrics Collector Task
You must be logged in to post a comment.


I am trying to follow this post to understand how to enable mBeans and how they work. In step 3 above:
Set the current value to “true” in the CommonMetricsCollectorTask and ProjectMetricsCollectorTask to enable Projects Metrics MBean as shown in Figures 3 and 4, respectively.
when I login to ccm/admin and go to Advanced Properties, I cannot fine either of these Collecter Tasks.
I am at version 6.0.6.1. Is there a place where I can find some basic (step-by-step) instructions for enabling an mBean and then seeing it’s value through the web browser?
Can you please ensure that you are logged in as Admin?