
Reporting is critical in helping organizations lead lean enterprise transformations, and we’re listening and responding… In the latest drop of the Enterprise Scaled Agile reports for your IBM Continuous Engineering (CE) and IBM Rational Collaborative Lifecycle Management (CLM) environments, we’ve included some of the most important industry-standard reports — like Cumulative Flow, Burn-Up and Burn-Down Charts — as well as some of the more basic reports for compliance and audit requirements and continuous improvement.
Best of all, you don’t have to be truly agile yet to take advantage of these! Here is a quick peek at what’s new in CE/CLM 6.0.6…
Enterprise Scaled Agile Reports
Not using the SAFe® templates in IBM Rational Team Concert? No problem. The reports in this archive file are for you! While there are some very minor assumptions in some of these reports – you might need to be using Story Points or the Scrum template, for example – for the most part there are no limitations on your process to take advantage of these reports.
Here is what we’ve added since delivering the archive file back in February 2018:
- Approval Audit Trail
- Days in State (by Month)
- Defect Days in Current State
- Estimated vs Actual Hours
- Program Average Velocity
- Program Burn-Down Chart (by Story Points)
- Program Burn-Up Chart (by Story Points)
- Solution Epic Average Velocity
- Story Cumulative Flow Diagram
- Team Average Velocity
- Team Burn-Down Chart (by Story Points)
- Work Item Cycle Time (by PI)
SAFe 4.5 Reports
For those of you that do use the SAFe templates, these additional reports will be helpful. You can — and should — also import the Enterprise Scaled Agile reports above to get everything we have. In addition to what was delivered in February 2018, this archive now contains:
- Capability Cumulative Flow Diagram
- Feature Cumulative Flow Diagram
- Feature Progress by Team – Specific PI [Advanced SQL]
- Portfolio Epic Burn-Up Chart (FULL SAFe)
- Portfolio Epic Burn-Up Chart (PORTFOLIO SAFe)
- Solution Epic Burn-Up Chart
What’s new preview
As a teaser, here are some of the new reports published.
Program-Level
Examples of Program-level Burn-Up and Burn-Down charts are shown below.

Program Burn-Up Chart

Program Burn-Down Chart
Approval Audit Trail
A key differentiator for the CE solution in the Scaled Agile space is the fact that we provide audit readiness. This report is an example of how to track an aspect of the audit trail related to change approvals.
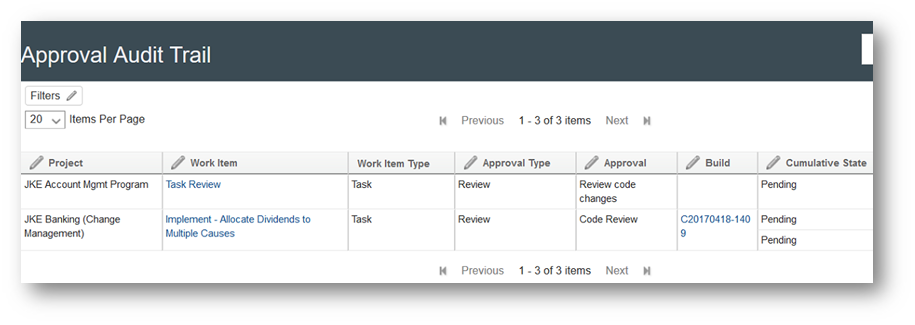
View the audit trail for change approvals
Where should I go for more info?
Glad you asked… First, we’ve published guidance to help you choose which archive files to import and how to import them successfully. This guidance also explains in detail what the reports are for and how to use the filters. This document is called Enterprise Scaled Agile Reporting Guidelines, and it can be found here.
Second, we’ve published additional information that is new to categorize the reports by Functional Group, Organizational Level and Complexity. This document is called Enterprise Scaled Agile Reports Details, and it can be found here.
Once you’ve imported the reports that you want into your local environment, you can add them as widgets on dashboards, setting the filters so that the results show the scope of information you want. But that’s not all! You can also copy these reports and edit them. This helps you not only create customized versions of them but also teaches you how to write your own reports. Nothing better than learning by looking at examples.
I hope your enticed enough to go check them out! I do love feedback and questions, so please don’t hesitate to reach out! Visit our our SAFe landing page for more information on SAFe.
Amy Silberbauer (asilber@us.ibm.com)
Ask questions on the Jazz.net forum. Stay connected with Jazz.net on Facebook and Twitter. Watch us on YouTube.
 (No Ratings Yet)
Authors
 Adam Archer (1)
 Adam Neal (1)
 Adrian Cho (15)
 Alice Connors (3)
- Amy Silberbauer (24)
 Andrew Hans (1)
 Andy Lapping (15)
 Anindita Basu (3)
 Anthony Hunter (1)
 Benjamin Pasero (5)
 Benjamin Williams (3)
 Bernie Coyne (6)
 Beth Zukowsky (2)
 Bhawana Gupta (10)
 Bianca Jiang (3)
 Bill Higgins (2)
 Boris Kuschel (2)
 Brent Barkman (2)
 Brian Bryson (1)
 Brian King (4)
 Brian Lang (2)
 Brian Massey (3)
 Brian Sanders (2)
 Bruce MacIsaac (2)
 Carlos Ferreira (1)
 Carolyn Pampino (10)
 Catherine Burrows (1)
 Chandra Venkatapathy (1)
 Chris Daly (1)
 Chris Trobridge (1)
 Christophe Cornu (3)
 Christophe Elek (5)
 Christophe Telep (14)
 Clara Forero (1)
 Clare Carty (4)
 Dan Barbour (1)
 Dan Griffin (5)
 Dan Leroux (2)
 Daniel Berg (2)
 Daniel Moul (27)
 Daniel Toczala (4)
 Darin Swanson (1)
 Darrel Rader (1)
 Dave Thomson (7)
 David Brauneis (1)
 David Hodges (1)
 Dejan Glozic (2)
 Denise Cook (1)
 Derek Baron (8)
 Dibbe Edwards (3)
 Dirk Baeumer (1)
 Don Yantzi (1)
 Doron Ben-Ari (3)
 ELM Engineering (42)
 Eran Gery (1)
 Erich Gamma (5)
 Erik Craig (1)
 Ernest Mah (1)
 Evan Hughes (3)
 Fariz Saracevic (16)
 Frederic Fusier (1)
 Gary Cernosek (1)
 George DeCandio (4)
 Gili Mendel (1)
 Ginny Ghezzo (1)
 Graham Bleakley (5)
 Grant Covell (1)
 Greg Gorman (1)
 Guy Slade (1)
 Hadar Hawk (2)
 Heidi Stadel (1)
 James Branigan (2)
 James Moody (2)
 Jan Wloka (2)
 Jared Pulham (7)
 Jean-Michel Lemieux (23)
 Jeanette Deupree (1)
 Jim Amsden (1)
 Jim D'Anjou (2)
 Jim Ruehlin (1)
 Johannes Rieken (2)
 John Kellerman (2)
 John Vasta (1)
 John Whitfield (2)
 John Wiegand (1)
 Jozef deVries (1)
 Kai-Uwe Maetzel (6)
 Kalena Kelly (1)
 Karen Gosciminski (1)
 Kate Draper (2)
 Kate Hauser (1)
 Kevin Williams (2)
 Kim Peter (10)
 Kiran M N (1)
 Kit Lo (1)
 Kourken Aroyan (1)
 Kumaraswamy Gowda (15)
 Lauren Hayward Schaefer (15)
 Lawrence Mandel (2)
 Linda Watson (3)
 Liz Bonesteel (1)
 Luc Hatlestad (1)
 Lucinio Santos (1)
 Maneesh Mehra (3)
 Manoj Panda (1)
 Mario Maldari (1)
 Mark Guertin (2)
 Martha Andrews (3)
 Mary Yost (1)
 Masabumi Koinuma (1)
 Mats Gothe (1)
 Matt Lavin (1)
 Michael Fiedler (1)
 Michael Halder (2)
 Michael Valenta (3)
 Millard Ellingsworth (3)
 Miran Badzak (1)
 Monica Luke (5)
 Moshe Cohen (1)
 Nadra Rafee (1)
 Nathan Bak (5)
 Neil Leblanc (3)
 Nick Crossley (3)
 Nithya Rajagopalan (3)
 Palak Sheth (1)
 Patrick Streule (1)
 Paul Ellis (1)
 Paul Strachan (1)
 Paul Tasillo (2)
 Peter Haumer (1)
 Peter Steinfeld (1)
 Phil Vogel (3)
 Priyadarshini Gorur (3)
 Rahul Choudhary (4)
 Reuben Varzea (12)
 Richard Bone (3)
 Richard Watson (13)
 Rishikesh Agam (2)
 Robbie Minshall (1)
 Robin Bater (5)
 Roger LeBlanc (1)
 Rolf Nelson (16)
 Rosa Naranjo (1)
 Rosalind Radcliffe (1)
 Ryan Manwiller (4)
 Sandeep Kohli (1)
 Sandeep Somavarapu (1)
 Sanjesh Nair (1)
 Scott Rich (13)
 Sean Babineau (1)
 Seth Packham (11)
 Sharoon Shetty Kuriyala (1)
 Sreerupa Sen (5)
 Sridevi Sangaiah (1)
 Steve DiCamillo (2)
 Steven Beard (1)
 Subramanya Pilar (6)
 Sujan Surendrananitha (2)
 Suneel Santharam (2)
 Susan Yeshin (1)
 Tim Feeney (7)
 Tod Creasey (1)
 Tom Hollowell (4)
 Ubaidu Peediakkal (3)
 Vaibhav Srivastava (1)
 Vandana Shenoy (1)
 Vatsalkumar Parmar (2)
 Virginia Lovering (1)
 Will Streit (1)
You must be logged in to post a comment.