
Glad you asked! As an organization that relies heavily on really great reports, we have some personal favorite enhancements to highlight. Of course, you can read all about the Rational solution for Collaborative Lifecycle Management Highlights of 6.0.3 and also review the complete set of “New & Noteworthy” updates to Jazz Reporting Service (JRS) by visiting Jazz Reporting Service 6.0.3.
Enhanced user experience
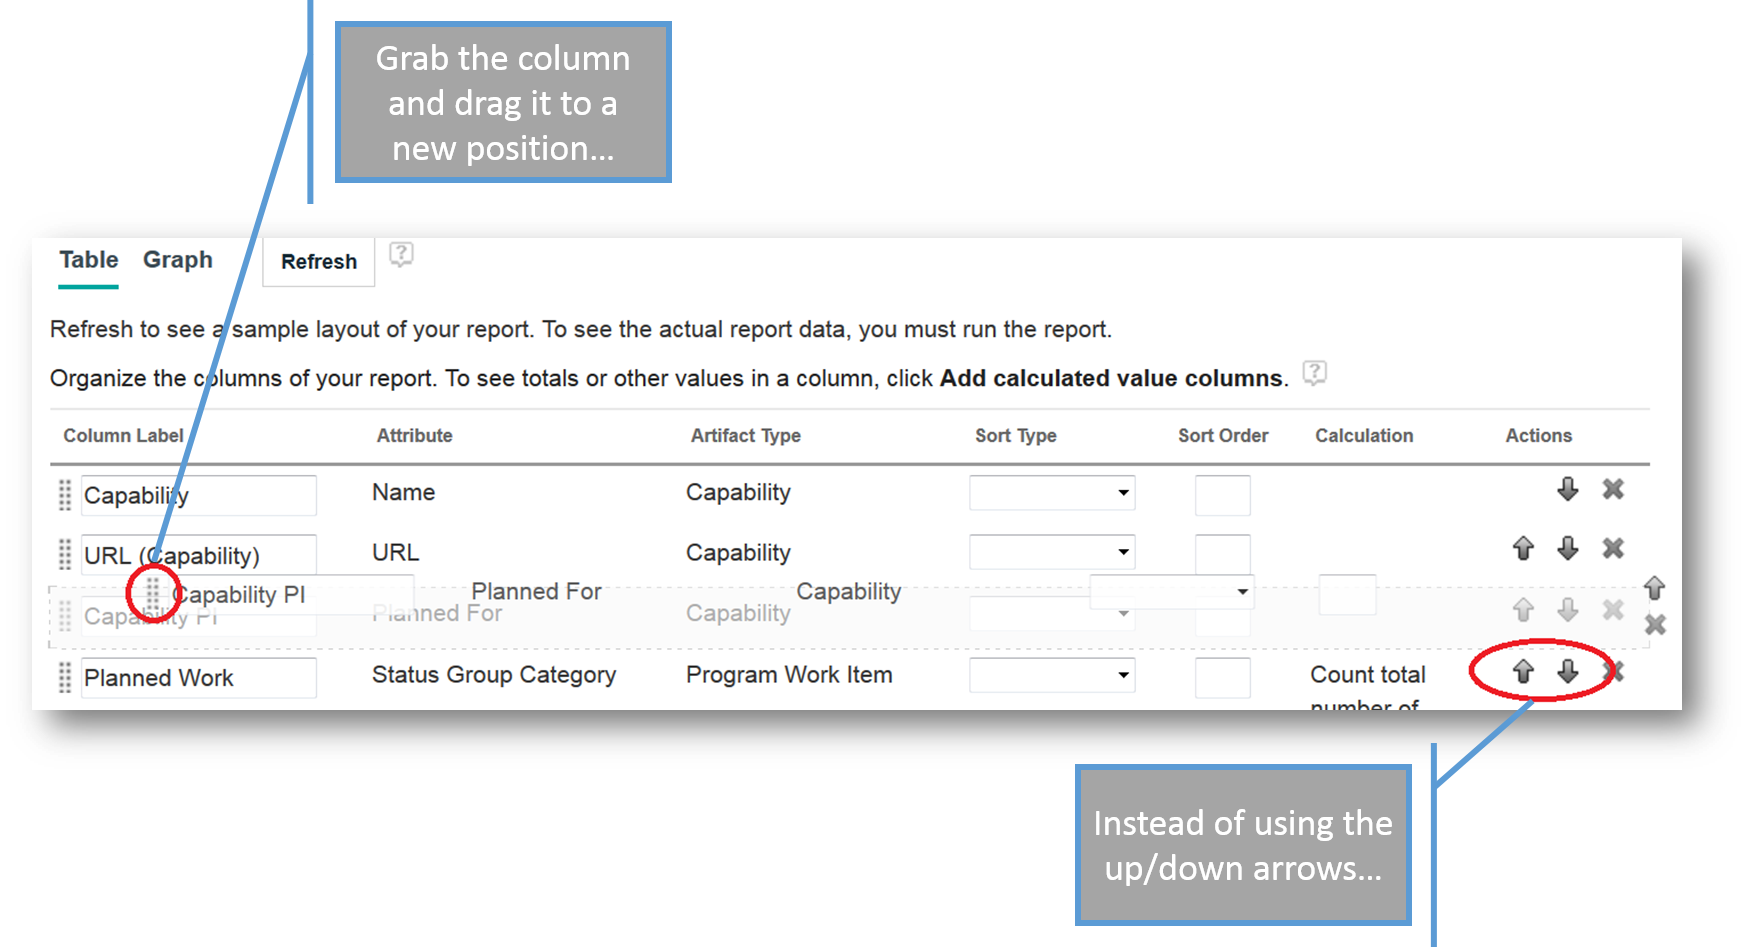
Who doesn’t want a better user experience? I know, Report Builder is pretty easy to use. But, the more you use it, the more you want it to do for you… am I right? If you’re already using Report Builder to create reports in earlier versions of JRS, you will really appreciate my personal favorite enhancement — the ability to re-order columns using drag-and-drop. How can anything that seems so trivial be so awesome? Just write a few reports yourself, then a few more. Previously, you had to use the up and down arrows to move columns position-by-position. Tedious to say the least! Now, just grab a column and move it where you want it in the tabular results:
Golden! Another great enhancement provides you with the ability to learn while doing. There is truly no other (or better) way. While you’re in Report Builder, just click the Learn button:

There’s more, but let’s move on to the enhanced capabilities – which indirectly make for a better user experience.
Enhanced report writing capabilities
There are all sorts of new capabilities to develop great reports, but a few in particular just make my day!
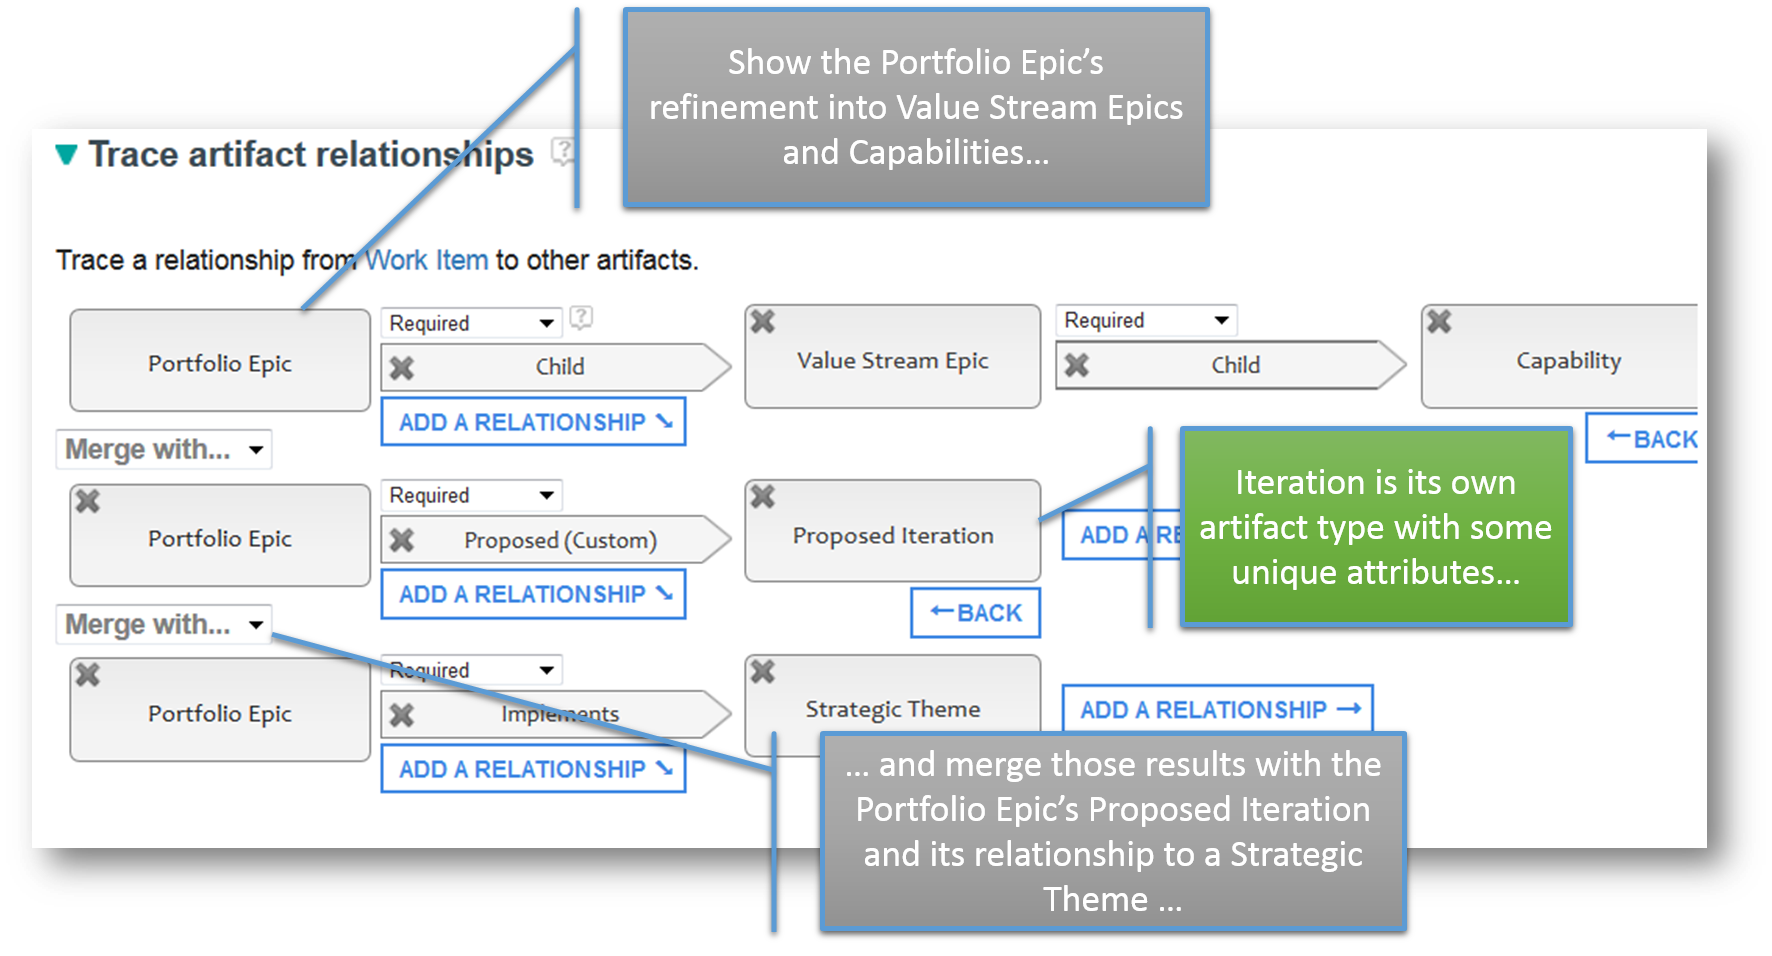
Building the traceability tree
Like me, I’m sure those of you experienced with Report Builder have been waiting for the ability to develop multiple levels of traceability from a single starting point. It’s here now, along with the ability to include more complex data in the traceability tree:
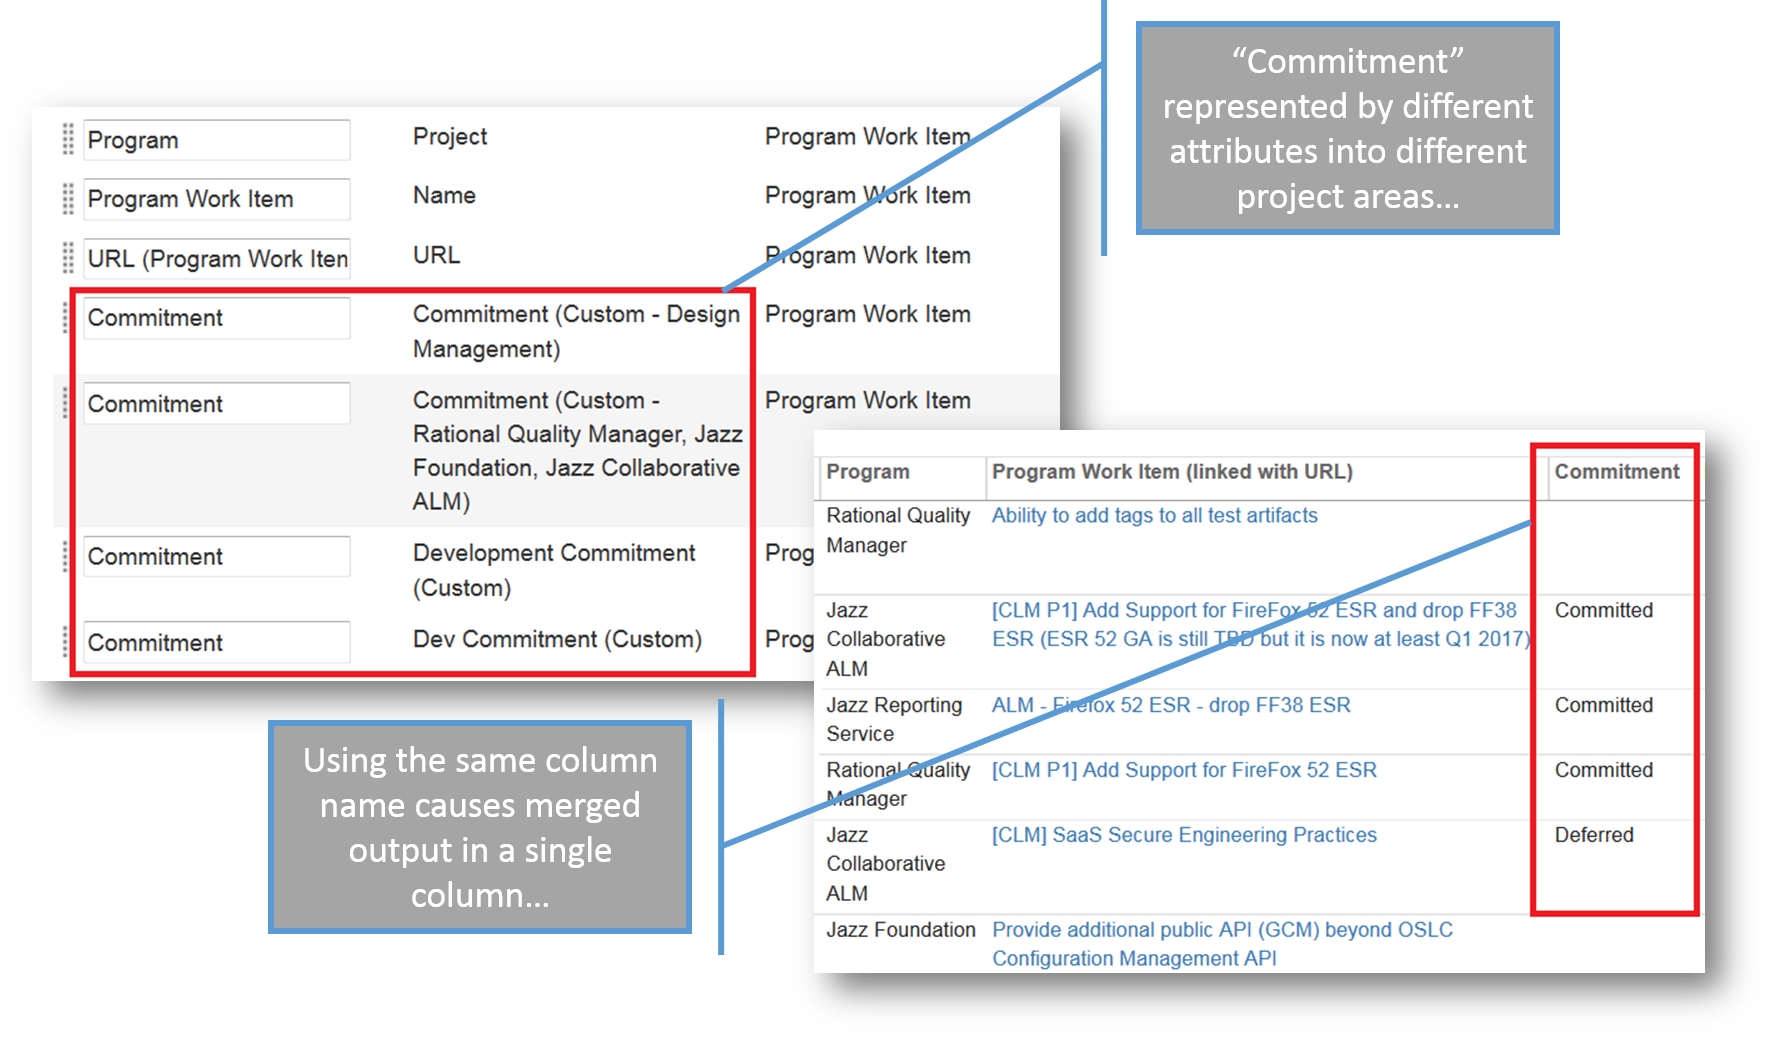
Combining results in the Table view
Why do you care about this? Let’s say you want to report across multiple projects and each uses its own attribute to reflect similar information. Yes, you have to add all of the attributes into the Report, but the results can be combined into a single column:
More, better graphics!
I admit it, I can spend hours tweaking my report graphics. It’s just plain fun! I could probably also spend hours telling you about the great new graphical renderings you can create in 6.0.3, but the “New & Noteworthy” article does a good job of that. More control over content and colors, combining bars and lines, more control over the rendering and the ability to label the results are all now possible in 6.0.3.
Please do visit the Jazz Reporting Service 6.0.3 and don’t hesitate to reach out to us if you have questions or need any help as you begin (or continue) your report writing journey.
Amy Silberbauer (asilber@us.ibm.com)
Moshe Cohen (mcohen@us.ibm.com)
Stay connected with Jazz.net on Facebook and Twitter. Watch us on YouTube.
 (1 votes, average: 5.00 out of 5)
Authors
 Adam Archer (1)
 Adam Neal (1)
 Adrian Cho (15)
 Alice Connors (3)
- Amy Silberbauer (24)
 Andrew Hans (1)
 Andy Lapping (15)
 Anindita Basu (3)
 Anthony Hunter (1)
 Benjamin Pasero (5)
 Benjamin Williams (3)
 Bernie Coyne (6)
 Beth Zukowsky (2)
 Bhawana Gupta (10)
 Bianca Jiang (3)
 Bill Higgins (2)
 Boris Kuschel (2)
 Brent Barkman (2)
 Brian Bryson (1)
 Brian King (4)
 Brian Lang (2)
 Brian Massey (3)
 Brian Sanders (2)
 Bruce MacIsaac (2)
 Carlos Ferreira (1)
 Carolyn Pampino (10)
 Catherine Burrows (1)
 Chandra Venkatapathy (1)
 Chris Daly (1)
 Chris Trobridge (1)
 Christophe Cornu (3)
 Christophe Elek (5)
 Christophe Telep (14)
 Clara Forero (1)
 Clare Carty (4)
 Dan Barbour (1)
 Dan Griffin (5)
 Dan Leroux (2)
 Daniel Berg (2)
 Daniel Moul (27)
 Daniel Toczala (4)
 Darin Swanson (1)
 Darrel Rader (1)
 Dave Thomson (7)
 David Brauneis (1)
 David Hodges (1)
 Dejan Glozic (2)
 Denise Cook (1)
 Derek Baron (8)
 Dibbe Edwards (3)
 Dirk Baeumer (1)
 Don Yantzi (1)
 Doron Ben-Ari (3)
 ELM Engineering (42)
 Eran Gery (1)
 Erich Gamma (5)
 Erik Craig (1)
 Ernest Mah (1)
 Evan Hughes (3)
 Fariz Saracevic (16)
 Frederic Fusier (1)
 Gary Cernosek (1)
 George DeCandio (4)
 Gili Mendel (1)
 Ginny Ghezzo (1)
 Graham Bleakley (5)
 Grant Covell (1)
 Greg Gorman (1)
 Guy Slade (1)
 Hadar Hawk (2)
 Heidi Stadel (1)
 James Branigan (2)
 James Moody (2)
 Jan Wloka (2)
 Jared Pulham (7)
 Jean-Michel Lemieux (23)
 Jeanette Deupree (1)
 Jim Amsden (1)
 Jim D'Anjou (2)
 Jim Ruehlin (1)
 Johannes Rieken (2)
 John Kellerman (2)
 John Vasta (1)
 John Whitfield (2)
 John Wiegand (1)
 Jozef deVries (1)
 Kai-Uwe Maetzel (6)
 Kalena Kelly (1)
 Karen Gosciminski (1)
 Kate Draper (2)
 Kate Hauser (1)
 Kevin Williams (2)
 Kim Peter (10)
 Kiran M N (1)
 Kit Lo (1)
 Kourken Aroyan (1)
 Kumaraswamy Gowda (15)
 Lauren Hayward Schaefer (15)
 Lawrence Mandel (2)
 Linda Watson (3)
 Liz Bonesteel (1)
 Luc Hatlestad (1)
 Lucinio Santos (1)
 Maneesh Mehra (3)
 Manoj Panda (1)
 Mario Maldari (1)
 Mark Guertin (2)
 Martha Andrews (3)
 Mary Yost (1)
 Masabumi Koinuma (1)
 Mats Gothe (1)
 Matt Lavin (1)
 Michael Fiedler (1)
 Michael Halder (2)
 Michael Valenta (3)
 Millard Ellingsworth (3)
 Miran Badzak (1)
 Monica Luke (5)
 Moshe Cohen (1)
 Nadra Rafee (1)
 Nathan Bak (5)
 Neil Leblanc (3)
 Nick Crossley (3)
 Nithya Rajagopalan (3)
 Palak Sheth (1)
 Patrick Streule (1)
 Paul Ellis (1)
 Paul Strachan (1)
 Paul Tasillo (2)
 Peter Haumer (1)
 Peter Steinfeld (1)
 Phil Vogel (3)
 Priyadarshini Gorur (3)
 Rahul Choudhary (4)
 Reuben Varzea (12)
 Richard Bone (3)
 Richard Watson (13)
 Rishikesh Agam (2)
 Robbie Minshall (1)
 Robin Bater (5)
 Roger LeBlanc (1)
 Rolf Nelson (16)
 Rosa Naranjo (1)
 Rosalind Radcliffe (1)
 Ryan Manwiller (4)
 Sandeep Kohli (1)
 Sandeep Somavarapu (1)
 Sanjesh Nair (1)
 Scott Rich (13)
 Sean Babineau (1)
 Seth Packham (11)
 Sharoon Shetty Kuriyala (1)
 Sreerupa Sen (5)
 Sridevi Sangaiah (1)
 Steve DiCamillo (2)
 Steven Beard (1)
 Subramanya Pilar (6)
 Sujan Surendrananitha (2)
 Suneel Santharam (3)
 Susan Yeshin (1)
 Tim Feeney (7)
 Tod Creasey (1)
 Tom Hollowell (4)
 Ubaidu Peediakkal (3)
 Vaibhav Srivastava (1)
 Vandana Shenoy (1)
 Vatsalkumar Parmar (2)
 Virginia Lovering (1)
 Will Streit (1)
You must be logged in to post a comment.