This v6 sizing strategy is now superseded the v7 version. See Sizing ELM deployments for 7.x releases.
Introduction
Whether new users or seasoned experts, customers using IBM Jazz products all want the same thing: They want to use the Jazz products without worrying that their deployment implementation will slow them down, and that it will keep up with them as they add users and grow. A frequent question we hear, whether its from a new administrator setting up Collaborative Lifecycle Management (CLM) for the first time, or an experienced administrator keeping an eye on an existing deployment , is How many users will my environment support? In this article, we'll answer that question by drawing on the tests executed by the Rational Performance Engineering team, the hardware and sizing models generated by IBM Global Techline (an internal pre-sales support organization), as well as our analysis of many customer deployments.
Estimating the number of users that can be supported by a given set of hardware is hard to do precisely, since so much depends on what exactly the users are doing. So, we'll provide estimates for what we consider typical workloads running against typical datasets. We'll also provide information on what most influences the performance of a deployment, so you can evaluate whether these typical workloads can be good predictors for your own deployments.
Standard disclaimer
The information contained in this article is derived in part from data collected from tests performed in IBM test labs, under controlled conditions. Customer results may vary greatly. Sizing does not constitute a performance guarantee. IBM assumes no liability for actual results that differ from any estimates provided by IBM.
Factors that influence performance
Later in this document, we provide estimates for the number of users that typical deployments of the CLM products can support. But to put those estimates into context, we need to discuss the factors that most influence performance, so you can understand whether the estimates will apply to your specific environments. Here are the things we consider when designing our own performance tests:
- Deployment topology. How many servers will be deployed, and what are the specifications of the servers (memory, number of CPUs, disk I/O speed)?
- Data. How big is the deployment (how many artifacts and of what kind)? At what rate is the deployment growing, as people create more artifacts?
- Application usage. How many people are actively using the system at any one time? What are those people doing? Has the application been customized or extended?
As a starting point, we assume a server will have at least 16G of total RAM (with 8G dedicated to Java) and 8 logical processors. You may need more memory or more processors, however, depending on your workload (and in some cases, you may be able able to use less). Additionally, deployments involving more than 50 active users should be deployed across multiple servers, as described in our
recommended deployment topologies for the CLM and SSE products on the jazz.net Deployment wiki.
Impact of deployment topology
As a general rule, the number of active users that can be supported by a deployment is most strongly influenced by the number of available processors. Our own performance tests show that the throughput which a deployment can handle (in terms of requests per second) increases linearly as the number of processors increases (up to 24 processors, anyway). As the number of active users increases, the number of requests sent to the server over a given interval increases. Since these requests are handled in parallel inside the application server, you need more CPUs available to handle more parallel work. As the CPU utilization on a server nears 100%, it takes longer to process the transactions, which means that response times degrade.
The reliability of a CLM deployment is most strongly influenced by the available RAM. Without enough memory, the CLM applications can hang or crash. You'll need to allocate enough RAM to satisfy the primary consumers of memory on a CLM server, which are:
- The memory heap for the Java run-time environment that is running the CLM application
- Native memory used by the Java run-time (especially critical for network operations involving file transfers)
- Memory used by the operating system.
The amount of RAM available can also influence performance, in two primary ways:
- If the JVM heap is not large enough, or is not tuned correctly, system performance can be degraded by garbage collection.
- If there is too much demand for memory, the operating system's file cache may shrink and this can impact the caching of index data used by CLM applications. This is especially true for DOORS Next Generation and the Lifecycle Query Engine.
These factors are behind our
recommended deployment topologies for the CLM and SSE products on the jazz.net Deployment wiki. We recommend running each application on its own server, with a separate JTS server. We would additionally recommend no fewer than 8 logical processors per server and 16G of RAM (with 8G dedicated to the JVM heap). Deploying multiple systems of this class allows the CLM workload to be spread out across more processors and memory, and allows each application to run without interference from other co-located applications.
There are exceptions to 8 processor/16G recommendations, and these will be discussed later. You may need as much as 256G of RAM for large DOORS Next Generation or Lifecycle Query Engine deployments, for example. Your database servers will usually benefit from additional RAM and processors, especially as your deployment grows. Also, if you deploy fewer servers (e.g. combining Rational Team Concert, Rational Quality Manager, and Jazz Team Server on one system), those servers will need to be larger. A 4 processor/8G server will struggle with 50 active users, especially when all of the CLM applications are running on one server. Keep this in mind if you are considering using a
departmental topology. You may be able to use systems with 4 processors/8G RAM for RTC workloads that only involve workitems.
You will notice that the
published test reports utilize hardware (cores and RAM) which are sized generously. A well designed deployment will be able to handle peak loads and unexpected usage patterns. We customarily size environments so that they may be able to accommodate bursts of up to double the amount of expected normal load. However, we do not recommending presuming an environment can handle such extreme loads for more than 5% of their standard operational time.
Impact of data (repository size)
The size of your repository can impact performance, and can influence the hardware requirements needed to deliver good performance. When we talk about repository size, we really mean two distinctly different things:
- The number of artifacts of each particular type (e.g. how many work items, how many test cases, how many requirements...). We think of this as the repository size.
- The structure of those artifacts and the relationships between them (e.g. work items can be associated with a development plan, test cases can be associated with a test plan, requirements can be added to a module, artifacts can reference each other via links...). We think of this as the repository shape.
We recommend that you develop a model of how your users will interact with the system, so that you can have a rough idea of how the size of the deployment will evolve over time. When we do this for our own performance tests, we start by thinking about the user population, and we identify the primary roles which individuals take on as they do their jobs. We then define the operations which each role is likely to perform, and we estimate the frequency at which each operation will occur. From this you can then estimate how many artifacts are likely to be created over time.
For example, you may have a total user base of 1000 people. If half of those people are using Rational Team Concert, and if on average the RTC users create 5 work items per day, then the total number of workitems created per day would be 1000 x .5 x 5 = 2500 work items per day. Over the course of a year (assuming a 5 day work week and 50 working weeks per year), that would work out to 625,000 work items per year. You could further refine this model by thinking about the project structure and how these 625,000 work items would be distributed across RTC project areas. You could think about how long your development iterations are, and then estimate how many work items are managed in a typical iteration to estimate how big your development plans are likely to be, and how much data is likely to surface in dashboard queries.
The size and shape of your repository has an influence on several areas:
- The full-text index (used for artifact searching) grows as artifacts are added.
- Several components use a triple-store database (based on Jena technology), and this will grow as artifacts are created. The components which are most impacted by the size of the triple-store are:
- DOORS Next Generation
- The Lifecycle query engine
- In CLM 6.x and later, the backlink indexing service that runs on the Jazz Team Server (JTS)
- The database tables which store CLM data grow as the number of artifacts grows. SQL queries may then return increasing amounts of data over time. This can be computationally expensive (such as applying complex joins) as well as memory-intensive (due to storing the query results in memory)
- Native Java memory (specifically, direct memory buffers), used by the Web application servers to send information over the network to browsers (or RTC Eclipse clients). The source code management features in RTC can be particularly impacted by the size of source files, the number of files in a workspace, and frequency at which workspaces are refreshed (such as through builds).
- Java heap memory, since larger repositories result in more data being transferred from server to client, which then requires additional memory in the CLM application servers. As the memory demands on the Java heap grow, performance can degrade if garbage collection gets triggered more frequently. There can also be high transient demands on memory (e.g. when running reports which return large result sets).
Both the full-text index and the triple-store use the operating system's file system cache to help optimize queries. The file system cache will keep the indices in memory if there is enough free RAM, but if other applications need RAM, the operating system will shrink the file system cache. You'll get the best performance out of a server with large indices if you have enough RAM to keep most of the indices in memory. As a rule of thumb, you can look at the size of the indices on disk, and estimate the total amount of RAM required by looking at the sum of: JVM max heap size + disk size of indices...and then add an additional 4G for the overhead of operating system processes.
Some CLM applications (like the Lifecycle Query Engine) use memory-mapped I/O for the triple-store, instead of the file cache. But the dynamic is similar: you need enough RAM to keep the indices in memory in order to maintain performance.
Database servers also benefit from additional RAM as repositories grow. Most databases use memory to cache information (like DB2's buffer pools), so when you have more RAM, you have the ability to cache more data (which can then speed up SQL queries). Since a single database server is usually shared between the CLM application servers, the memory demands on the database server are a functional of the combined load across all CLM application servers. If your CLM deployment will host millions of artifacts, across multiple applications like RTC, RQM, and DNG - then you should deploy database servers with 32G or more of memory.
Tuning the JVM can be complex, but we have a few recommendations:
- Use a gencon (generational collector) garbage collection strategy
- Set the max and the minimum heap values to the same value, and use a heap of no less than 4G (and no more than 24G). By keeping the max and min heaps at the same value, you reduce the work which the JVM would otherwise do to shrink the heap.
- Size the nursery to be at least 25% of the max heap (although 33% is better). With a gencon garbage collection strategy, the nursery is a place for fast access to transient memory, like the memory used to satisfy an incoming HTTP request. Memory that is needed by the application for a long time will get moved out of the nursery into a different section of JVM memory - and both the transfer process and the ongoing management of the long-term JVM memory is more expensive. So, as the number of active users goes up, and the amount of memory needed to satisfy their requests goes up (because of repository growth), dedicating more memory to the nursery can improve response times. See http://www.ibm.com/developerworks/websphere/techjournal/1106_bailey/1106_bailey.html for more details on how this works.
The final topic regarding JVM memory and repository size concerns native memory. An in-depth discussion of how Java uses native memory is available on developerWorks (see
http://www.ibm.com/developerworks/library/j-nativememory-linux/) . This applies to CLM because the networking support in the application servers uses direct memory buffers (which are a kind of native memory) to transfer data. It turns out that direct memory can be reclaimed by the Java garbage collector, but that reclamation is not very sophisticated. If a Java program asks for direct memory and there isn't enough, then the allocation code forces garbage collection to run by calling System.gc. Unfortunately, this is an inefficent mechanism for reclaiming Java memory, and so it can result in a long pause (the JVM stops other processing while doing garbage collection). It can also result in more frequent garbage collections cycles than would be required solely by the usage of heap memory.
One way to improve matters is to use a JVM flag to allocate enough direct memory so that the rate of System.gc calls is reduced (e.g. setting -XX:MaxDirectMemorySize=
). To bring this back to our original topic of data - if your source code repository includes large files, or if your build schedule involves many parallel builds or a large number of files, you can end up needing many gigabytes of direct memory, which in turn means you need more RAM on your RTC server. As much of 3G of direct memory can be required even in the case of a single user trying to load a workspace containing a single 1G file.
Other references:
Impact of application usage
Although it is somewhat obvious, the way in which the user population interacts with a CLM deployment can impact performance. You should have some understanding of what people are going to be doing when considering how to size your servers. The main things to consider are:
- How many total users do you expect? How many users are likely to use the different CLM products?
- At any given point, how many users will be actively using the system?
- What will the users be doing?
As the number of active users go up, the CPU and memory resources needed to handle the traffic from those users goes up. Because our sizing estimates are focused on active users, it is worth exploring what we mean by that in more detail.
Registered vs active users
When we talk about users, we generally talk about registered or licensed users and a subset of concurrent or active users. Registered users refer to the number of users who are licensed and permitted to use a system. For example, a company of 1200 employees may have 800 registered users or even fewer, given that not everyone will need to use the CLM tools. Active (or concurrent) users are the number of users logged in and actually using the system at any given time. A company of 1200 employees may have 800 registered users, but only 200 are logged in and actively working at any given time. We call these 200 users concurrent and active regardless of the intensity of how they may be working.
The number of concurrent users can often be estimated from the number of registered users. In an organization located on one continent or spanning just a few time zones, the number of concurrent users can be estimated to be between 20% and 25% of the total number of registered users. In an organization which spans the globe where registered users work in many different time zones, the number of concurrent users can be estimated to be between 10% and 15% of the total number of registered users.
The next thing to consider is how busy the active users really are. In our performance testing, we typically assume that each simulated user performs an operation once per minute on average. That may seem like a low rate, but it is an average that tries to account for the times when someone is doing other things (like taking a phone call, attending a meeting, or going to lunch). The activity of any single user is going to vary greatly, so what we try to do is to model the activity of the entire user population. If you assume that there will always be 200 active users, and each active user does something once per minute (60 operations per hour), then that works out to a load on the server of 3 operations per second. Since each operation (like creating a workitem) consists of several HTTP requests, that can be as much as 30 HTTP transactions per second sent to the server for that set of 200 active users.
Trying to model your usage realistically is perhaps the most important step you can take to sizing your servers properly. It is easy to overestimate the number of active users and how busy they are. Since you'll need more powerful hardware to support heavier load, you want to be sure that your usage estimates are not too conservative (while still allowing for bursts of activity).
Making predictions from user load
There are some simplifying assumptions that you can make to make sizing a bit easier. These are reasonable as first approximations which hold in most cases, although of course there are always exceptions.
The first assumption is that if you use the enterprise deployment topologies and place each application on its own server, then you don't need to worry about interactions between the applications. In other words, you can size your RTC server based on your RTC workload, and you can size your RQM server based on your RQM workload, and the total user load across the deployment is additive. You can have 250 active RTC users and 250 active RQM users (for a total of 500 users) as long as RTC and RQM are running on different servers. There is no significant coupling between workloads due to a shared Jazz Team Server or a shared database server. The performance bottlenecks usually form in the application servers.
A corollary is that is you are using a departmental deployment in which the applications are running on a single server, the workloads are coupled so that fewer users per application can be supported. If you could support 400 RTC users on a standalone server, you could only support 200 RTC users on a server which was hosting both RTC and RQM. In practice, a departmental topology often involves fewer total processors and less overall memory, so you need to lower your user expectations based on that as well. As a rule of thumb, keep the total number of active users for a departmental topology around 50 (and no more than 100).
The next simplifying assumption is that most operations are similar enough that you can treat them as identical. This means you can focus mostly on the number of users and how busy they are, and not worry too much about what exactly they are doing. There are some exceptions to this, which will be identified in the sizing sections.
Miscellaneous assumptions and caveats
That just about wraps up the discussion of the factors that influence performance. But before we get to the sizing estimations, there are a few last assumptions and caveats to call out:
- All hardware and operating systems are 64-bit.
- Representative product workloads (examples of how teams actually use the tools and what sort of load and transactions may occur) are described within the Rational Performance Engineering datasheets accessible here.
- For these examples, each application (Rational Team Concert, Rational Requirements Composer/Rational DOORS Next Generation, and Rational Quality Manager) is hosted on a dedicated server and connected to a separate Jazz Team Server (JTS). This document does not address how the Jazz Team Server (JTS) scales. JTS scaling information can be found here.
- Sizing estimates are provided for an approximate range of concurrent or active users. Decreasing the range of estimated concurrent users does not equate to a corresponding decrease in estimated resources. In other words, if an estimate provides a range of 300 to 500 concurrent users, it cannot be assumed that reducing by half the number of cores and RAM will meet the needs of half the amount of estimated users. In fact, we would recommend the same hardware configuration whether estimating for 150 to 250 users or 300 to 500 concurrent users.
- Similarly, increasing the range of estimated concurrent users does not equate to a corresponding increase in estimated resources. In other words, if an estimate provides a range of 300 to 500 concurrent users, it cannot be assumed that doubling the amount of cores and RAM will meet the needs of twice as much concurrent users.
- We cannot estimate the size of database repositories. The size of the database is governed by many factors: The organizations customized workload, the organizations customized datashape, and the work habits of the people in the organization. We suggest estimating a generous starting size for your database repositories, but more importantly, we suggest monitoring the growth of the repositories. Your database will grow based upon how it is used in your organization, and understanding your trends and growth patterns is the best way to anticipate database sizing needs. It is best to consider an enterprise storage solution which supports a high IOPS throughput since IO directly impacts performance. In addition mature storage solutions have the ability to size volumes as needed and optimize storage needs with real-time data deduplication.
- RAM consumption should never be more than half of the total available RAM; Maximum JVM heap size should not exceed half of the servers allocated RAM.
- You may note that the data presented here may be different from data previously presented or even data that may be presented in the future. This sizing advice does not replace or supersede any other advice. Sizing estimates are derived from actual test data and based upon assumptions and for the most accurate sizing advice for your situation you need to work with IBM to understand your unique requirements.
- This document considers single applications connected to a single JTS server.
- The raw guidance is to have less than 500 concurrent users on one server. If you have or plan to have more, consider using clustering solution.
- If you use clustered solution, although the clustered solution scales linearly, it is recommended to have less but more powerfull machines than more but with less resources assigned. The recommended number of nodes is to have one node for maximum 500 concurrent users plus one additional spare node, in case when any of nodes hangs. It means, that for example if you have 700 concurrent users, the best starting points is to have 3 nodes.
Rational Team Concert (RTC): Examples of different RTC usage patterns
Of all the Jazz products, Rational Team Concert (RTC) permits the widest variety of end-user and automated workflows. When estimating a RTC workload it is important to consider what percentage of the anticipated usage will come from work item users, SCM users and build agents or any combination of the three. Description of representative RTC workload we use in our sizing estimates can be found here.
Rational Team Concert (RTC) has three major workload types which can be used concurrently:
- Work item
- Software configuration management (SCM)
- Build agent
Our representative workloads combine these major workload types as follows:
- Work item only workload
- Combined work item and SCM workload
- Combined workitem, SCM and build agent workload
Rational Team Concert (RTC): A: Work item only workload
| Given this representative base hardware (configured as hypervisor): |
Model |
x3550 M4 |
| Processor |
Intel XEON processor E5-2670v2 |
| Processor speed |
2.5 Ghz |
| And given a virtual machine (VM) of this size: |
Logical cores |
12 vCPUs |
| RAM |
16 GB or more |
| We estimate that this workload will perform comfortably |
Approximate range of concurrent work item users: Between 400 and 600 |
There are some exceptions which lower the capacity. These include:
- Use of HTTP filtered value sets to customize workitem fields. This customization greatly increases the transaction rate to the server.
- Approximate range of concurrent work item users (with customized workitems): up to 250
- Extensive use of work item feeds (e.g. in dashboards or in the RTC Eclipse client). Feeds place extra stress on the database server.
- Approximate range of concurrent workitem users with heavier feed user: between 200 and 300
Rational Team Concert (RTC): B: Combined work item and SCM workload
| Given this representative base hardware (configured as hypervisor): |
Model |
x3550 M4 |
| Processor |
Intel XEON processor E5-2670v2 |
| Processor speed |
2.5 Ghz |
| And given a virtual machine (VM) of this size: |
Logical cores |
16 vCPUs |
| RAM |
32 GB or more |
| We estimate that this workload will perform comfortably |
Approximate range of concurrent work item users: Between 200 and 300 |
| Approximate range of concurrent SCM users: Between 100 and 200 |
The SCM workload we tested places additional demands on the RTC server, so additional memory and processors are needed in order to maintain performance. Concurrent loading of large workspaces in particular can be expensive. In our testing, we reached 100% CPU utilization on an RTC server with 4 processors, when initializing the workspaces for 100 test users (a transfer rate of nearly 3,000,000 files per hour). The response times of work item operations were temporarily degrading during the initialization period. So, we recommend that you use additional processors when combining SCM and work item operations.
Rational Team Concert (RTC): C: Combined work item, SCM and build agent workload
| Given this representative base hardware (configured as hypervisor): |
Model |
x3550 M4 |
| Processor |
Intel XEON processor E5-2670v2 |
| Processor speed |
2.5 Ghz |
| And given a virtual machine (VM) of this size: |
Logical cores |
24 vCPUs |
| RAM |
48 GB or more |
| We estimate that this workload will perform comfortably |
Approximate range of concurrent work item users: Between 200 and 300 |
| Approximate range of concurrent SCM users: Between 100 and 200 |
| Approximate range of concurrent build agents (presuming all clients, servers and build agents are at same version level): Between 100 and 200 with the use of a content caching proxy server between RTC SCM and the build servers |
Rational Doors Next Generation (RDNG)
RDNG will perform best on the Linux platform, with DB2 as the database; there are known performance issues for deployments on Windows (for virtual systems) and on Oracle. Use fast storage (like SSD drives) if you expect to have more than 500,000 artifacts. Repository size and user load are the main factors that impact RNDG performance.
Note that artifacts should be spread out across multiple project areas, with no more than 200,000 artifacts per project area.
RDNG Sizing guidance for release 6.0.2 and later
RDNG 6.0.2 improved performance by adopting memory-mapped I/O for accessing index data on the DNG server. The maximum user load therefore increased in 6.0.2. However, memory-mapped I/O did not reliably improve performance on virtualized Windows platforms - if you are sizing a Windows 6.0.2 virtual server, please use the 6.0.1 sizing guidance.
Use the following chart as a rough guide to RDNG server sizing for Linux/DB2 deployments.
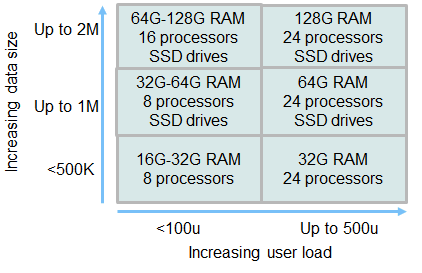 As a general rule, you should expect that a single DNG server can handle up to 500 concurrent users. Our ongoing scalability tests use up to 1 million artifacts, but we project that 2 million artifacts is the practical limit. To support 500 users and 2 million artifacts, you will need to deploy a large server (24 logical procesors, 128G or more of RAM as well as a fast disk system like an SSD). Also keep in mind that each project area should have no more than 200,000 artifacts.
If you have fewer artifacts, you can reduce the hardware requirements. Smaller repositories will need less memory. Smaller user loads will need fewer processors. However, our minimum recommendation would be a system no smaller than 16G or RAM and 8 logical processors - but that configuration should not go past 100 concurrent users and 500,000 total artifacts.
As the number of artifacts grows beyond 500,000, you will need to add more RAM and use SSD drives. If you want to minimize the risk of performance problems with RDNG, use SSD drives from the start. As the number of artifacts grows past 1 million, consider adding an additional RDNG server and use that for new projects.
The 6.0.3 release introduced components, which allow for data to be partitioned within a project area. However, components have limited impact on scalability. You are still limited to 200,000 artifacts per project area.
As a general rule, you should expect that a single DNG server can handle up to 500 concurrent users. Our ongoing scalability tests use up to 1 million artifacts, but we project that 2 million artifacts is the practical limit. To support 500 users and 2 million artifacts, you will need to deploy a large server (24 logical procesors, 128G or more of RAM as well as a fast disk system like an SSD). Also keep in mind that each project area should have no more than 200,000 artifacts.
If you have fewer artifacts, you can reduce the hardware requirements. Smaller repositories will need less memory. Smaller user loads will need fewer processors. However, our minimum recommendation would be a system no smaller than 16G or RAM and 8 logical processors - but that configuration should not go past 100 concurrent users and 500,000 total artifacts.
As the number of artifacts grows beyond 500,000, you will need to add more RAM and use SSD drives. If you want to minimize the risk of performance problems with RDNG, use SSD drives from the start. As the number of artifacts grows past 1 million, consider adding an additional RDNG server and use that for new projects.
The 6.0.3 release introduced components, which allow for data to be partitioned within a project area. However, components have limited impact on scalability. You are still limited to 200,000 artifacts per project area.
RDNG Sizing guidance for release 6.0.1 and earlier
Use the following chart as a rough guide to RDNG server sizing for 6.0.1 Linux/DB2 deployments:
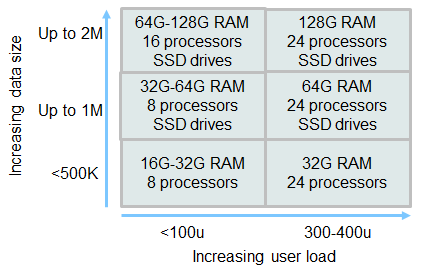 As a general rule, you should expect that a single DNG server can handle up to 400 concurrent users. Our ongoing scalability tests use up to 1 million artifacts, but we project that 2 million artifacts is the practical limit. To support 300-400 users and 2 million artifacts, you will need to deploy a large server (24 logical procesors, 128G or more of RAM as well as a fast disk system like an SSD). If you have fewer artifacts, you can reduce the hardware requirements. Smaller repositories will need less memory. Smaller user loads will need fewer processors. However, our minimum recommendation would be a system no smaller than 16G or RAM and 8 logical processors - but that configuration should not go past 100 concurrent users and 500,000 total artifacts..
As the number of artifacts grows beyond 500,000, you will need to add more RAM and use SSD drives.
As a general rule, you should expect that a single DNG server can handle up to 400 concurrent users. Our ongoing scalability tests use up to 1 million artifacts, but we project that 2 million artifacts is the practical limit. To support 300-400 users and 2 million artifacts, you will need to deploy a large server (24 logical procesors, 128G or more of RAM as well as a fast disk system like an SSD). If you have fewer artifacts, you can reduce the hardware requirements. Smaller repositories will need less memory. Smaller user loads will need fewer processors. However, our minimum recommendation would be a system no smaller than 16G or RAM and 8 logical processors - but that configuration should not go past 100 concurrent users and 500,000 total artifacts..
As the number of artifacts grows beyond 500,000, you will need to add more RAM and use SSD drives.
Reference material - RDNG sizing
Description of representative RRC workload we use in our sizing estimates can be found here.
More information sizing and tuning can be found here:
Rational Quality Manager (RQM)
Description of representative RQM workload we use in our sizing estimates can be found here.
| Given this representative base hardware (configured as hypervisor): |
Model |
x3550 M4 |
| Processor |
Intel XEON processor E5-2670v2 |
| Processor speed |
2.5 Ghz |
| And given a virtual machine (VM) of this size: |
Logical cores |
8 vCPUs |
| RAM |
16 GB or more |
| We estimate that this workload will perform comfortably |
Approximate range of concurrent RQM users: Between 350 and 500 |
Appendix A: Additional factors that influence performance
The material below appeared in the original CLM Sizing strategy document. I have kept in here for reference, but we have not quantified the impact of most of these factors through testing, so it is difficult to act on this information.
The performance and behavior of a CLM or SSE deployment can be influenced by many factors or dimensions. These dimensions fall into two categories: application and product related (functional dimensions) and environment or topology related (non-functional dimensions). CLM and SSEs flexibility and performance can be undermined by unintentional functional and non-functional design choices.
It is easy to design an ideal topology which presumes zero-second latency, unlimited bandwidth and ever-increasing storage capacity, but such capabilities are impossible in real deployments where there are known and possibly unexpected constraints and limits. It is important to be mindful of the gamut of possible constraints for the various dimensions of a CLM and SSE environment.
This table collects some of the factors which may degrade performance. This table is by no means comprehensive. There may be other factors not listed here. A factor listed here may have different effect in different environments.
| Dimension |
Factors unique to every customer deployment which may influence performance |
| Product specific |
- Customized templates and workflows (and use of HTTP filtered value sets)
- Number of work items in a plan (e.g.: more than 3000)
- Number of members in a project area
- Number and type of widgets on a dashboard (e.g.: more than a dozen plan widgets; widgets which load charts)
- Number of tabs on a dashboard (e.g.: dashboards with many widgets that show graphs and BIRT reports)
- Complex plan views (e.g.: plans which also show Gantt charts)
- Frequent feed requests
- Complex queries requested against many requirements
- Clients, servers and build agents at different version levels (e.g.: clients at version 3.x and servers at 4.x)
|
| Network |
- Latency is greater than 200 ms more than 10% of the time
- Bandwidth less than 1 Gbit
- Packet loss greater than 2%
- Datacenter not co-located with application servers
|
| Storage |
- Local storage
- Slow I/O to disc
- SAN or NAS not connected by fibre channel (or any faster protocol)
- Datacenter not co-located with application servers
|
| Browser clients |
- Browser not updated
- Browser not running most current version of java
- Browser not HTML 5 compatible
|
| Desktop clients |
- Eclipse shell integrated with multiple dependencies
|
| Build agents |
- Uncontrolled and unmonitored use of build agents
|
| Application server |
- If virtualized, resources (CPU, RAM, network) are not properly reserved or dedicated; entitlement is not guaranteed; shared pool does not have enough resources
- Undersized CPU
- Undersized RAM
- OS not up to date
- Not co-located with database
|
| Database server |
- If virtualized, resources (CPU, RAM, network) are not properly reserved or dedicated; entitlement is not guaranteed; shared pool does not have enough resources
- Undersized CPU
- Undersized RAM
- OS not up to date
- Not co-located with application server
- Not properly indexed
- Backups occur during peak usage times
|
| License server |
- Not co-located with JTS server
- Latency between license server and JTS server is more than 50ms
|
| Authentication server |
- Does not meet an industry standard
|
| Load balancer |
- No front-ending load balancer (neither software nor hardware)
- Not using a reverse proxy
|
| Business continuity |
- No high availability or disaster recovery policy
- High availability or disaster recovery policy not practiced
|
| Users |
- More users than anticipated
- Users work differently than anticipated
- User population has different roles than anticipated
- Users work with datashapes (documents, files, code) which are larger in size than anticipated
- User population is not geographically distributed (e.g.: all users commonly use the environment at set schedules, or are expected to login near coincidentally at the start of a workday)
|
| Organizational Maturity |
- More mature teams (greater degree of Agile experience or even a highly developed waterfall process) tend to use a system more intensively
|
Appendix B: What is a sizing estimate for anyway? What are the next steps?
A sizing estimate attempts to forecast the number of users which a prescribed hardware configuration may comfortably support with a maximum response time at a defined interaction rate and a typical datashape. A sizing document is often created before a product is deployed in order to estimate the anticipated hardware needs for a deployment. Sometimes the sizing documents most immediate goal is to specify hardware for allocation or procurement. Very often the sizing document specifies a maximum or largest anticipated target number of users simply so that the corresponding hardware allocation will not be exceeded and the anticipated hardware is requested only once.
Every CLM sizing document is an estimate: The CLM products are flexible and can be deployed to meet customers needs; customer hardware and deployment environments are unique for each customer; customer workload and habits will be unique and can be expected to vary across the products deployment lifetime.
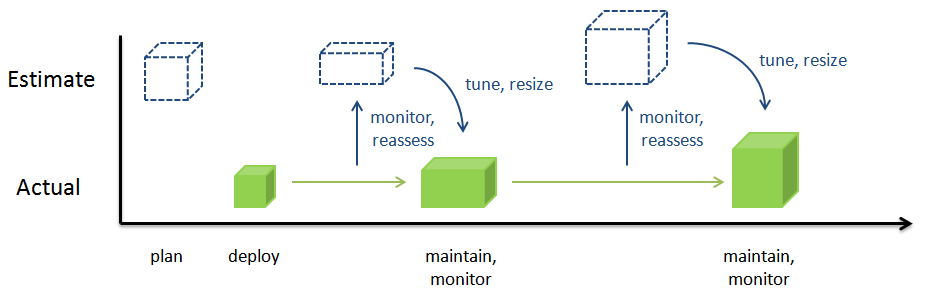 A sizing estimate represents the best-guess assessment at a given point in time. As an environment is uses and grows, it is natural that assumptions made to support the sizing estimate may change. After deploying the environment we strongly recommend monitoring the environment and re-evaluating the assumptions and conclusions made during the planning phase as part of a deployments maintenance strategy. It is typical that an environment will grow and mature differently than the sizing estimate may anticipate. A standard maintenance and monitoring plan should include revisiting the sizing estimate and appropriately adjusting and tuning your deployment at key milestones, if not at a yearly minimum.
References
Change history
- 1/5/18 - Updated sizing guidance for DOORS Next generation (Vaughn Rokosz)
Questions and comments:
- What other sizing guidance would you like to see here?
- Are there situations and topologies which are not covered?
Warning: Can't find topic Deployment.CLMSizingStrategyComments

