Performance impact of sharing a Jazz Team Server
Authors: JosephStellrecht, VaughnRokosz Last updated: July 24, 2013 Build basis: Rational Team Concert 4.0.3, Rational Quality Manager 4.0.3, Rational Requirements Server 4.0.3- Introduction
- Summary of Results
- Disclaimer
- Server Topology
- Hardware Description
- Test Methodology - Maximum Throughput Measurement
- Overview of Simulated Workloads
- Data Volume
- Test Results - Details
- CCM1 Run Comparison
- CCM2 Run Comparison
- QM1 Run Comparison
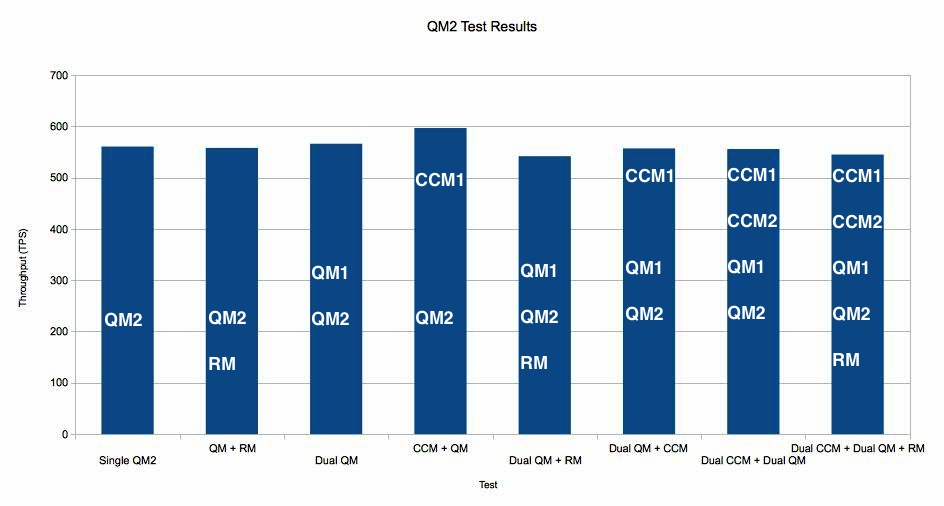
- QM2 Run Comparison
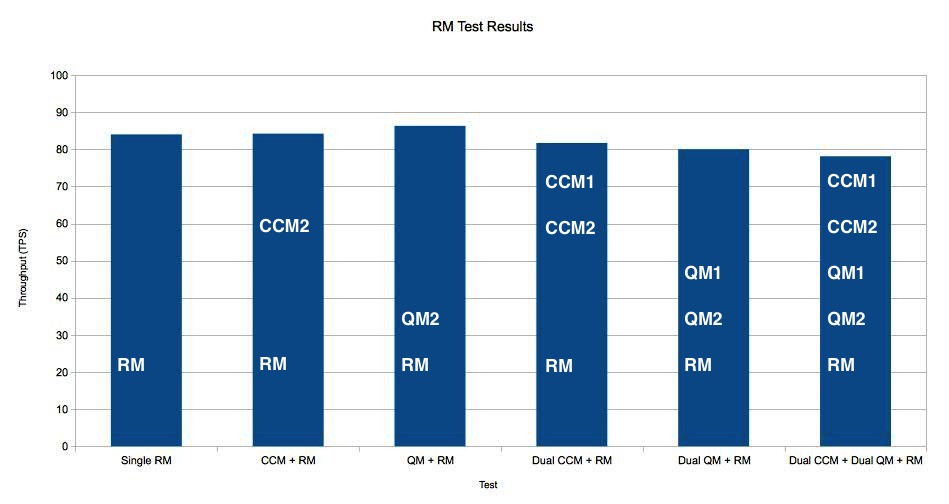
- RM Run Comparison
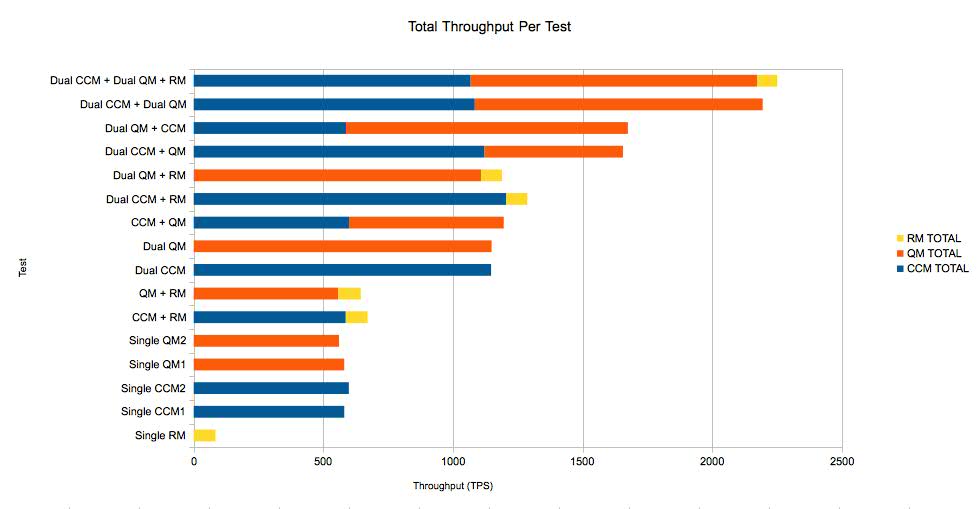
- Total Test Comparison
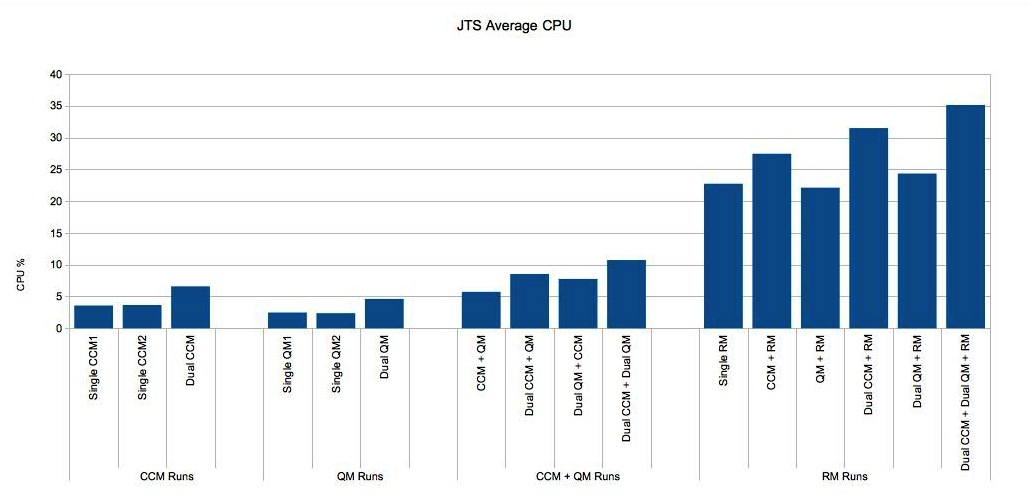
- JTS Server CPU Utilization Across All Tests
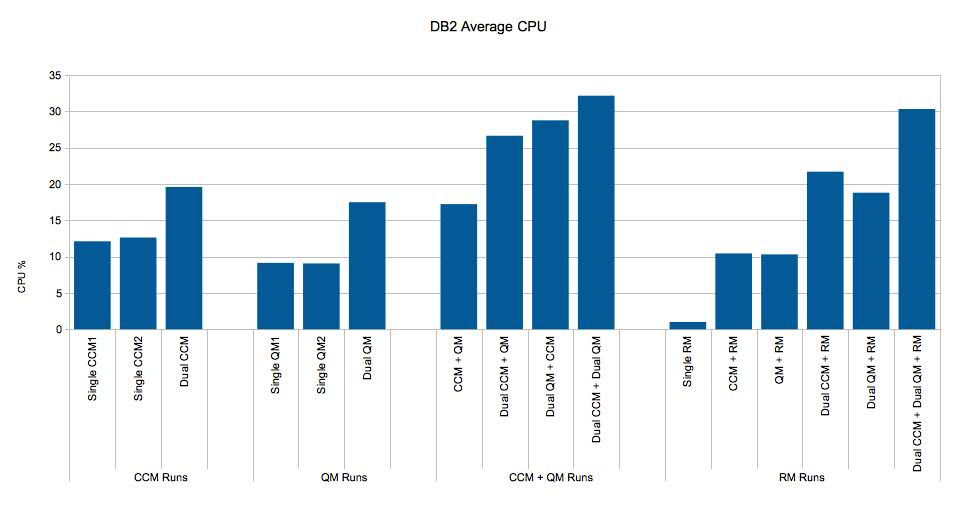
- DB2 Server CPU Utilization Across All Tests
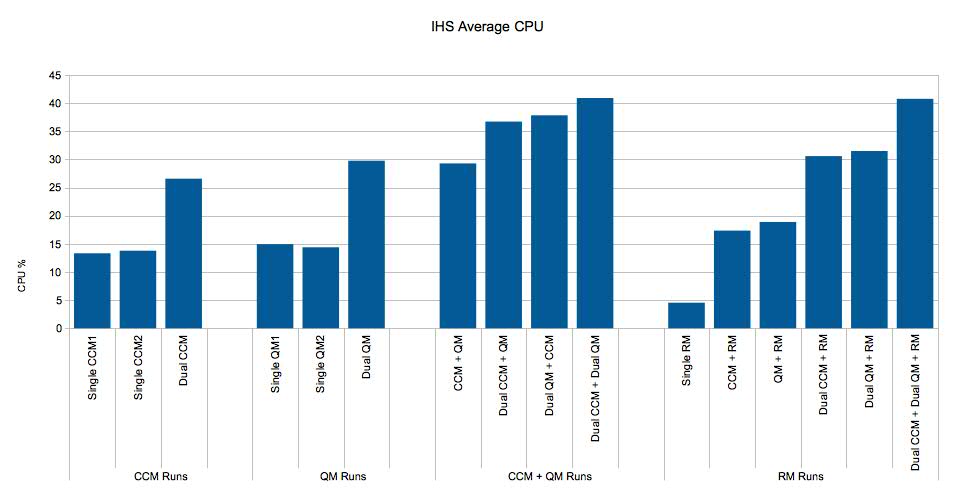
- IHS Server CPU Utilization Across All Tests
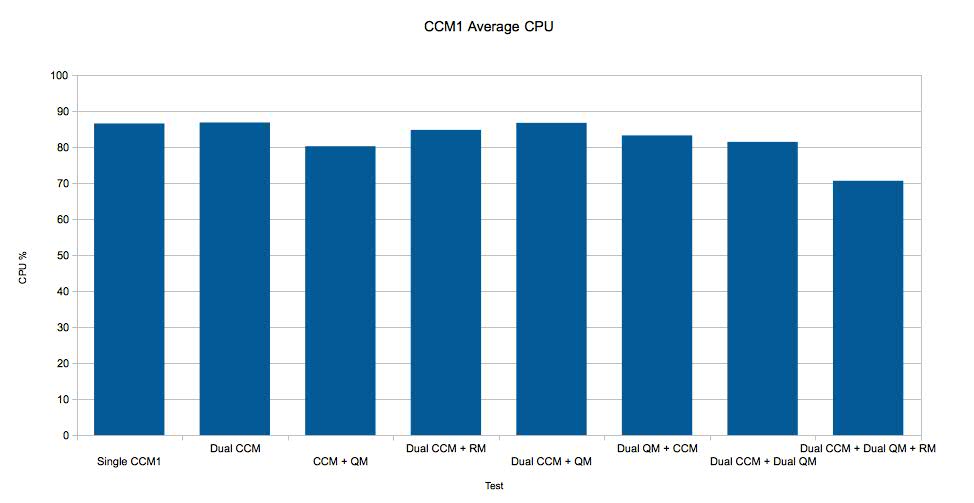
- CCM1 Server CPU Utilization Across All Tests
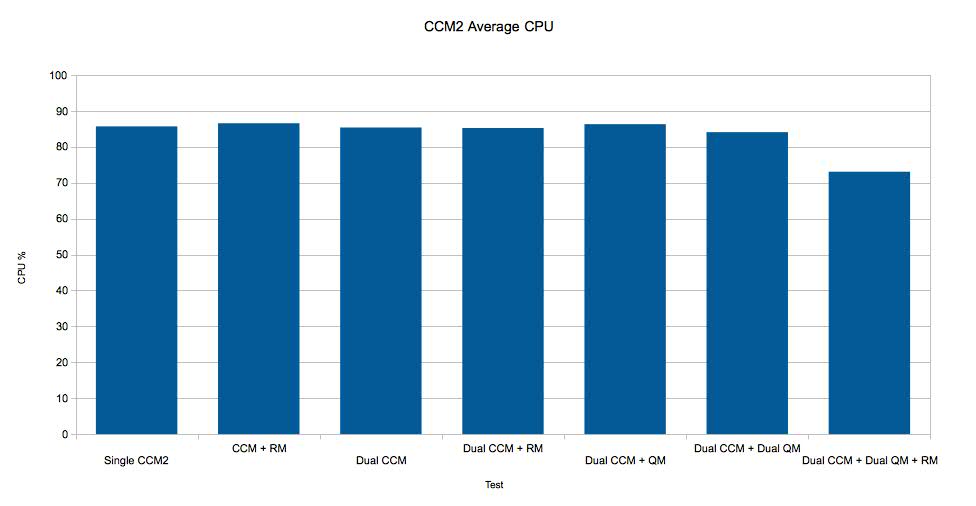
- CCM2 Server CPU Utilization Across All Tests
- QM1 Server CPU Utilization Across All Tests
- QM2 Server CPU Utilization Across All Tests
- RM Server CPU Utilization Across All Tests
- Key Tuning Parameters
- Related Information
Introduction
This report looks at the performance impact of sharing an instance of the Jazz Team Server (JTS) among instances of Rational Team Concert (RTC), Rational Quality Manager (RQM) and Rational Requirements Composer (RRC).Summary of Results
Overall, for this set of machines and these workloads, the JTS never became a bottleneck. There was only a small amount of degradation in maximum throughputs (5-10%) even when all 5 CLM servers were at maximum load. The CPU utilization was around 35% for the dual RTC/dual RQM/RRC workload - but most of the JTS utilization comes from the RRC application. An RRC-only workload consumes roughly 23% of the JTS CPU, while RTC and RQM workloads are under 5%. In summary, the RRC, RQM, and RTC workloads did not interfere with each other, and so an integrated system which shares a single JTS between RQM, RTC, and RRC servers should behave much like a single-product system (e.g. RQM only).Disclaimer
The information in this document is distributed AS IS. The use of this information or the implementation of any of these techniques is a customer responsibility and depends on the customers ability to evaluate and integrate them into the customers operational environment. While each item may have been reviewed by IBM for accuracy in a specific situation, there is no guarantee that the same or similar results will be obtained elsewhere. Customers attempting to adapt these techniques to their own environments do so at their own risk. Any pointers in this publication to external Web sites are provided for convenience only and do not in any manner serve as an endorsement of these Web sites. Any performance data contained in this document was determined in a controlled environment, and therefore, the results that may be obtained in other operating environments may vary significantly. Users of this document should verify the applicable data for their specific environment.Server Topology
The topology used for this testing was based on the standard enterprise topology E1. The E1 topology uses the
WebSphere Application Server and DB2, and installs all of the
CLM applications onto separate servers. We
extended this topology by adding a second RQM server and a
second RTC server, creating a topology where up to 5 CLM servers
are interacting with a single JTS server. We
only used a single RRC server because multiple RRC servers are
not supported by the 4.0.3 release.
This deployment used floating licenses provided by the JTS
server. A single IBM HTTP server was used as a
reverse proxy.
Here are the specific versions of software we used:
| Software |
Version |
|---|---|
| CLM applications |
4.0.3 M2 |
| IBM HTTP Server |
8.0.0.3 (Apache 2.2.15) |
| IBM DB2 Enterprise Server Edition |
9.7.0.6 |
| IBM WebSphere Application Server |
8.0.0.3 |

Hardware Description
This table lists the servers that were used for our testing:
| Role |
Manufacturer / Model |
CPU |
Number of CPU/Cores |
CPU Speed |
Memory |
OS |
|---|---|---|---|---|---|---|
| IBM HTTP Server |
IBM x3250 M4 |
Intel Xeon E3-1240 v2 |
1 / 4 |
3.4 GHz |
16 GB | RedHat Enterprise Linux Server 64-bit
v6.3 |
| CLM - JTS Server |
IBM x3550 M4 |
Intel Xeon E5-2640 |
2 / 12 |
2.5 GHz | 32 GB | RedHat Enterprise Linux Server 64-bit v6.3 |
| CLM - RTC Server #1 |
IBM x3550 M4 | Intel Xeon E5-2640 | 2 / 12 |
2.5 GHz | 32 GB | RedHat Enterprise Linux Server 64-bit v6.3 |
| CLM - RTC Server #2 |
IBM x3550 M4 | Intel Xeon E5-2640 | 2 / 12 | 2.5 GHz | 32 GB | RedHat Enterprise Linux Server 64-bit v6.3 |
| CLM - RQM Server #1 |
IBM x3550 M4 | Intel Xeon E5-2640 | 2 / 12 |
2.5 GHz | 32 GB | RedHat Enterprise Linux Server 64-bit v6.3 |
| CLM - RQM Server #2 | IBM x3550 M4 | Intel Xeon E5-2640 | 2 / 12 | 2.5 GHz | 32 GB | RedHat Enterprise Linux Server 64-bit v6.3 |
| CLM - RRS Server |
IBM x3550 M4 | Intel Xeon E5-2640 | 2 / 12 |
2.5 GHz | 32 GB | RedHat Enterprise Linux Server 64-bit v6.3 |
| CLM - DB2 Server |
IBM x3650 M4 | Intel Xeon E5-2640 | 2 / 12 |
2.5 GHz | 64 GB |
RedHat Enterprise Linux Server 64-bit v6.3 |
Test Methodology - Maximum Throughput Measurement
 The tests described
in this report determine the maximum throughput (in requests per
second) that can be handled by a given topology. The tests
are carried out by applying a simulated workload against the
target system. The simulation uses multiple threads of
execution which are sending transactions to the server as fast as
possible. The number of threads starts out small, and then
is slowly increased while we monitor the total number of
transactions per second processed by the system. When the
transactions per second stops increasing (or drops), the system is
at its limit.
The tests described
in this report determine the maximum throughput (in requests per
second) that can be handled by a given topology. The tests
are carried out by applying a simulated workload against the
target system. The simulation uses multiple threads of
execution which are sending transactions to the server as fast as
possible. The number of threads starts out small, and then
is slowly increased while we monitor the total number of
transactions per second processed by the system. When the
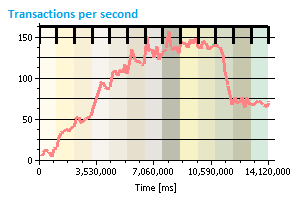
transactions per second stops increasing (or drops), the system is
at its limit.The chart at the right is an example of the output from a typical test. Initially, the throughput increases as the number of threads increases. Midway through the test, the throughput flattens out and this is the range from which the maximum throughput is calculated. Past this point, the system is overloaded and the system cannot process the requests of additional threads.
We used this technique to measure the maximum throughput for each of the application nodes in the test system, both singly and in combination, while also monitoring CPU utilization on the JTS server. For example, we first ran a test that applied load to a single RTC server. Then, we ran another test that applied load to 2 RTC servers at the same time. We continued looking at server combinations up to the point where we were applying load against all servers at once (both RQM servers, both RTC servers, and the RM server). We were looking for signs that the JTS was becoming overloaded, such as high CPU utilization or a drop in maximum throughput at one or more nodes.
Please note that the throughput results do not have a precise relationship to the number of users that can be supported by a configuration. The throughput numbers represent an absolute maximum that the system can sustain when stressed by a simulation that uses a small number of parallel threads running as fast as possible. In production systems, the traffic generated by each real user is much lower than the traffic generated by a simulated thread, because real users pause between operations. In theory, you should be able to increase the number of real users until you reach the maximum throughput (e.g. if each real user generated 2 transactions per second on average, and your maximum transaction rate is 150 - then you have an upper limit of 75 users). In practice, however, the actual user load will be lower than the upper limit. Response times, for example, may degrade before the maximum throughput is reached, which then lowers the effective number of supported users. Understanding how user capacity is related to maximum throughput is outside the scope of this article.
Overview of Simulated Workloads
Three different workloads were used to look at the maximum throughput of the individual CLM applications. These workloads are listed below:- Rational Team Concert: login, select a predefined query, edit a workitem, create a new workitem
- Rational Quality Manager: login, browse test execution records, browse test plans and test cases, edit a test plan, edit a test script, create a new test plan
- Rational Requirements Composer: login, browse the project folder, scroll a module page, switch views, navigate different module pages, open a collection, add comments to a module, edit an artifact of a module
Data Volume
The data repository has an initial population of 100K RTC
workitems, 100K RQM data, and 200K RRC requirement data.
There were 5 projects in each RTC server, 5 projects in each RQM
server and 10 projects in the RM server.
In each RTC project, there are 10K workitems and 20 plans
per project.
For each RQM project, there are 250 Test Plans, 1250 Test Cases,
1284 Test Scripts, 375 Test Suites, 2500 Test Case Execution
Records, 375 Test Suite Execution Records, 5000 Test Case
Results, and 750 Test Suite Results.
In RRC, we used medium sized project areas for this test, and
they consist of 22 modules with 20K artifacts across the
modules., 1K traditional artifacts, 3 collections, and 15K
comments.
Test Results - Details
The maximum throughputs (in transactions per second) are listed in the following table. The rows in the table below are separate test runs; the columns are the maximum throughput numbers measured at the different servers that were part of the test:- CCM1: RTC server #1
- CCM2: RTC server #2
- QM1: RQM server #1
- QM2: RQM server #2
- RM: RRC server
| Test | CCM1 | CCM2 | QM1 | QM2 | RM | TOTALS | CCM TOTAL | QM TOTAL | RM TOTAL |
|---|---|---|---|---|---|---|---|---|---|
| Single RM | -- | -- | -- | -- | 84 | 84 | -- | -- | 84 |
| Single CCM1 |
581 | -- | -- | -- | -- | 581 | 581 | -- | -- |
| Single CCM2 | -- | 598 | -- | -- | -- | 598 | 598 | -- | -- |
| Single QM1 | -- | -- | 581 | -- | -- | 581 | -- | 581 | -- |
| Single QM2 | -- | -- | -- | 561 | -- | 561 | -- | 561 | -- |
| CCM + RM | -- | 586 | -- | -- | 84 | 671 | 586 | -- | 84 |
| QM + RM | -- | -- | -- | 558 | 86 | 644 | -- | 558 | 86 |
| Dual CCM | 571 | 577 | -- | -- | -- | 1147 | 1147 | -- | -- |
| Dual QM | -- | -- | 583 | 566 | -- | 1149 | -- | 1149 | -- |
| CCM + QM | 599 | -- | -- | 597 | -- | 1196 | 599 | 597 | -- |
| Dual CCM + RM | 603 | 602 | -- | -- | 82 | 1287 | 1205 | -- | 82 |
| Dual QM + RM | -- | -- | 568 | 542 | 80 | 1189 | -- | 1109 | 80 |
| Dual CCM + QM | 551 | 571 | 534 | -- | -- | 1656 | 1122 | 534 | -- |
| Dual QM + CCM | 587 | -- | 530 | 557 | -- | 1675 | 587 | 1087 | -- |
| Dual CCM + Dual QM | 556 | 528 | 555 | 556 | -- | 2195 | 1084 | 1111 | -- |
| Dual CCM + Dual QM + RM | 532 | 536 | 560 | 545 | 78 | 2250 | 1068 | 1104 | 78 |
CCM1 Run Comparison
The chart below shows the maximum throughput observed through RTC server #1, for a variety of workloads. The estimated error for these measurements is +/- 20 transactions per second. The transaction rate for RTC server #1 is largely independent of the load on the other servers. There is only slight fall-off in throughput for the most complete workload (involving both RQM servers, both RTC servers, and the RRC server).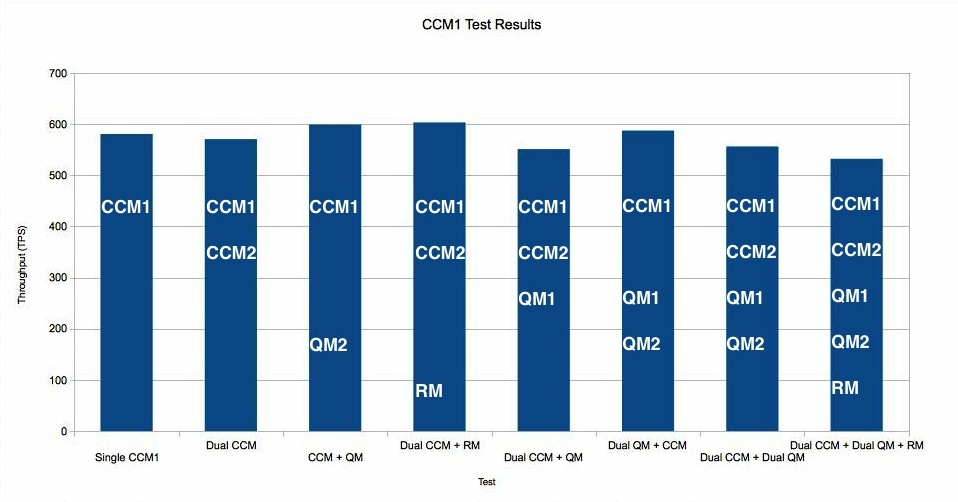
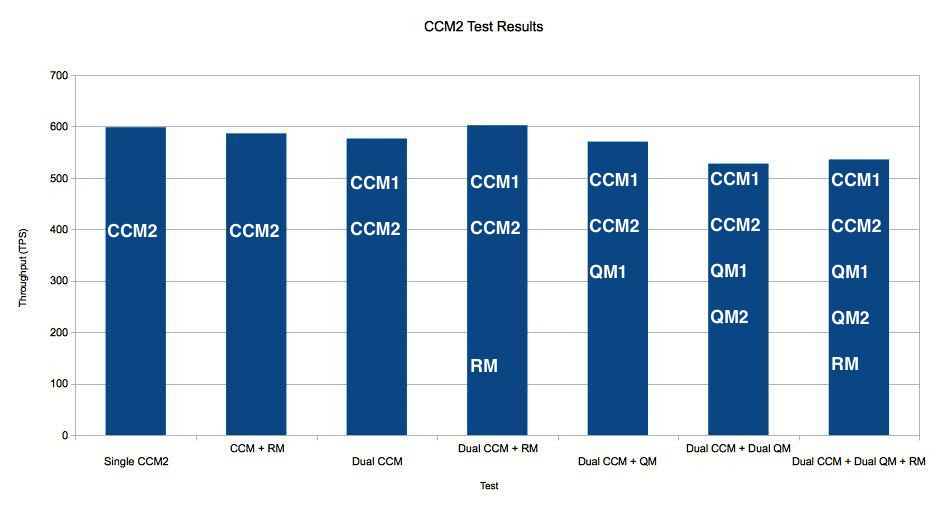
CCM2 Run Comparison
The chart below shows the maximum throughput observed through RTC server #2, for a variety of workloads. The estimated error for these measurements is +/- 20 transactions per second. The transaction rate for RTC server #2 is largely independent of the load on the other servers. There is only slight fall-off in throughput for the most complete workloads (involving both RQM servers, both RTC servers, and the RRC server).
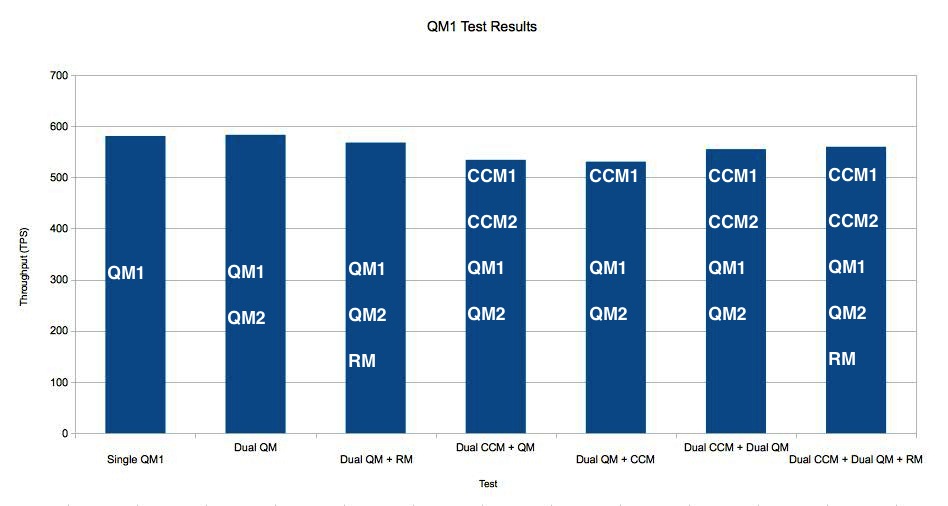
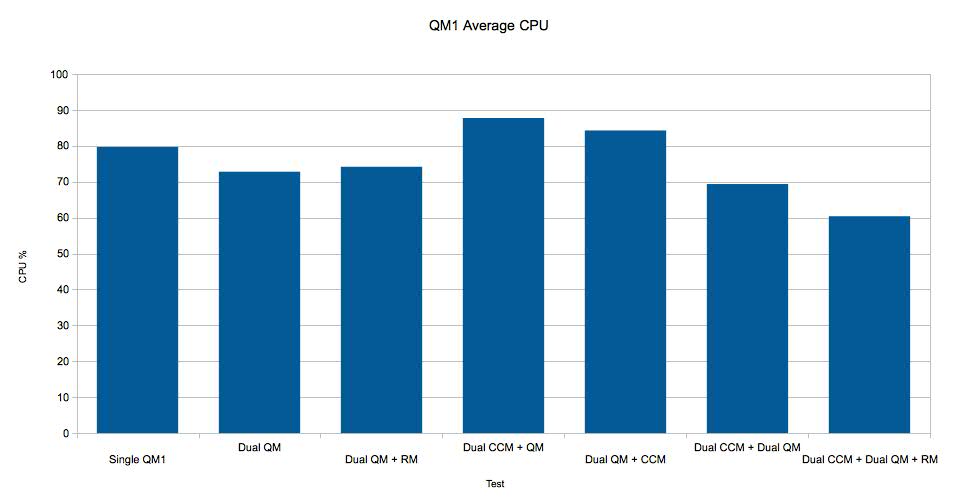
QM1 Run Comparison
The chart below shows the maximum throughput observed
through RQM server #1, for a variety of workloads. The
estimated error for these measurements is +/- 20 transactions
per second. The transaction rate for RQM server #1 is
largely independent of the load on the other servers.
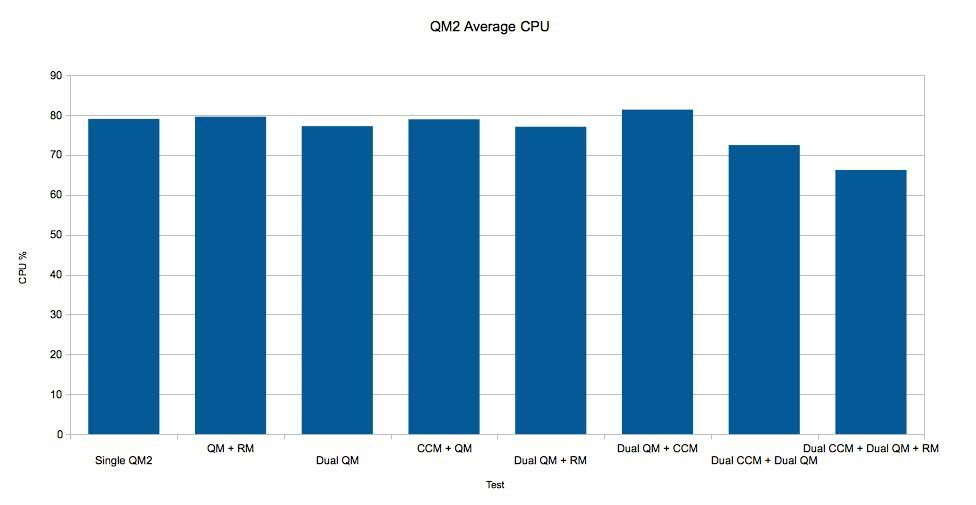
QM2 Run Comparison
The chart below shows the maximum throughput observed through RQM server #2, for a variety of workloads. The estimated error for these measurements is +/- 20 transactions per second. The transaction rate for RQM server #2 is largely independent of the load on the other servers.
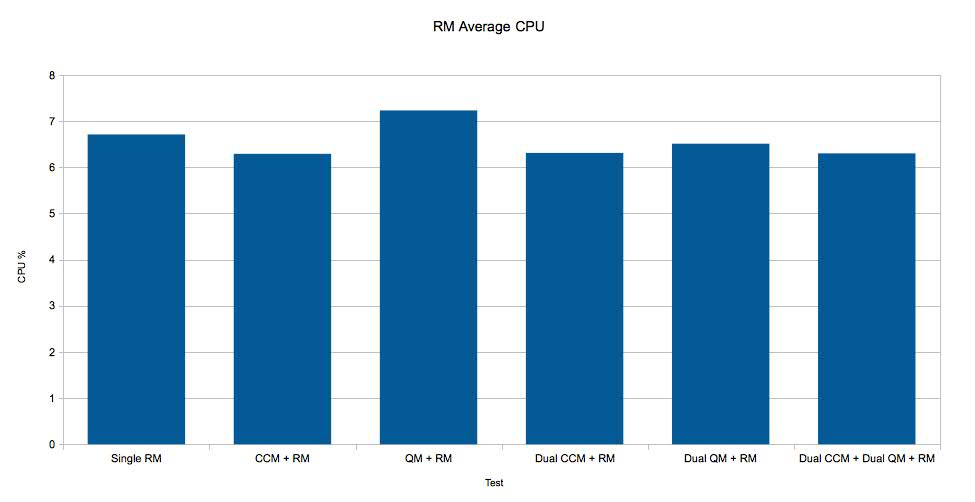
RM Run Comparison
The chart below shows the maximum throughput observed through the RM server, for a variety of workloads. The estimated error for these measurements is +/- 5 transactions per second. The transaction rate for the RM server is largely independent of the load on the other servers.
Total Test Comparison
JTS Server CPU Utilization Across All Tests
DB2 Server CPU Utilization Across All Tests
IHS Server CPU Utilization Across All Tests
CCM1 Server CPU Utilization Across All Tests
CCM2 Server CPU Utilization Across All Tests
QM1 Server CPU Utilization Across All Tests
QM2 Server CPU Utilization Across All Tests
RM Server CPU Utilization Across All Tests
Key Tuning Parameters
WebSphere Application Servers
WebContainer set to Min 300 Max 300JVM max heap set to 8 GB
JVM arguments set to:
-Xdump:none
-Xdump:heap+java:events=systhrow+user,filter=java/lang/OutOfMemoryError,request=exclusive+prepwalk
-Xgcpolicy:gencon -Xmx8g -Xms8g -Xmn1g -Xcompressedrefs
-Xgc:preferredHeapBase=0x100000000 -Xverbosegclog:gc.log
-Xdump:heap:file=/home/wasdumps/heapdump.%Y%m%d.%H%M%S.%pid.%seq.txt
-Xdump:java:file=/home/wasdumps/javacore.%Y%m%d.%H%M%S.%pid.%seq.txt
IBM HTTP Server
In httpd.conf:
<IfModule worker.c>
      ThreadLimit           25
      ServerLimit           100
      StartServers          2
      MaxClients            2500
      MinSpareThreads       25
      MaxSpareThreads       500
      ThreadsPerChild       25
      MaxRequestsPerChild   0
</IfModule>
Related Information
Contributions are governed by our Terms of Use. Please read the following disclaimer.
Dashboards and work items are no longer publicly available, so some links may be invalid. We now provide similar information through other means. Learn more here.