Introduction
This report compares the performance of an unclustered Rational
Quality Manager version 4.0.6 deployment to the previous 4.0.5
release. The test objective is achieved in three steps:
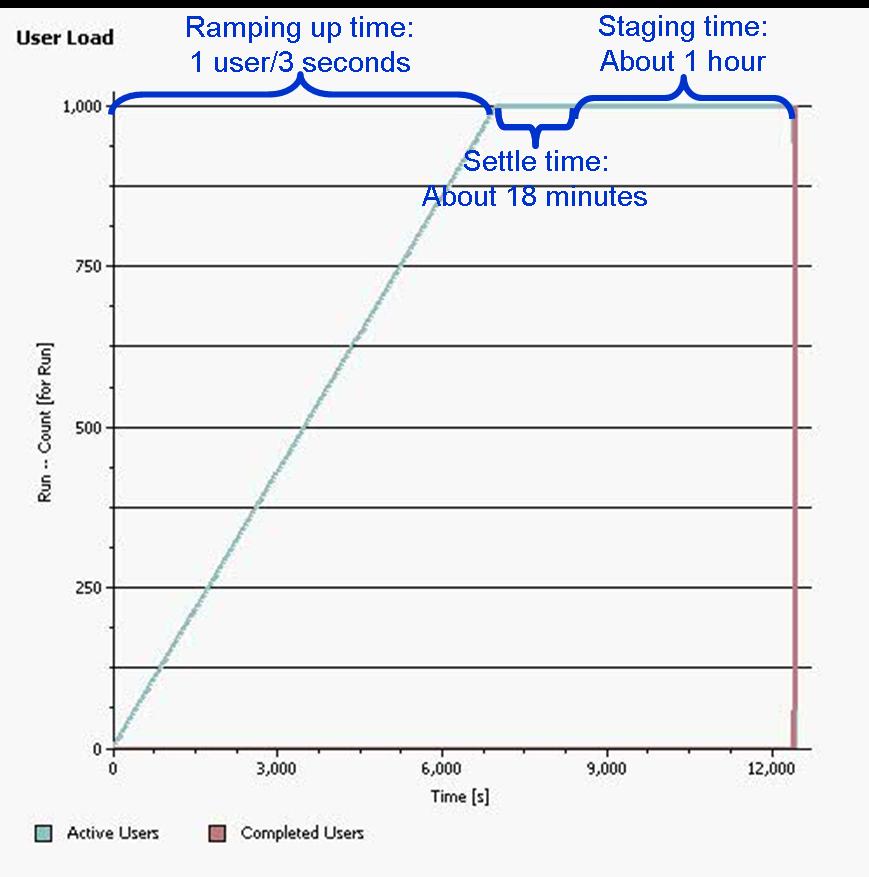
- Run version 4.0.5 with standard 1-hour test using 1,000 concurrent users.
- Run version 4.0.6 with standard 1-hour test using 1,000 concurrent users.
- The test is run three time for each version and the resulting six tests are compared with each other. Three tests per version is used to get a more accurate picture since there are variations expected between runs.
Disclaimer
The information in this document is distributed AS IS. The use of this information or the implementation of any of these techniques is a customer responsibility and depends on the customers ability to evaluate and integrate them into the customers operational environment. While each item may have been reviewed by IBM for accuracy in a specific situation, there is no guarantee that the same or similar results will be obtained elsewhere. Customers attempting to adapt these techniques to their own environments do so at their own risk. Any pointers in this publication to external Web sites are provided for convenience only and do not in any manner serve as an endorsement of these Web sites. Any performance data contained in this document was determined in a controlled environment, and therefore, the results that may be obtained in other operating environments may vary significantly. Users of this document should verify the applicable data for their specific environment.
Performance is based on measurements and projections using standard IBM benchmarks in a controlled environment. The actual throughput or performance that any user will experience will vary depending upon many factors, including considerations such as the amount of multi-programming in the users job stream, the I/O configuration, the storage configuration, and the workload processed. Therefore, no assurance can be given that an individual user will achieve results similar to those stated here.
This testing was done as a way to compare and characterize the differences in performance between different versions of the product. The results shown here should thus be looked at as a comparison of the contrasting performance between different versions, and not as an absolute benchmark of performance.
What our tests measure
We use predominantly automated tooling such as Rational Performance Tester (RPT) to simulate a workload normally generated by client software such as the Eclipse client or web browsers. All response times listed are those measured by our automated tooling and not a client.
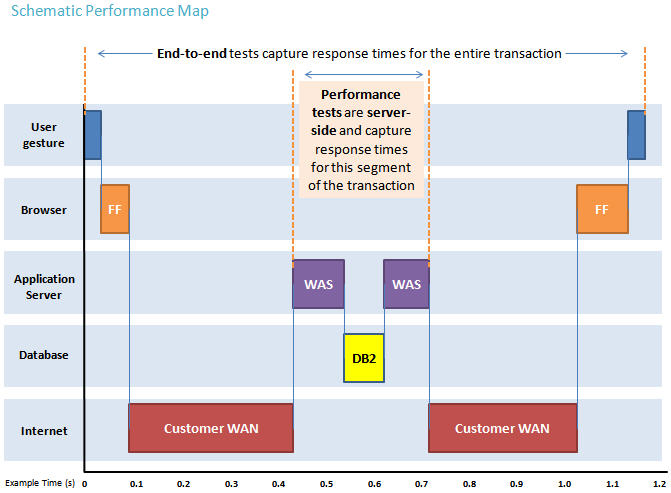
The diagram below describes at a very high level which aspects of the entire end-to-end experience (human end-user to server and back again) that our performance tests simulate. The tests described in this article simulate a segment of the end-to-end transaction as indicated in the middle of the diagram. Performance tests are server-side and capture response times for this segment of the transaction.
Findings
Performance goals
- Verify that there are no performance regressions between current release and prior release with 1,000 concurrent users using the workload described below.
Findings
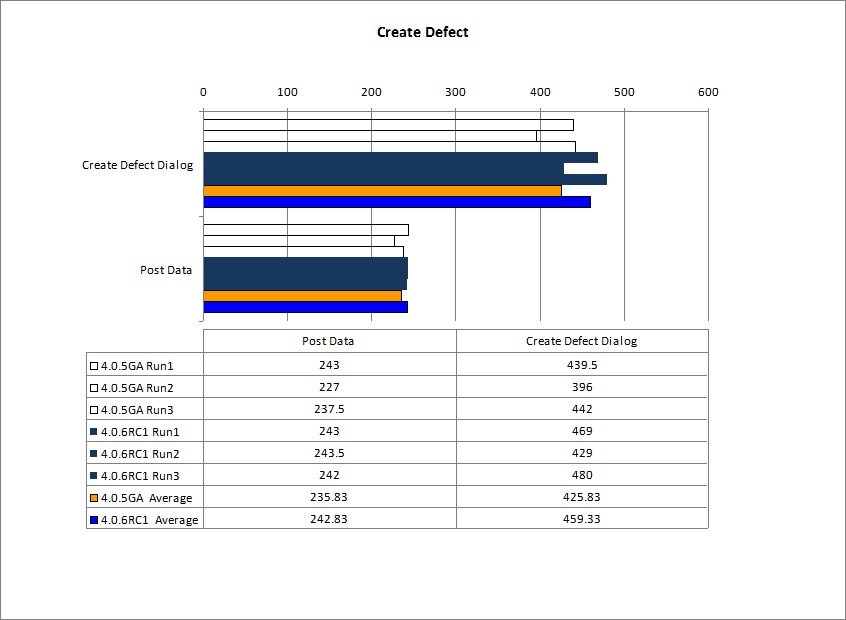
- According to the testing results, the response times of the pages for 4.0.6 are roughly equivalent to 4.0.5 .
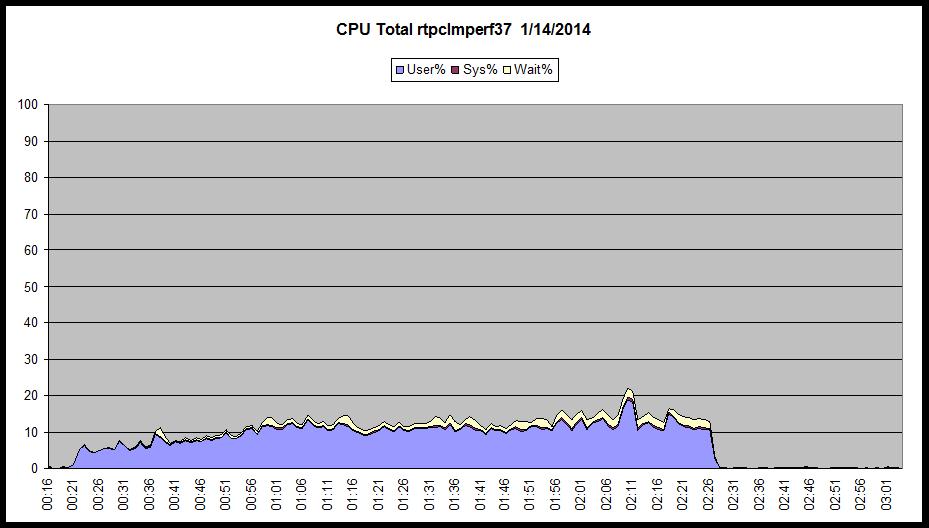
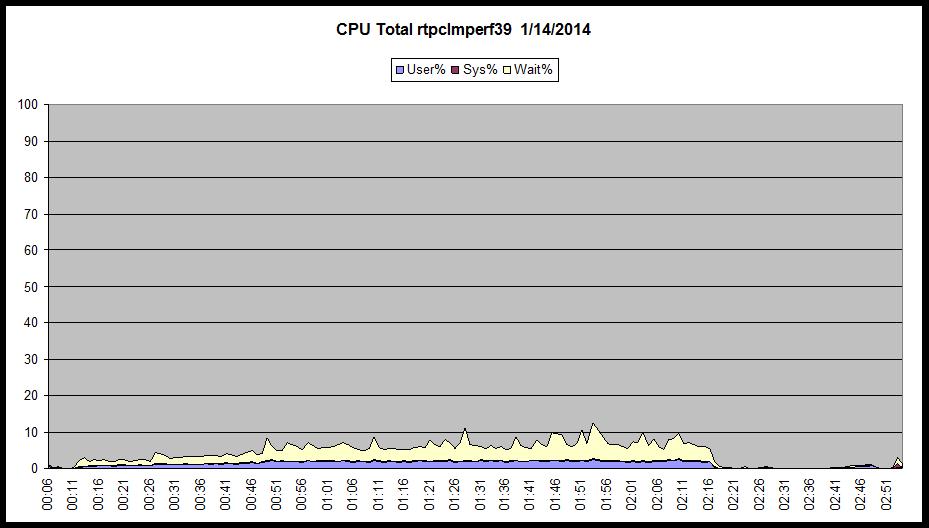
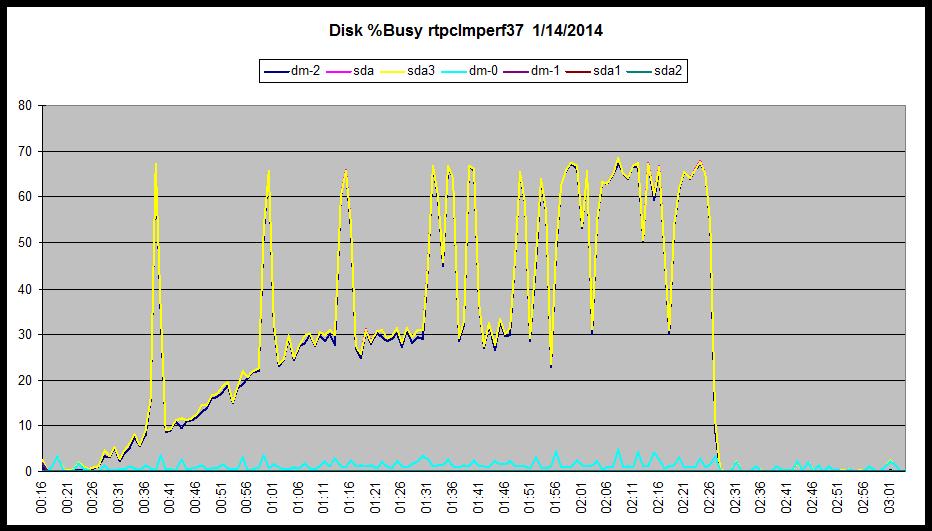
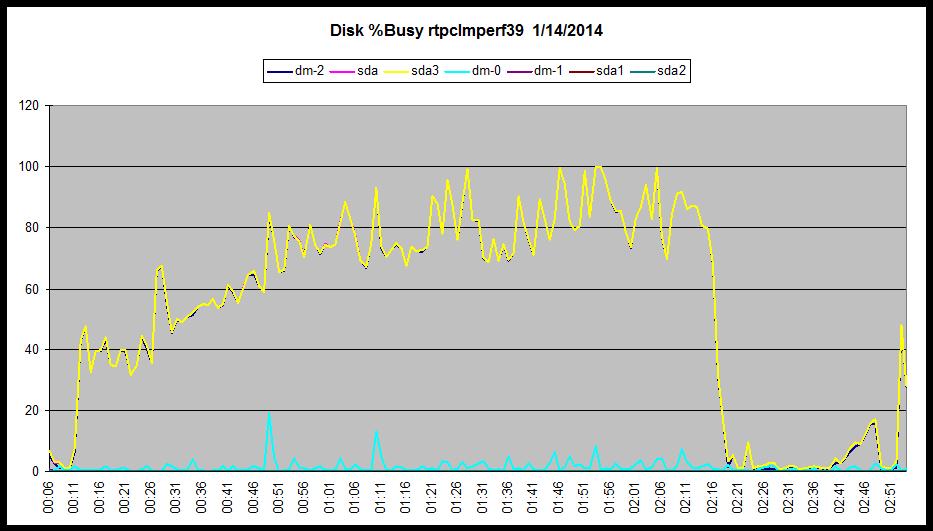
- Comparing nmon data for both 4.0.6 and 4.0.5 show similar CPU, memory and disk utilization on application servers and database server.
Topology
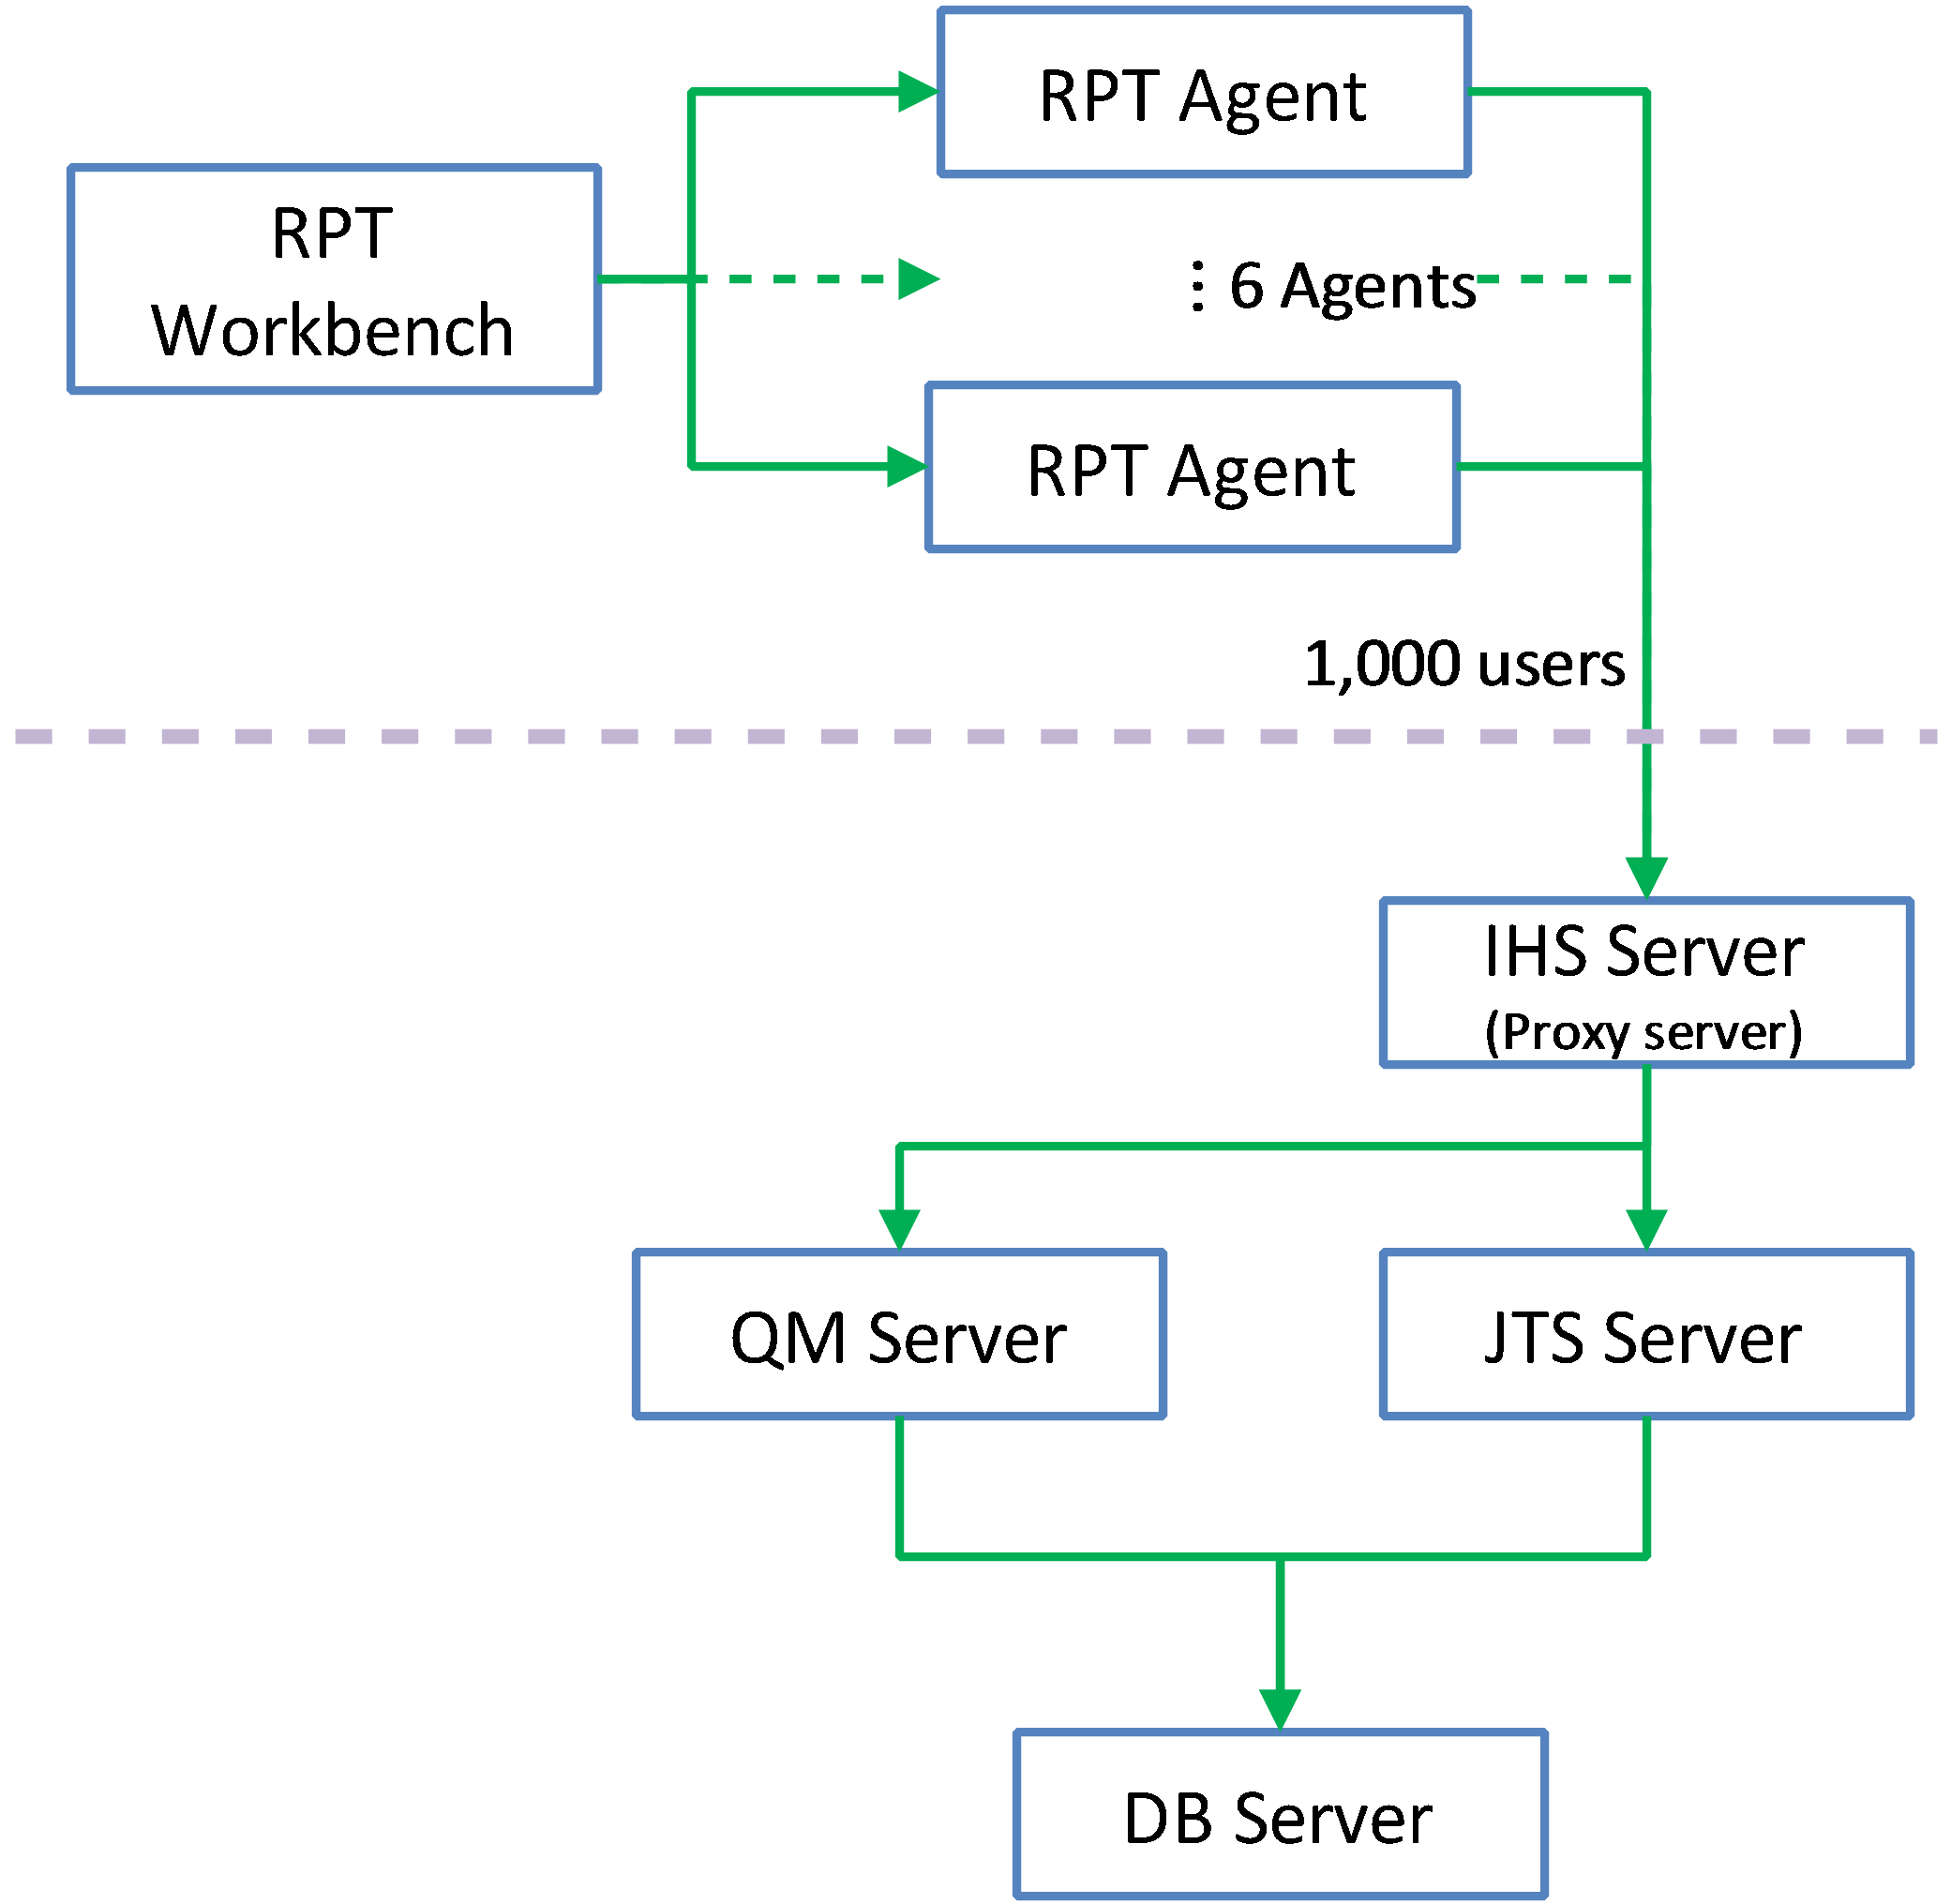
The topology under test is based on
Standard Topology (E1) Enterprise - Distributed / Linux / DB2.
The specifications of machines under test are listed in the table below. Server tuning details listed in
Appendix A
| Function |
Number of Machines |
Machine Type |
CPU / Machine |
Total # of CPU vCores/Machine |
Memory/Machine |
Disk |
Disk capacity |
Network interface |
OS and Version |
| Proxy Server (IBM HTTP Server and WebSphere Plugin) |
1 |
IBM System x3250 M4 |
1 x Intel Xeon E3-1240 3.4GHz (quad-core) |
8 |
16GB |
RAID 1 -- SAS Disk x 2 |
279GB |
Gigabit Ethernet |
Red Hat Enterprise Linux Server release 6.4 (Santiago) |
| JTS Server |
1 |
IBM System x3550 M4 |
2 x Intel Xeon E5-2640 2.5GHz (six-core) |
24 |
32GB |
RAID 5 -- SAS Disk x 4 |
279GB |
Gigabit Ethernet |
Red Hat Enterprise Linux Server release 6.4 (Santiago) |
| QM Server |
1 |
IBM System x3550 M4 |
2 x Intel Xeon E5-2640 2.5GHz (six-core) |
24 |
32GB |
RAID 5 -- SAS Disk x 4 |
279GB |
Gigabit Ethernet |
Red Hat Enterprise Linux Server release 6.3 (Santiago) |
| Database Server |
1 |
IBM System x3650 M4 |
2 x Intel Xeon E5-2640 2.5GHz (six-core) |
24 |
64GB |
RAID 10 -- SAS Disk x 16 |
279GB |
Gigabit Ethernet |
Red Hat Enterprise Linux Server release 6.1 (Santiago) |
| RPT workbench |
1 |
IBM System x3550 M4 |
2 x Intel Xeon E5-2640 2.5GHz (six-core) |
24 |
32GB |
RAID 5 -- SAS Disk x 4 |
279GB |
Gigabit Ethernet |
Red Hat Enterprise Linux Server release 6.3 (Santiago) |
| RPT Agents |
6 |
VM image |
4 x Intel Xeon X5650 CPU (1-Core 2.67GHz) |
4 |
4GB |
SCSI |
50GB |
Gigabit Ethernet |
Red Hat Enterprise Linux Server release 6.2 (Santiago) |
| Network switches |
N/A |
Cisco 2960G-24TC-L |
N/A |
N/A |
N/A |
N/A |
N/A |
Gigabit Ethernet |
24 Ethernet 10/100/1000 ports |
N/A: Not applicable.
vCores = Cores with hyperthreading
Network connectivity
All server machines and test clients are located on the same subnet. The LAN has 1000 Mbps of maximum bandwidth and less than 0.3 ms latency in ping.
Data volume and shape
The artifacts were contained in
one large project for a total of 579,142 artifacts.
The repository contained the following data:
- 50 test plans
- 30,000 test scripts
- 30,000 test cases
- 120,000 test case execution records
- 360,000 test case results
- 3,000 test suites
- 5,000 work items(defects)
- 200 test environments
- 600 test phases
- 30 build definitions
- 6,262 execution sequences
- 3,000 test suite execution records
- 15,000 test suite execution results
- 6,000 build records
- Database size = 15 GB
- QM index size = 1.3 GB
Methodology
Rational Performance Tester(RPT) was used to simulate the workload created using the web client. Each user completed a random use case from a set of
available use cases. A Rational Performance Tester script is created for each use case. The scripts are organized by pages and each page represents a user action.
The work load is role based as each of the areas defined under sequence of actions which are separated into individual user groups within an RPT schedule. The settings of the RPT schedule have been changed for RQM 4.0.6 performance test so that a global GC will not occur during the staging phase. Please also refer to the QM GC map.
User roles, test cases and workload characterization
User Roles
| Use role |
% of Total |
Related Actions |
| QE Manager |
8 |
Test plan create, Browse test plan and test case, Browse test script, Simple test plan copy, Defect search, View dashboard |
| Test Lead |
19 |
Edit Test Environments, Edit test plan, Create test case, Bulk edit of test cases, Full text search, Browse test script, Test Execution, Defect search |
| Tester |
68 |
Defect create, Defect modify, Defect search, Edit test case, Create test script, Edit test script, Test Execution, Browse test execution record |
| Dashboard Viewer |
5 |
View dashboard(with login and logout) |
Test Cases
| Use Role |
Percentage of the user role |
Sequence of Operations |
| QE Manager |
1 |
Test plan create:user creates test plan, then adds description, business objectives, test objectives, 2 test schedules, test estimate quality objectives and entry and exit criteria. |
| 26 |
Browse test plans and test cases: user browses assets by: View Test Plans, then configure View Builder for name search; open test plan found, review various sections, then close. Search for test case by name, opens test case found, review various sections, then close. |
| 26 |
Browse test script: user search for test script by name, open it, reviews it, then closes. |
| 1 |
Simple test plan copy: user search test plan by name, then select one, then make a copy. |
| 23 |
Defect search: user searches for specific defect by number, user reviews the defect (pause), then closes. |
| 20 |
View Dashboard: user views dashboard |
| Test Lead |
8 |
Edit Test Environment: user lists all test environments, and then selects one of the environments and modifies it. |
| 15 |
Edit test plan: list all test plans; from query result, open a test plan for editing, add a test case to the test plan, a few other sections of the test plan are edited and then the test plan is saved. |
| 4 |
Create test case: user create test case by: opening the Create Test Case page, enters data for a new test case, and then saves the test case. |
| 1 |
Bulk edit of test cases: user searches for test cases with root name and edits all found with owner change. |
| 3 |
Full text search: user does a full text search of all assets in repository using root name, then opens one of found items. |
| 32 |
Browse test script: user search for test script by name, open it, reviews it, then closes. |
| 26 |
Test Execution: selects View Test Execution Records, by name, starts execution, enters pass/fail verdict, reviews results, sets points then saves. |
| 11 |
Defect search: user searches for specific defect by number, user reviews the defect (pause), then closes. |
| Tester |
8 |
Defect create: user creates defect by: opening the Create Defect page, enters data for a new defect, and then saves the defect. |
| 5 |
Defect modify: user searches for specific defect by number, modifies it then saves it. |
| 14 |
Defect search: user searches for specific defect by number, user reviews the defect (pause), then closes. |
| 6 |
Edit test case: user searches Test Case by name, the test case is then opened in the editor, then a test script is added to the test case (user clicks next a few times (server size paging feature) before selecting test script), The test case is then saved. |
| 4 |
Create test script: user creates test case by: selecting Create Test Script page, enters data for a new test script, and then saves the test script. |
| 8 |
Edit test script: user selects Test Script by name. test script then opened for editing, modified and then saved. |
| 42 |
Test Execution: selects View Test Execution Records, by name, starts execution, enters pass/fail verdict, reviews results, sets points then saves. |
| 7 |
Browse test execution record: user browses TERs by: name, then selects the TER and opens the most recent results. |
| Dashboard Viewer |
100 |
View dashboard(with login and logout): user logs in, views dashboard, then logs out. This user provides some login/logout behavior to the workload |
Response time comparison
The median response time provided more even results than the average response time. The nature of the high variance between tests where some tasks at time takes a longer time to run, such as when the server is under heavy load, makes the average response time less predictive. The median values are mainly included in the following tables and charts for comparison.
In the repository that contained 500,000 artifacts with 1,000 concurrent users, no obvious regression was shown when comparing response times between runs.
Summary
There are totally
91 pages which are under test in the performance test. And the table below shows the summary of all the degradation pages whose response time are longer than in 4.0.5:
| Degradation percent range |
Count |
| Total |
40 |
| >=100% |
0 |
| >=50% and < 100% |
0 |
| >=20% and < 50% |
4 |
| >=10% and < 20% |
4 |
| >=0% and < 10% |
32 |
If we ignore the pages which response time are less than 1s and degradation percent are less than 20%, then we got the
conclusion:
| Degradation percent range |
Count |
| >=20% |
0 |
So no page performance degradation could be felt by users.
The numbers in the following charts include all of the pages for all of the scripts that ran.
Results
Resource utilization
Resource utilization for 4.0.6
| |
QM server |
DB server |
| CPU |
 |
 |
| Disk |
 |
 |
| Memory |
 |
 |
Garbage collection
Verbose garbage collection is enable to create the GC logs. The GC logs shows very little variation between runs. There is also no discernible difference between versions . Below is one example of the output from the GC log for each application.
QM
 JTS
JTS

Create Defect
 Back to Test Cases & workload characterization
Create Test Plan
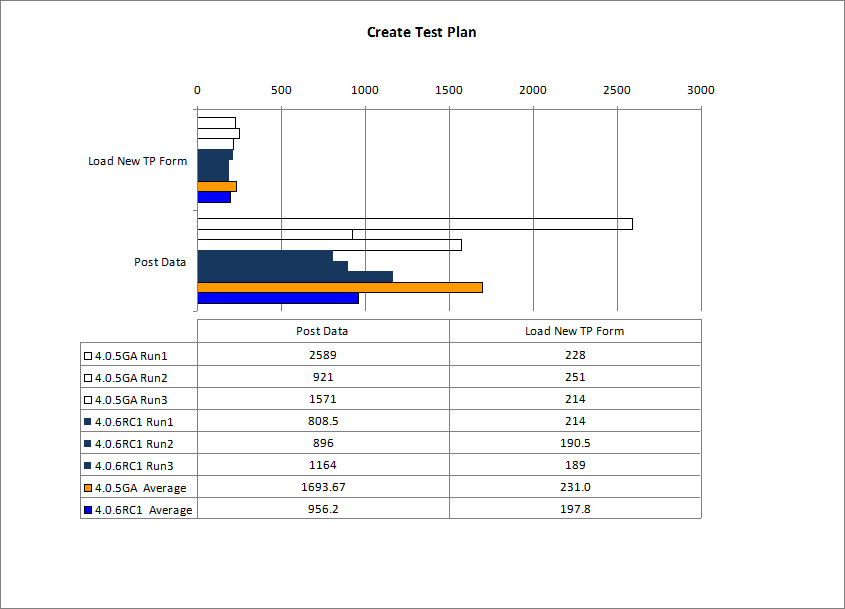 Back to Test Cases & workload characterization
Create Test Case
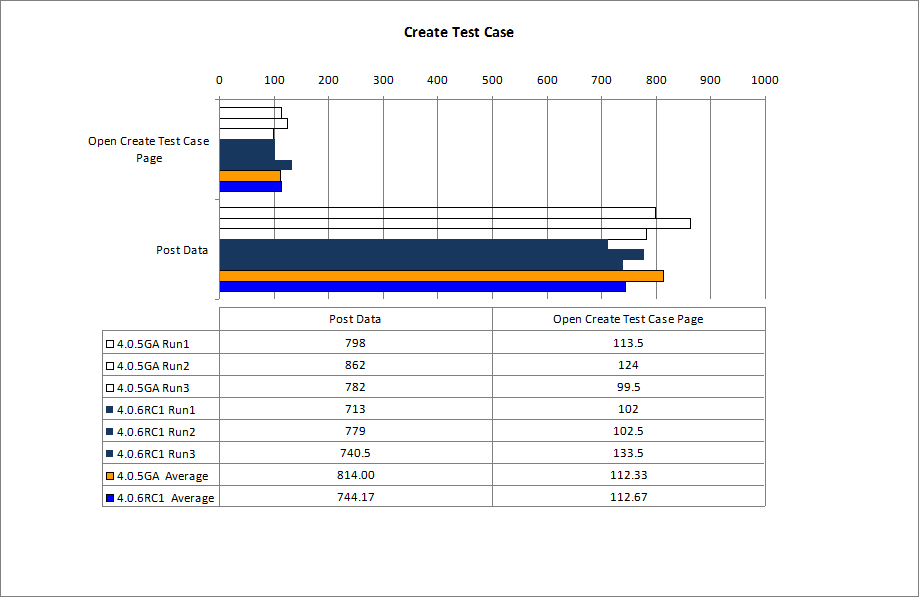 Back to Test Cases & workload characterization
Create Test Script
 Back to Test Cases & workload characterization
Browse Test Plans & Test Cases
 Back to Test Cases & workload characterization
Browse Test Scripts
 Back to Test Cases & workload characterization
Bulk Edit of Test Cases
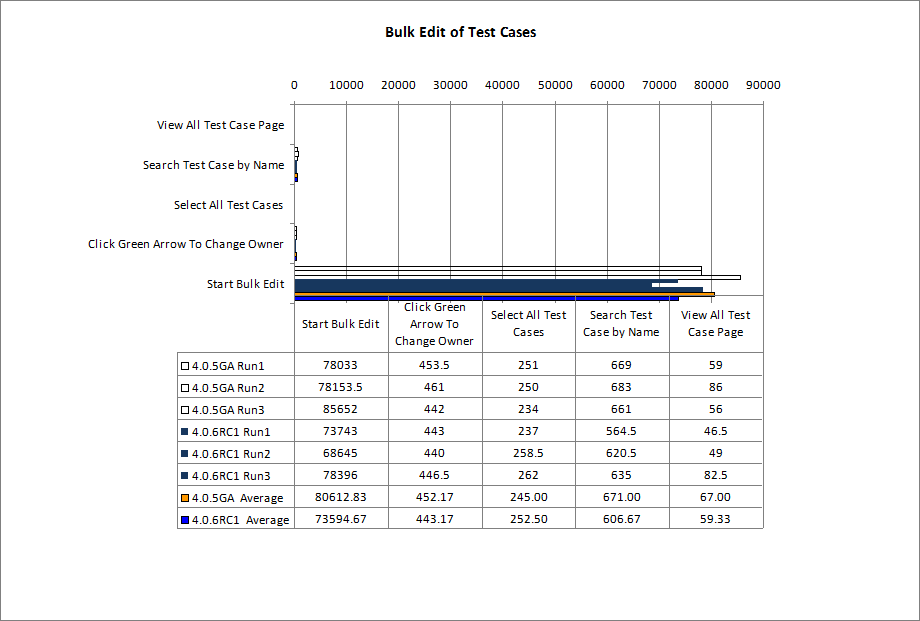 Back to Test Cases & workload characterization
Defect Search
 Back to Test Cases & workload characterization
Defect Modify
 Back to Test Cases & workload characterization
Edit Test Case
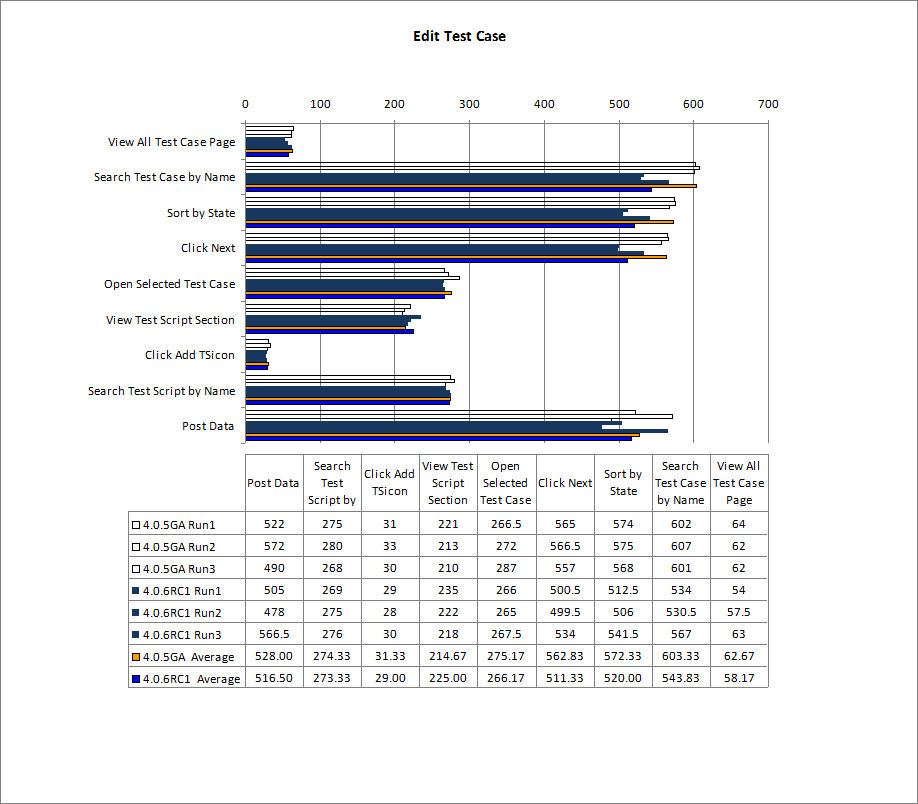 Back to Test Cases & workload characterization
Edit Test Environment
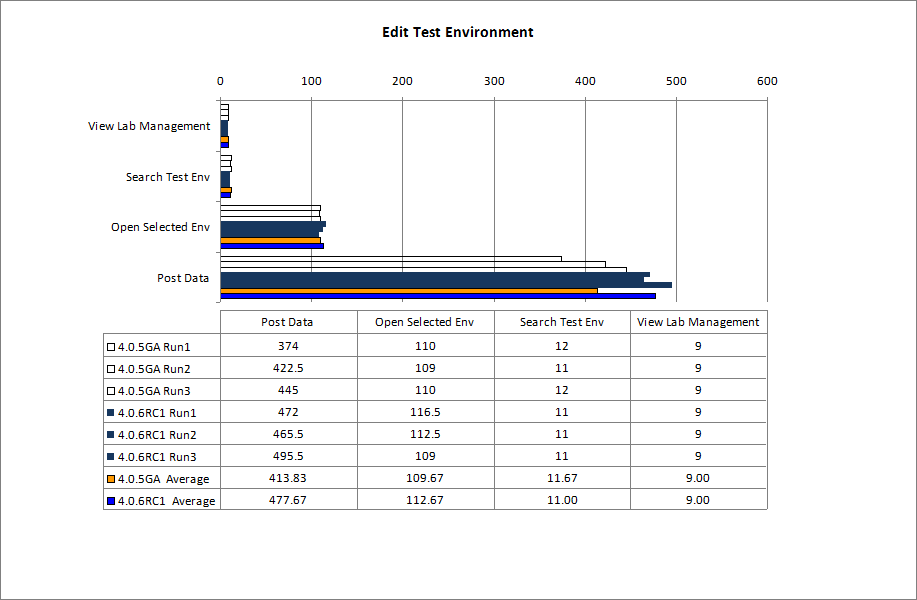 Back to Test Cases & workload characterization
Edit Test Plan
 Back to Test Cases & workload characterization
Edit Test Script
 Back to Test Cases & workload characterization
Full Text Search
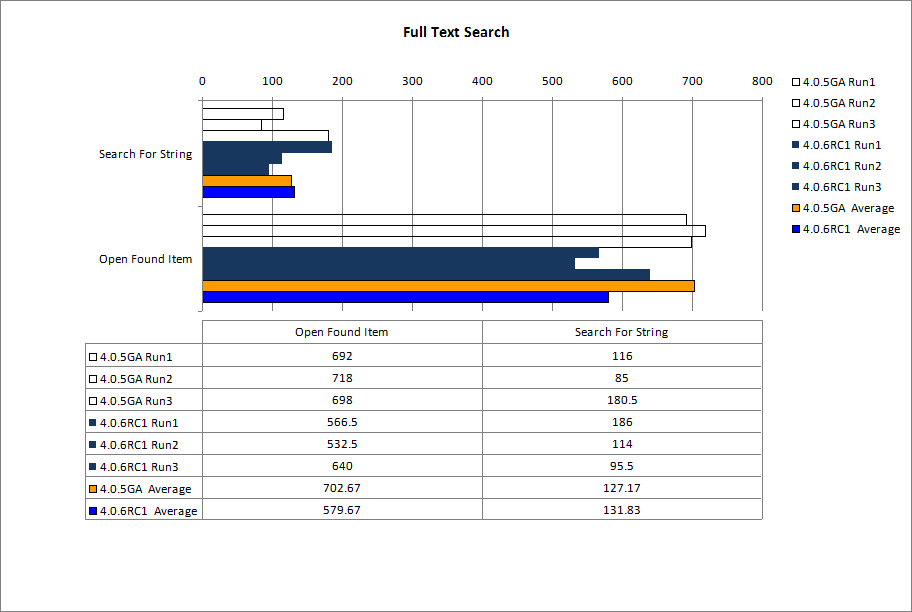 Back to Test Cases & workload characterization
Simple Test Plan Copy
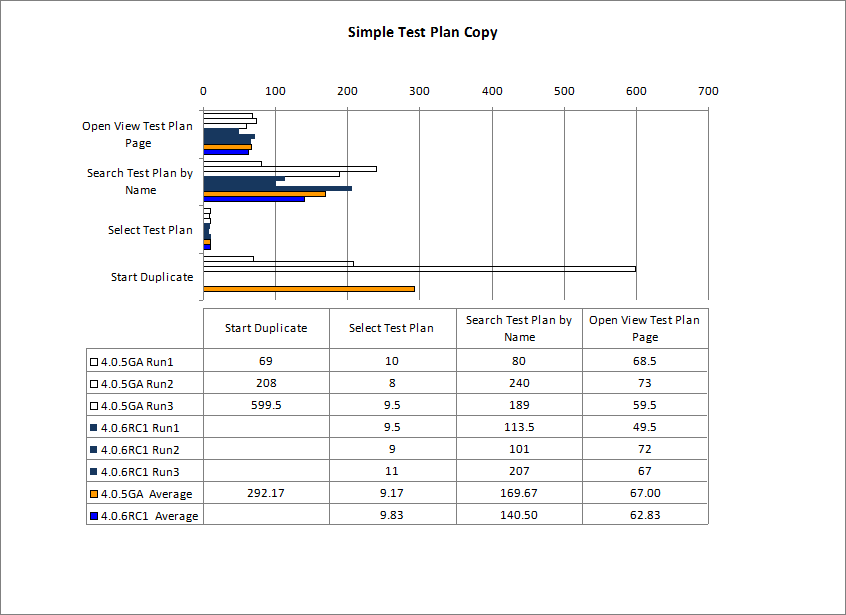 NOTE:
NOTE: There is no data for page 'Start Duplicate' in 406 because that the RPT script is not fit to the protocol change in 406.
Back to Test Cases & workload characterization
Test Execution For 4 Steps
 Back to Test Cases & workload characterization
Test Execution Record Browsing
 Back to Test Cases & workload characterization
View Dashboard
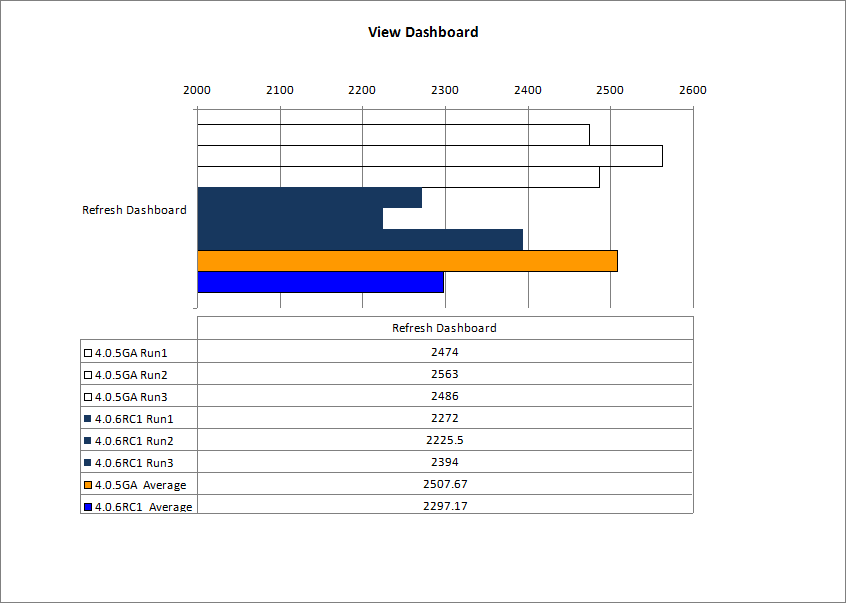 Back to Test Cases & workload characterization
View Dashboard with Login
 Back to Test Cases & workload characterization
Appendix A
Product
|
Version |
Highlights for configurations under test |
| IBM HTTP Server for WebSphere Application Server |
8.5.0.1 |
IBM HTTP Server functions as a reverse proxy server implemented
via Web server plug-in for WebSphere Application Server. Configuration details can be found from the CLM infocenter.
HTTP server (httpd.conf):
OS Configuration:
- max user processes = unlimited
|
| IBM WebSphere Application Server Network Deployment | 8.5.0.1 | JVM settings:
- GC policy and arguments, max and init heap sizes:
-XX:MaxDirectMemorySize=1g -Xgcpolicy:gencon -Xmx8g -Xms8g -Xmn2g -Xcompressedrefs -Xgc:preferredHeapBase=0x100000000
Thread pools:
- Maximum WebContainer = Minimum WebContainer = 500
OS Configuration:
System wide resources for the app server process owner:
- max user processes = unlimited
- open files = 65536
|
| DB2 |
DB2 10.1 |
|
| LDAP server |
|
|
| License server |
|
Hosted locally by another server |
| RPT workbench |
8.2.1.5 |
Defaults |
| RPT agents |
8.2.1.5 |
Defaults |
| Network |
|
Shared subnet within test lab |
For more information
About the authors
FelixChen
Questions and comments:
- What other performance information would you like to see here?
- Do you have performance scenarios to share?
- Do you have scenarios that are not addressed in documentation?
- Where are you having problems in performance?
Warning: Can't find topic Deployment.PerformanceDatasheetReaderComments