An active deployment of the Engineering Lifecycle Management (ELM) solution is always changing. For example, the number of active users increases as people start their work day, and decreases during off-hours. Over longer time frames, the deployment grows in size as artifacts are created. And usage patterns may change as new ELM capabilities are adopted or as end users tackle new business problems.
Of course, changes in usage patterns or deployment size can require adjustments to your deployment topology. IBM recommends adopting a proactive approach based on a Measure-analyze-act control loop.
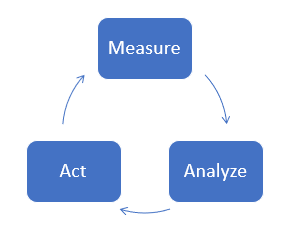 You measure key health metrics, analyze them to identify current (or potential) problems, and then act on your analysis to address the problems.
Measure
Start by identifying the key indicators of deployment health, and then measure the values of those metrics periodically. Keep a historical record of the measurements so you can see changes over time. IBM strongly recommends that you use a commercial tool for Application Performance Monitoring (APM) to do this.Basic health indicators
You can get a good initial assessment of deployment health by monitoring usage metrics at the operating system level. This includes:- % CPU utilization
- % CPU time spent waiting for disk
- % disk busy
- Free disk space
ELM health indicators
ELM applications surface health indicators through an implementation of J2EE industry standard managed beans, which are defined as part of the Java Management Extensions (JMX) specification. Managed beans provide a defined, well understood way of getting information about what ELM applications are doing. Start by reviewing the introductory material here:- A primer on ELM monitoring
- An overview of the managed mbeans
- Usage guides for ELM JMX Mbeans
- ELM Monitoring Guide
- Active services and server activity summaries (including concurrent user load)
- Resource usage (JDBC and RDB mediator pools)
- Database metrics
- Java Virtual Machine (JVM) metrics (including memory usage)
- ELM diagnostic data
- Resource-intensive scenarios
- JConsole is a graphical tool that lists available MBeans in a navigation tree.
- The repodebug UI that is available for most ELM applications includes an MBean browser that lets you search for MBeans and then inspect their values.
Other health indicators
Analyze
The Analyze part of the Measure-analyze-act loop involves looking at the data collected during measurement to identify current (or potential) problems. The simplest form of analysis is to assign a threshold to each metric. There is a potential issue if the metric routinely exceeds the threshold value. For example, a server may be overloaded if the percentage of used CPU exceeds 90%. You can also look at patterns over time. For example, you might only flag a CPU utilization issue if 7 out of the last 10 measurements exceeded 90%. You can also derive rates of change from your historical data. For example, you might see that used disk space is growing at a rate that means youll run out in 30 days. That might be more useful to you than waiting for used disk space to reach 95%. There will often be a correlation between metrics. For example, the response time of a service can be impacted by the CPU usage on a server, or by the number of transactions processed per second.The role of APM tools
An APM tool can greatly simplify the analysis process. IBM does not have a specific recommendation for APM tools, although some customers have successfully deployed Splunk. Other options include IBM Instana Observability and Prometheus. An APM tool should be able to do the following things:- Read values from JMX MBeans. Since most ELM performance data is made available through MBeans, this is a must-have feature.
- Collect performance data from database servers
- Collect performance data from proxy servers
- Collect operating system metrics from physical or virtual servers
- Display metrics in dashboards
- Configure alerts on metrics and provide notifications when alerts are triggered
Act
The final step in the Measure-Analyze-Act loop is to take action based on your analysis of the measurements. Some of the actions that you might take after analysis include:- Update the hardware on a server. Add more CPUs, memory or disk space.
- Tune the JVM parameters (usually heap settings)
- Adjust configuration parameters for the ELM applications (or for other software in the deployment like database or proxy servers)
- Deploy a new ELM application server and create projects on that server to balance workload
- Set up an entirely new deployment (e.g. JTS + applications)
- Restart an application or server
- Manually terminate long-running database queries
- Collect more detailed diagnostics or must gather data to drill deeper into problem areas
- Cluster a portion of the deployment. Add or remove cluster nodes based on changes in load.
- Open a Salesforce case and create APARs if problems are due to defects
- Upgrade to a new ifix or a new major release
- Adopt new product features
Example use cases
References
- Health Check is a provided optional dashboard widget that can be used to periodically check on server responsiveness.
- Metronome is a feature in the RTC client that provides understanding as to what the web services are doing and how the services are used by the individual RTC client with each user action.
- IBM Monitoring and Diagnostic Tools for Java - Garbage Collection and Memory Visualizer Version 2.7 The IBM Monitoring and Diagnostic Tools for Java - Garbage Collection and Memory Visualizer (GCMV) is a tool that you can use to visualize and analyze the memory usage and garbage collection activity of your Java application.
- NMON (AIX/Linux) gives you a wealth of system performance statistics and automatically creates graphs for CPU, memory, disk, and network usage.
- Visualizing available lifecycle query engine Mbeans using JConsole
- Javacore analyser The tool analyzes IBM Javacores and verbose gc logs and provides some reports like cpu/gc usage, blocked threads, some tips regarding the javacores.


| I | Attachment | Action | Size | Date | Who | Comment |
|---|---|---|---|---|---|---|
| |
MAA.png | manage | 5.8 K | 2023-10-28 - 16:01 | VaughnRokosz |
Contributions are governed by our Terms of Use. Please read the following disclaimer.
Dashboards and work items are no longer publicly available, so some links may be invalid. We now provide similar information through other means. Learn more here.