Recommended Configuration for Virtual Deployments of DOORS Next Generation 5.0 with a large repository (Windows)
Authors: SentellaCystrunk, VaughnRokosz Last updated: December 19, 2014 Build basis: Rational DOORS Next Generation (RDNG) 5.0Introduction
This report provides recommendation on the minimum virtual system and software configuration to employ for virtual deployments of Rational® DOORS® Next Generation (DNG) with large repositories of up to 500,000 artifacts. A study was conducted to examine the impact on DNG performance when the server is deployed with different virtual system and software configurations on Windows. Variations were based on the amount of processors and memory allocated to the virtual system hosting the DNG server and the size of the java heap allocated to the Requirements Management (RM) application.Disclaimer
The information in this document is distributed AS IS. The use of this information or the implementation of any of these techniques is a customer responsibility and depends on the customers ability to evaluate and integrate them into the customers operational environment. While each item may have been reviewed by IBM for accuracy in a specific situation, there is no guarantee that the same or similar results will be obtained elsewhere. Customers attempting to adapt these techniques to their own environments do so at their own risk. Any pointers in this publication to external Web sites are provided for convenience only and do not in any manner serve as an endorsement of these Web sites. Any performance data contained in this document was determined in a controlled environment, and therefore, the results that may be obtained in other operating environments may vary significantly. Users of this document should verify the applicable data for their specific environment.Summary of Results
A total of nine configurations were tested which included varying:- the number of vCPUs at 4, 6, and 8
- the amount of memory at 16G RAM with 8G Heap, 32G RAM with 16G Heap, and 64G RAM with 24G Heap.
Server Topology
The following topology was used for this testing:
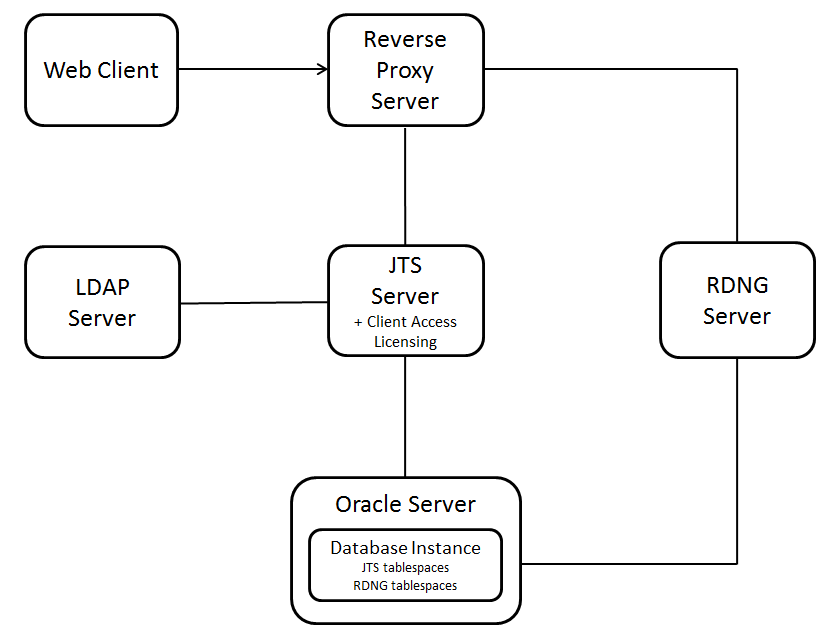
Figure 1. Topology
The specific versions of software used were:
| Software |
Version |
|---|---|
| IBM Rational CLM Applications |
5.0 |
| IBM HTTP Server and Web Server Plugin for WebSphere |
8.5.5.2 |
| IBM WebSphere Application Server |
8.5.5.2 |
| IBM Tivoli Directory Server |
6.1 |
| Oracle Database |
11.2.0.3.0 |
System Descriptions
This table lists the servers that were used for our testing:
| Role |
Manufacturer / Model |
CPU |
Number of CPU/Cores |
CPU Speed |
Memory |
Disk |
Disk Capacity |
OS |
|---|---|---|---|---|---|---|---|---|
| Reverse Proxy Server |
IBM x3250 M3 |
Intel Xeon CPU X3480 (1 quad-core) |
8 / 4 |
3.07 GHz |
15.5 GB | RAID 0 SAS Disk x 1 |
279 GB | RedHat Enterprise Linux Server 6.3,
64-bit |
| LDAP Server |
VMWare Virtual Platform |
Intel Xeon CPU E5-2665 0 (Virtual Processor) |
2 / 2 |
2.4 GHz |
2 GB | VMWare Virtual Disk - SCSI |
232 GB | Windows Server 2003 Enterprise SP2, 32-bit |
| JTS Server |
VMWare Virtual Platform IBM Flex System x240 Compute Node (Hypervisor) |
Intel Xeon CPU E5-2670 0 (Virtual Processor) |
4 / 4 |
2.6 GHz | 16 GB | VMWare Virtual Disk - SCSI |
60 GB | Windows Server 2012 Standard, 64-bit |
| DNG Server |
VMWare Virtual Platform IBM Flex System x240 Compute Node (Hypervisor) |
Intel Xeon CPU E5-2670 0 (Virtual Processor) |
4 - 8 / 4 - 8 (Varied, depending on test configuration) |
2.6 GHz | 16 - 64 GB (Varied, depending on test configuration) |
VMWare Virtual Disk - SCSI | 60 GB | Windows Server 2012 Standard, 64-bit |
| Database Server |
IBM x3650 M3 | Intel Xeon CPU X5667 (2 quad-core) |
16 / 8 |
3.07 GHz | 31.3 GB |
RAID 10 SAS Disk x 8 (with write-back caching) |
279 GB | RedHat Enterprise Linux Server 6.3, 64-bit |
Data Volume and Shape
For each DNG server, the artifacts were distributed between 6 projects for a total of 517,080 artifacts. The repository contained the following data:- 312 modules
- 510,000 module artifacts
- 7,080 requirement artifacts
- 714 folders
- 84 collections
- 1,563,492 comments
- 1,800 Public Tags
- 1,428 Terms
- 1,824,174 Links
- 600 Views
RM index size on disk = 40.2 GB
Each project contained the following data:
- 52 modules
- 85,000 module artifacts
- 1,180 requirement artifacts
- 119 folders
- 14 collections
- 260,582 comments
- 300 Public Tags
- 238 Terms
- 304,029 Links
- 100 Views
Test Methodology
IBM® Rational® Performance Tester (RPT) was used to simulate the workload. A RPT performance test script was created for each use case. The scripts are organized by pages where each page represents a user action. A RPT performance test schedule was used to execute the workload against each configuration. Users were distributed across many user groups and each user group repeatedly runs at least one script (use case). Tests were run as quickly as possible with a 1 minute think time between pages for each user. Each test simulated multiple users ranging from 50 to 300 virtual users across multiple stages. All users were loaded in at a rate of one user per seven seconds. With exception of the initial stage, 25 users were added at each stage which included a measurement period of one hour preceded by a thirty minute settle time. For every configuration tested, processor utilization and page response times were measured and their patterns were analyzed to determine the impact of the additional system resources.Workload Description
This table shows the use cases and the number of simulated users who were repeatedly running each script:|
Use case |
Description |
Percentage of 100 users |
|---|---|---|
|
Copy/Paste/Move/Delete Display module history Hover over and open a collection Manage folders Open the RM admin page |
Open a module that contains 1500 artifacts, select 25 artifacts, move them by using the copy and paste functions, and then delete the copied artifacts. Open a module that contains 1500 artifacts and show the module history and the module audit history. Display all of the collections, hover over a collection, and then open it. Click Show Artifacts to display folder tree and then create a folder. Move the new folder into another folder and then delete the folder that you just created. Open the rm/admin page. |
3% |
|
Create an artifact |
Create non-module artifacts. |
4% |
|
Create a collection |
Create collections that contain 10 artifacts. |
3% |
|
Create a module artifact end-to-end scenario |
Open a medium module that contains 1500 artifacts, create a module artifact, edit the new artifact, and delete the new artifact. |
20% |
|
Create a small module artifact end-to-end scenario |
Open a small module that contains 500 artifacts, create a module artifact, edit that new artifact, and delete the new artifact. |
11% |
|
Hover over a module artifact and edit it |
Open a module that contains 1500 artifacts and hover over an artifact. When the rich hover is displayed, edit the artifact text. |
2% |
|
Open the project dashboard |
Open a dashboard that displays the default dashboard. |
4% |
|
Search by ID and string |
Open a project, select a folder, search for an artifact by its numeric ID, and click a search result to display an artifact. Search for artifacts by using a generic string search that produces about 50 results. |
9% |
|
Scroll 20 pages in a module |
Open a module that contains 1500 artifacts and then scroll through 20 pages. |
19% |
|
Switch the module view |
Open a module that contains 1500 artifacts and then change the view to add columns that display user-defined attributes. |
18% |
|
Upload a 4 MB file as a new artifact |
Upload a file and create an artifact. |
7% |
Key Configuration & Tuning Parameters
WebSphere Application Servers
JTS
JVM arguments were set to:-Xmx4g -Xms4g -Xmn1g -Xcompressedrefs -Xgc:preferredHeapBase=0x100000000 -Xverbosegclog:gc.log -XX:MaxDirectMemorySize=1G -Xgcpolicy:gencon -Xloaminimum0.02
RM
WebContainer thread pool set to Min 500 Max 500Memory Configurations
For 16G RAM, JVM arguments were set to:-Xmx8g -Xms8g -Xmn2g -Xcompressedrefs -Xgc:preferredHeapBase=0x100000000 -Xverbosegclog:gc.log -XX:MaxDirectMemorySize=1G -Xgcpolicy:gencon -Xloaminimum0.02For 32G RAM, JVM arguments were set to:
-Xmx16g -Xms16g -Xmn5700M -Xcompressedrefs -Xgc:preferredHeapBase=0x100000000 -Xverbosegclog:gc.log -XX:MaxDirectMemorySize=1G -Xgcpolicy:gencon -Xloaminimum0.02For 64G RAM, JVM arguments were set to:
-Xmx24g -Xms24g -Xmn8G -Xcompressedrefs -Xgc:preferredHeapBase=0x100000000 -Xverbosegclog:gc.log -XX:MaxDirectMemorySize=1G -Xgcpolicy:gencon -Xloaminimum0.02Note: The heap was adjusted to not exceed 50% of the RAM or 24 GB of the maximum heap size.
IBM HTTP Server
In httpd.conf:
<IfModule worker.c>
      ThreadLimit           25
      ServerLimit           80
      StartServers          1
      MaxClients            2000
      MinSpareThreads       25
      MaxSpareThreads       75
      ThreadsPerChild       25
      MaxRequestsPerChild   0
</IfModule>
Oracle Database
Initialization parameters:processes = 500
shared_servers = 20
dispatchers = 5
Test Results - Compare Configurations
As indicated below in the comparison charts for average processor utilization and page response time (Figure 2 and Figure 3, respectively):- The number of virtual CPUs appears to be the primary factor which influences performance for virtual systems of this class.
- CPU utilization goes down with more CPUs as the load is spread out across more CPUs. This pattern held up to 225 users. Beyond that, it is less regular especially for the low memory configurations.
- The amount of RAM allocated to the VM also has an impact. For a 500K repository, 32G of RAM would be the minimum recommended. However, performance does not continue to improve greatly beyond 32G.
- The dynamic driving this is the size of the DNG index on disk. The operating system's file cache will try to load the index into memory. If most of the index can be memory-resident, performance improves. For a 500K repository, the index is 40G in size. The amount of memory available to the file system cache is roughly the total amount of RAM minus the JVM heap size. A 32G system with a 16G heap will allow for roughly 40% of the index to be memory-resident (vs. 20% for a 16G system).
- The response time charts show more stable response times (y-axis) as the load increases (x-axis) when server is configured with at least 6 vCPUs and 32G RAM 16G Heap. Hence, this configuration is recommended.
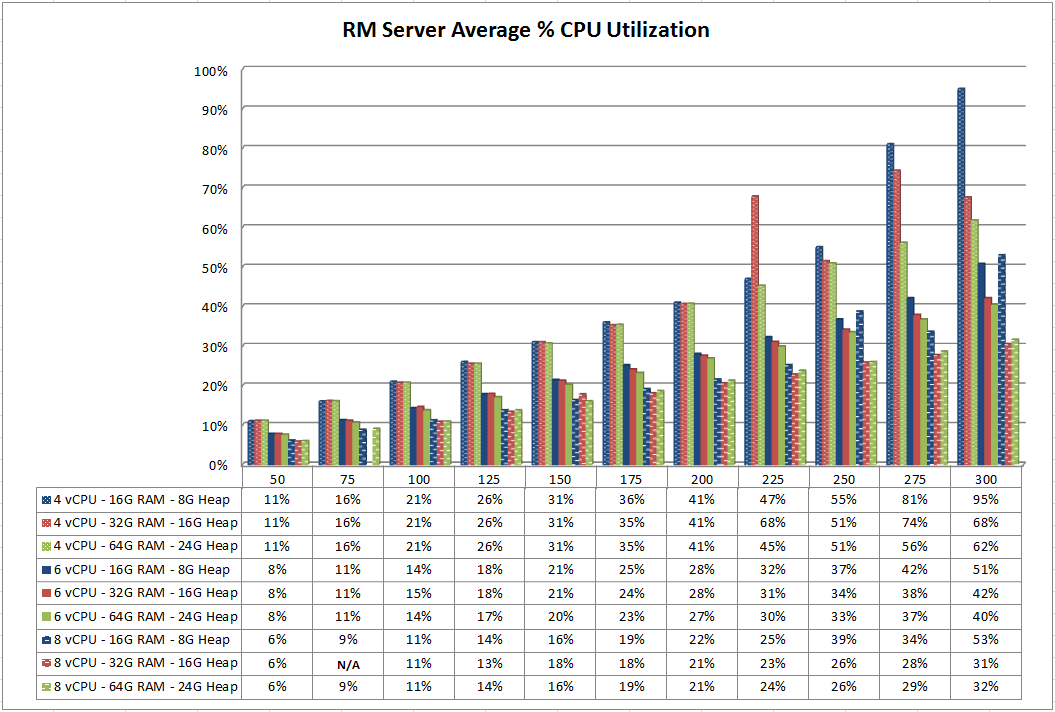
Figure 2. Average CPU Usage Comparisons
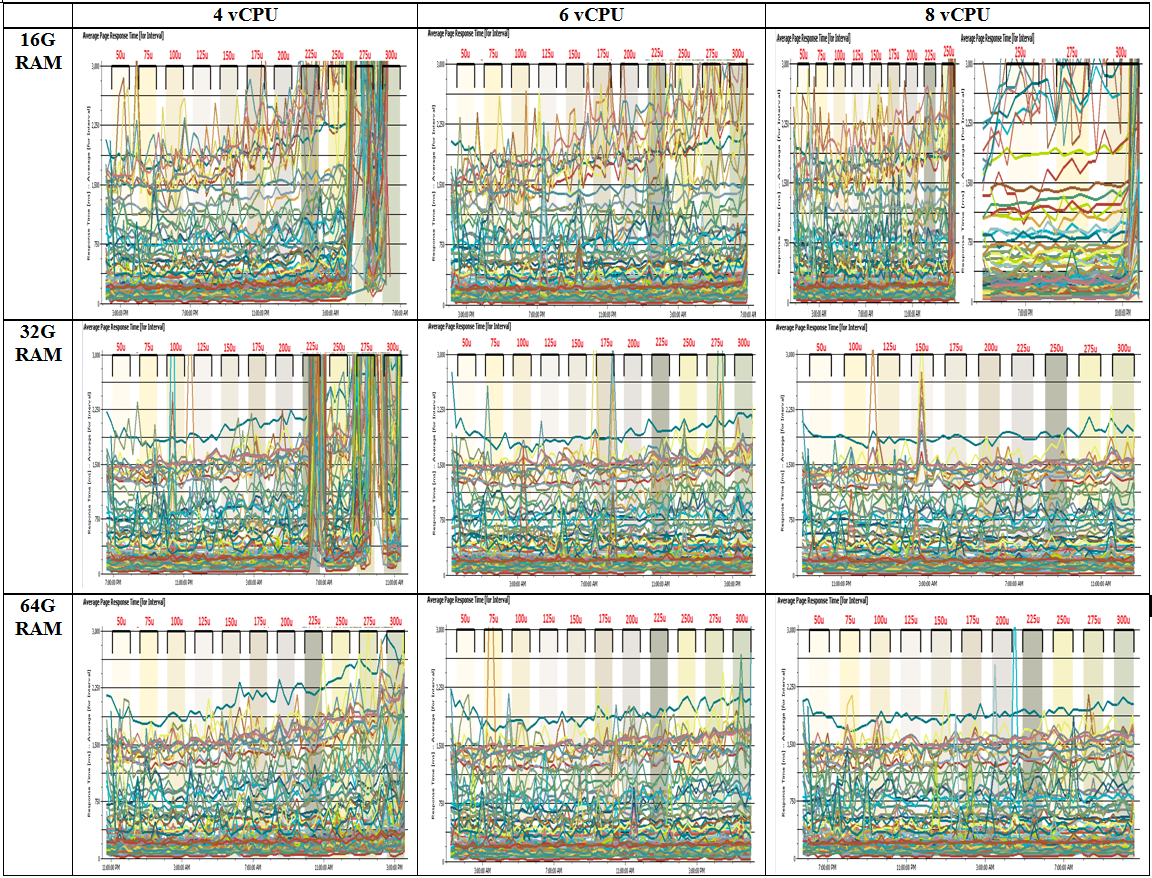
Figure 3. Average Page Response Times vs User Load Comparisons
Related Information
Contributions are governed by our Terms of Use. Please read the following disclaimer.
Dashboards and work items are no longer publicly available, so some links may be invalid. We now provide similar information through other means. Learn more here.