New to CLM 4.0, the Performance Health Check widget runs a number of tests to measure the performance of various systems in a CLM deployment including the client, application server and database server.
1. Open your personal Dashboard by either:
2. Click on Add Widget
3. Filter for Performance Health Check
4. Once the widget is found, click Add Widget to add the Performance Health Check Widget to your Browser
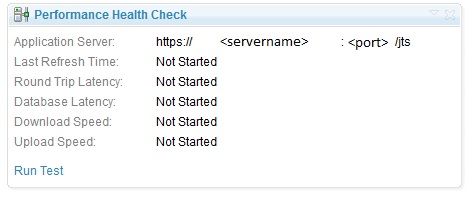
5. Navigate to your dashboard by closing out the 'Add Widget' section, and select Run Test
 The following tests are run: Round Trip Latency, Database Latency, Download Speed, Upload Speed. For more information on each test and some tips, see the Performance Health Check Blog.
| Disclaimer: The Performance Health Check widget is provided for informational purposes only. Licensee should not rely on this feature for any purpose, and is encouraged to continue to rely on any existing tests of Licensee's system that may be in place |
How to Use the Performance Health Check Widget
The Performance Health Check Widget is included out of box, but you will need to add the widget to your dashboard.1. Open your personal Dashboard by either:
- Selecting the drop down next to your user name in the top right hand corner of the web UI, and select "Open My Personal Dashboard (default)"
- Navigate to the following link:
https://<servername>:<port>/jts/dashboards/
2. Click on Add Widget
3. Filter for Performance Health Check
4. Once the widget is found, click Add Widget to add the Performance Health Check Widget to your Browser
5. Navigate to your dashboard by closing out the 'Add Widget' section, and select Run Test
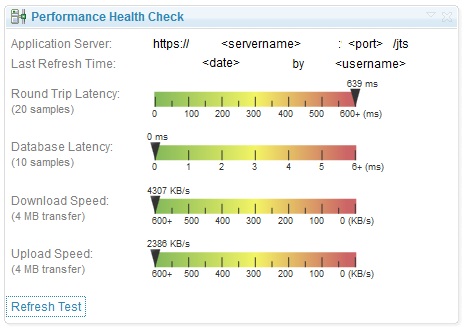
How to Analyze the Performance Health Check Widget
Once the widget has finished running the tests, the output would look similar to the widget contained below:
The following tests are run: Round Trip Latency, Database Latency, Download Speed, Upload Speed. For more information on each test and some tips, see the Performance Health Check Blog.
Related topics: None
External links:
- None
Additional contributors: None
Contributions are governed by our Terms of Use. Please read the following disclaimer.
Dashboards and work items are no longer publicly available, so some links may be invalid. We now provide similar information through other means. Learn more here.