CLM Monitoring
A primer on how to improve the reliability and predictability of your CLM or CE system.
Introduction
Complex distributed systems require an automated, layered approach to monitoring. Most organizations monitor key parts of their infrastructure, but monitoring typically stops at the application layer because it can be difficult to know what and how to effectively monitor applications without an understanding of the application architecture.
In this article we describe some key application metrics to monitor and present a high level overview of the distributed application architecture. We describe briefly what managed beans are and explain how to enable them.
Application reliability and predictability
Why monitor your applications?
Application monitoring has a proven track record of improving the predictability and reliability of your applications.
In general, monitoring is the process of looking at trends over time. This trending is done by collecting data through polling (pull) or publish (push) models. As soon as the data is available in some form, it needs to be collected and stored, so we can look at trends in the data. Most monitoring applications have analytical tools that allow the administrators to aggregate the data into charts or reports.
Applications do not, as a general rule, fail instantly: they degrade over time. Application monitoring tools collect metrics over time that can be used to perform trend analysis. Rules can be applied to these trends to alert administrators to situations that require intervention.
Armed with the trends, you can further refine your rules to ensure that administrators are notified in advance of issues and they can proactively resolve them before outages occur.
These trends help with understanding the “Why…” of sudden application failure. Before failure, users see behavior that they can’t explain, and neither can the administrator. Armed with application metrics and trend information, administrators are more comfortable with diagnosing the behaviors that led up to a failure and can better determine ways to avoid it in the future.
A monitoring system with warnings and alerts helps you see potential issues and gives you time to take steps to proactively address the problem. In cases where the system does something unexpected, you can look at specific trends to see if these can lead you to what caused the problem (such as in resource-intensive scenarios).
Armed with the information, you can build better warnings and alerts that allow you to proactively manage your systems.
Use cases
When developing a monitoring strategy, it is important to understand your stakeholder use cases to ensure that you are monitoring the parts of the system that they use the most. This approach is part of your “what” to monitor.
Service level agreements
Depending on stakeholder expectations, you need to customize your monitoring to help you meet your service level agreements. You might need to do additional monitoring or add more warnings than we would recommend in a basic deployment.
Typically you measure system availability or application uptime as the minimum bar. Some stakeholders use a combination of metrics that measure response and transaction times to build a better picture of how the system is responding.
Java management extensions
As part of the CLM serviceability strategy, we have implemented J2EE industry standard managed beans, which are defined as part of the Java Management Extensions (JMX) specification. Managed beans give us a defined, well understood way of providing information about what our applications are doing.
Java Management Extensions are a standard component of the Java Platform. They specify a method and design patterns for developers to integrate applications with management or monitoring software by assigning Java objects with attributes.
The extensions are dynamic, making it possible to monitor resources when they are created, implemented, or installed. For this article, we only focus on the monitoring aspects of JMX and managed beans, but the specification covers more than that.
The Java objects, called managed beans (mBeans), follow the design pattern described in the JMX specification and offer common access points for agents to consume data from the mBeans. In the CLM implementation, we leverage MXBeans, which are a documented variant of managed bean. MXBeans use a predefined set of data types making them portable and easy for any monitoring client to consume.
Jazz Application Framework SDK
Many of the Jazz-based applications are built on a common framework called the Jazz Application Framework SDK. These applications all share a common set of services that includes the MXBeans. Applications built on other application frameworks will be covered in a future article.
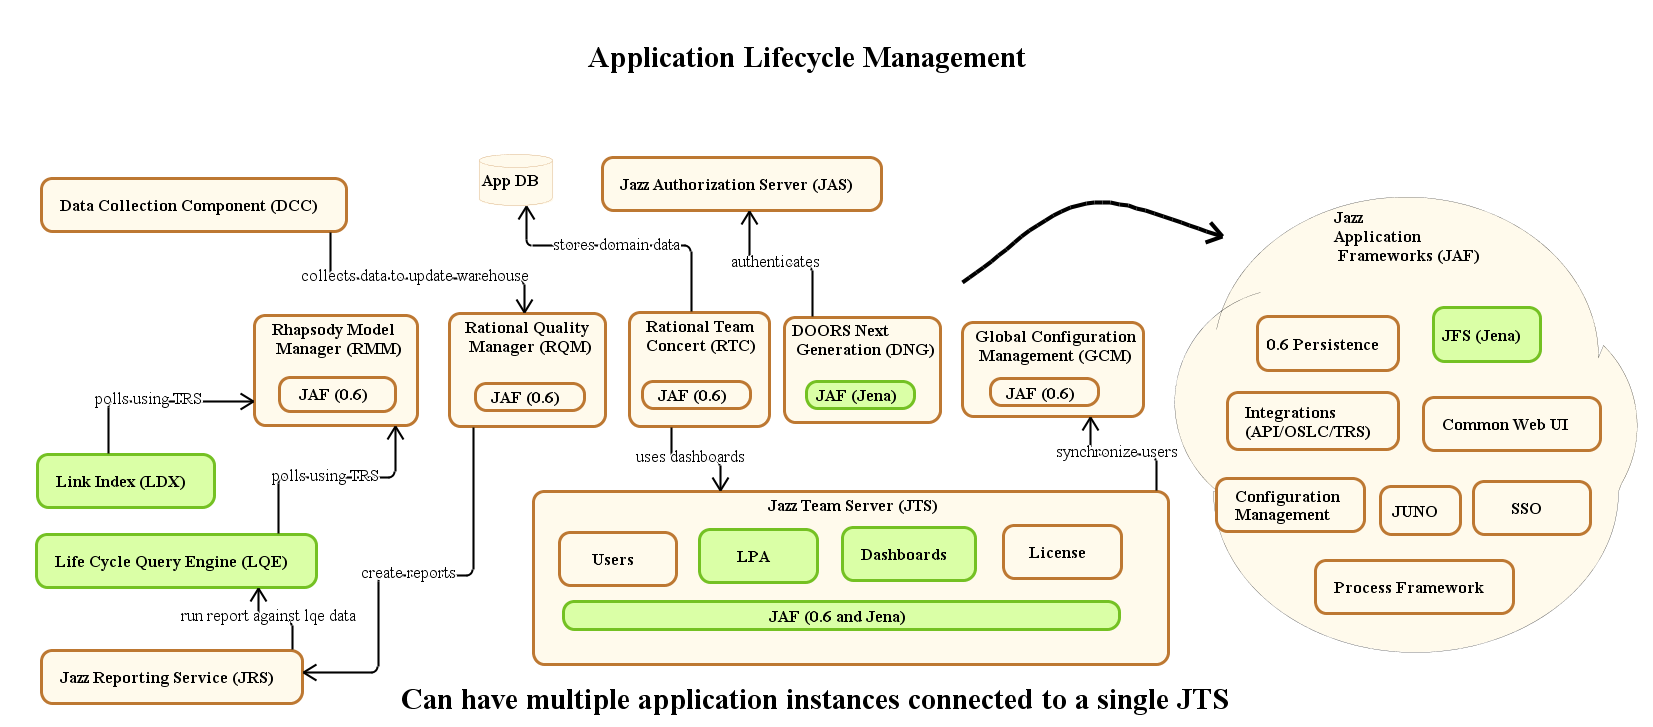
Jazz Foundation Architecture Diagram
Jazz service invocation architecture
When we set out to instrument an application, we need to look at the architecture from a slightly different perspective, the service invocation perspective. This viewpoint gives us a better picture of specifically where we needed to build MXBeans based on entry points to provide data to a monitoring system. This diagram of the service invocation architecture shows the kinds of data you can get from the JMX service.
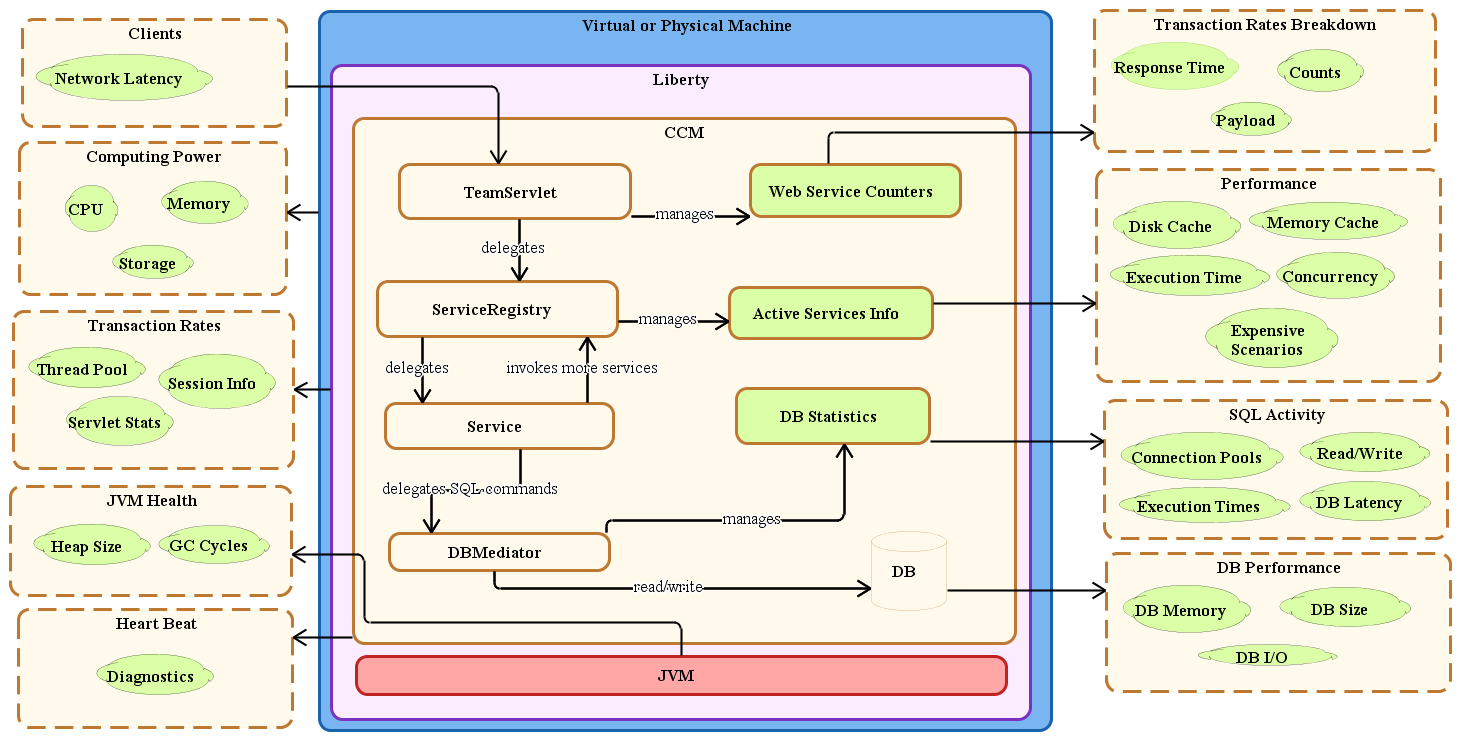
Jazz Service Architecture
What to monitor in CLM
Application monitoring should compliment your enterprise monitoring strategy. If you have a hybrid environment (a mixture of on-premises and SaaS or PaaS services), it is important that you monitor the key distributed services at the network, operating system, database, and application levels. A topology diagram of your CLM system will show you the potential points of failure and the applications that should be monitored.
For CLM specifically, six key application areas should be monitored. We provide much more instrumentation, but monitoring these key areas will get you started.
1. Alerts on the Active Services Summary bean
An active service consumes CPU on the server while it is running. If the number of active services exceeds the number of processors available on the server, the server is most likely nearing 100% CPU utilization and the performance of the server will suffer. Here is a list of attributes for this bean.
Attribute | Description | Threshold |
longestDuration | For the active service that has been running the longest, how long it has been running (in ms). | ALERT: longestDuration > 30 s |
totalCount | The count of active services. This bean provides an alert when the number of active services is nearing the number of processors available on the system. If multiple applications are hosted on one server, it provides an alert based on the sum of the totalCount attribute across all MBeans. The AvailableProcessors attribute is reported by the java.lang:type=OperatingSystem MBean. | ALERT: totalCount > AvailableProcessors WARN: totalCount > 75% of AvailableProcessors |
countExceedingThresholdDuration | The number of active services that have been running longer than a specified threshold (5 s by default). Long-running active services consume CPU, so this attribute indicates that the scalability of the server might be compromised. | ALERT: countExceedingThresholdDuration > 0 |
cpuRatio | The total count divided by the number of available processors. You can use this MBean instead of totalCount if the AvailableProcessors metric is not available or hard to access. If multiple applications are hosted on one server, then it takes the sum of the cpuRatio across all MBeans as the basis for alerts. | ALERT: cpuRatioo > 1 WARN: cpuRatio > .75 |
You can use the active services summary metrics to compliment system CPU utilization metrics. The Active Services Summary bean is part of the HighFrequencyMetricsNodeScopedTask and is enabled by setting the Enable Active Services MBean to true.
Use the Active Services metric bean to collect details about all of the active services so that you can drill down into what is causing the alert conditions.
Long running active services indicate one of two things: (a) performance will degrade if the system is overloaded, resulting in large numbers of long running active services, or (b) long running active services under low load conditions suggest that the scalability of the system is compromised. If enough people access the slow service at the same time, the server will overload.
2. Alerts on Resource Usage beans (JDBC and RDB mediator)
The Java Database Connectivity (JDBC) and Relational Database mediators can help you monitor access to critical application resources. Be sure to monitor both sets of beans (JDBC and RDB) because there have been cases where RDB beans alert before JDBC beans.
If you have multiple applications installed on one server, create an alert for each MBean separately. Don’t aggregate across multiple MBeans.
If the JDBC or RDB mediator pool have queue lengths other than zero, the server is throttling access to the database. Increase the JDBC or RDB mediator pool size; find it by clicking Server > Advanced Properties.
The usage percentage can be used to warn you when you are close to exhausting the pools, so you can plan to increase the pool sizes during your next maintenance window (a server restart is required).
Active connections gives you similar information to usage percentage — you can divide the active connection value by the pool size to get a usage percentage. It is recommended that you create an alert for both usage percentage and graph active connections.
Facet | Attribute | Description | Threshold |
Queue length | value | If the size of the resource pool is exceeded, this value becomes non-zero and indicates how many threads were waiting for a connection. | ALERT: value > 0 |
Usage percentage | averageOverInterval | Active connections / pool size at the time of last collection. | ALERT: averageOverInterval > 90% WARN: averageOverInterval > 80% |
Active connections | value | The number of active connections at the time of the last collection. | Alert on usage percentage instead of active connections |
3. Database metrics bean
Average times for SQL operations will usually be under 1 ms. Periods of long response times can indicate a database problem. Sustained periods of poor SQL performance can also be a side effect of increasing data volumes, or complex CLM queries or reports.
com.ibm.team.foundation.sqlactivity:name=jts,type=sqlActivitySummaryMetrics,sqlStmtType=[read, write, other]
If SQL thresholds are exceeded, make sure that the database statistics are up-to-date. For more in depth notes on Oracle database performance, see Understanding the performance of SQL statements in Oracle.
SQLStmtType | Attribute | Description | Threshold |
read | sqlAverageTime | Overall average time (in ms) for all SQL read operations. | ALERT: sqlAverageTime > 250ms |
write | sqlAverageTime | Overall average time (in ms) for all SQL write operations. | ALERT: sqlAverageTime > 500ms |
other | sqlAverageTime | Overall average time (in ms) for rollbacks and commits. | None |
If multiple applications are installed on a server, be sure to create an alert for each MBean separately. Don’t aggregate across multiple MBeans. It is important to remember that the SQLActivityMetricsTask updates less frequently: by default, every 60 minutes instead of the typical 15 minutes.
4. Liberty and Java Virtual Machine (JVM) beans
If the CPU utilization of the JVM (ProcessCpuLoad) is much lower than the overall CPU utilization, other processes might be competing for CPU on the CLM server. If the overall CPU usage is high, you should investigate to see if multiple services can be disabled or moved to other systems.
The java.lang:type=OperatingSystem and WebSphere:type=ThreadPoolStats,name=Default Executor are managed beans that are enabled by default.
If the JVM uses too much physical memory, it can be killed by the operating system. Generate an alert if the JVM grows to be 80% of the available physical memory.
ActiveThreads can be used instead of the active services summary MBean to produce an alert when service calls are backing up.
MBean | Attribute | Description | Threshold |
java.lang:type=OperatingSystem | SystemCpuLoad | Overall CPU utilization (from 0 to 1). | ALERT: SystemCpuLoad > .9 WARN: SystemCpuLoad > .8 |
java.lang:type=OperatingSystem | ProcessCpuLoad | CPU utilization of the JVM (from 0 to 1). | ALERT: ProcessCpuLoad/SystemCpuLoad < .5 |
java.lang:type=OperatingSystem | ProcessPhysicalMemorySize | Memory used by the JVM. | ALERT: ProcessPhysicalMemorySize/TotalPhysicalMemory > .8 |
WebSphere:type=ThreadPoolStats,name=Default Executor | ActiveThreads | Number of active threads (web containers) used by Liberty. | ALERT: ActiveThreads > AvailableProcessors |
Note: AvailableProcessors is a java.lang:type=OperatingSystem > AvailableProcessorss attribute. You can build a rule based on attributes from two separate managed beans.
5. Diagnostics bean
The diagnostics managed bean is part of our server health metrics and performs a series of diagnostic tests on the system. It also provides an administrative task in the Admin user interface. This MBean updates every 70 minutes. The diagnostics bean data is collected when the DiagnosticsMetricsTask is enabled.
MBean | Attribute | Description | Threshold |
Diagnostics | com.ibm.team.foundation.diagnostic:name=<< contextRoot>>, type=diagnosticMetrics,testId=* | This MBean provides the results of the server diagnostics, every hour by default. It is useful to track the status of the periodic execution of server diagnostics. | ALERT: Throw an alert if any of the diagnostic result shows a failure. |
There are several diagnostic tests, and these vary by application. To monitor your diagnostic output (only providing alerts on failures) you need to build a pattern-based rule. Build these rules based on each tool.
The testId is a wildcard that means all diagnostic metrics, and the attribute to evaluate is status. You are looking for the value ERROR. When status=ERROR, look at detailStatusDesc for more details.
6. Resource-Intensive Scenarios Summary bean
Some system and user actions performed on CLM systems can be resource-intensive. When these actions occur on systems that are already taxed, the system can slow down or potentially run out of resources. We recommend monitoring these scenarios to see if they are having a negative impact on your system. Data on resource-intensive scenarios is collected when the Scenario Metrics MBean is enabled, which is part of the MetricsCollectorTask, when you actually run an expensive scenario.
You can review the details of resource-intensive scenarios on the Jazz.net deployment wiki (https://jazz.net/wiki/bin/view/Deployment/CLMExpensiveScenarios).
MBean | Attribute | Description | Threshold |
Resource Intensive Scenarios – Summary Elapsed time in milliseconds | com.ibm.team.foundation.counters:name=<<contextRoot>>, type=counterMetrics, group=scenarios,facet=elapsed time in millisecs,counterNameAndId =summary_* | The counts and average response time for all the resource-intensive scenarios in the system during the collection interval. This metric helps you understand how the resource-intensive scenarios are performing and track any degradation in their response times. | ALERT: Throw an alert if Elapsed time (averageOverInterval) is greater than 120s WARN: Throw a warning if countOverInterval is greater than 3 ALERT: Throw an alert if countOverInterval is greater than 5 |
This is another pattern-based rule. In this case you are looking at the averageOverInterval and countOverInterval attributes in all of the resource-intensive scenarios. They would look something like this:
com.ibm.team.foundation.counters:name=<<contextRoot>>,
com.ibm.team.foundation.counters:name=<<contextRoot>>,
Enabling managed beans in CLM
We will be enabling the metric collector tasks related to the specific managed beans in the six categories we want to collect data for. To start, the administrator must open the Admin UI and go to Manage Server > Advanced Properties (or Serviceability in later releases) to enable the serviceability services that generate the MXBean data.
- Active Services Summary bean (1) is part of the HighFrequencyMetricsNodeScopedTask and can be enabled by setting the Enable Active Services MBean to true.
- Resource Usage beans (2) are enabled through the MetricsCollectorTask, by setting the Enable Resource Usage MBean to true.
- Database Metrics bean (3) is enabled through the SQLActivityMetricsTask by setting the Enable SQL Activity Metrics MBean to true.
- Liberty and JVM (4) beans are enabled by default. You don’t have to do anything else to see attributes from these beans:
(a) java.lang:type=OperatingSystem (b) WebSphere:type=ThreadPoolStats,name=Default - Diagnostics bean (5) is enabled through the DiagnosticsMetricsTask by setting the Enable Diagnostic Metrics MBean to true.
- Resource Intensive Scenarios Summary bean (6) is part of the MetrictsCollectorTask and is enabled by setting the Enable Scenario Metrics MBean to true.
It is important to remember that enabled beans only display data in RepoDebug or your monitoring application after the update interval. If there is no information (for example, if no resource-intensive scenarios have occurred), you won’t see an MBean in RepoDebug until there is some data to show.
Troubleshooting
Here are some basic troubleshooting topics. The JMX service has been around for a long time, and we have tested most of our MXBeans with a variety of commercial monitoring tools. Common problems have to do with enabling the MXBeans, data sampling, or the specifics of your monitoring system.
RepoDebug
The RepoDebug (Repository Debugger) service is a development tool to look at the internals of your Jazz-based system. The development team uses it to troubleshoot issues that are not obvious from the logs or the admin user interface. It has a simple UI and although it supports some manipulation, that should only be done under the guidance of IBM Support or Development. This tool provides you with a mechanism to look at a single update of the enabled MXBeans. It is a simple way to make sure that the MXBeans are enabled and publishing data.
Enabling RepoDebug
The RepoDebug service is disabled by default. You must enable it from the administrative console. To enable the RepoDebug service, the property com.ibm.team.repository.debug.enabled must be set to true in the advanced properties. There is no need to restart your server. As soon as the property is saved, Jazz administrators can see the RepoDebug UI.
You can then navigate to https://server:port/context-root/repodebug, where context-root is the application context root, so the Jazz Team Server (jts) would be https://server:port/jts/repodebug. This might differ, depending on how you define your CLM context roots in your enterprise.
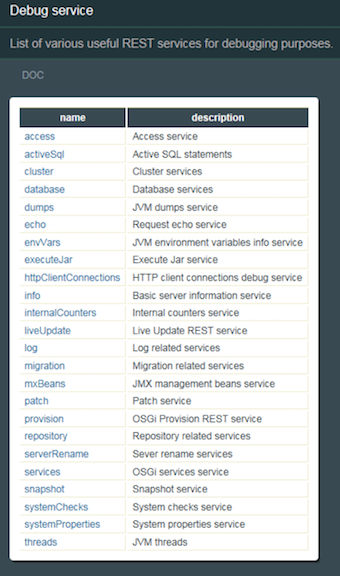
The RepoDebug main screen
Navigate to the mxBeans link which will list the current enabled managed beans (Primarily Java and WebSphere Liberty). We will use these beans to monitor the operating system and thread pools (item #4 above).
To save a mouse click, you can navigate directly to the MXBeans page by using the following URL: https://server:port/context_root/repodebug/mxBeans. The specific information will appear as attributes in a child page.
Data sampling
By default, most of our managed beans update every 15 minutes. The sample rate was determined based on a frequency that would show trends without incurring too much overhead on the system. Some monitoring tools collect data more frequently, but this can usually be adjusted. Increasing the update frequency will place more load on the system, but give you more data to look at. Collecting data faster than the update rate will result in duplicate data in your monitoring system, and should be avoided.
Baselines
Some of the more advanced application performance monitoring (APM) tools have baseline features that allow you to take snapshots of all data collected for the system and use that data to build alerts when there is significant deviation from the baseline. These tools can be very useful, but only if your use cases are consistent.
Alerting
Commercial application monitoring tools can be configured to generate alerts if thresholds are exceeded. The capabilities vary from tool to tool. Most trigger an alert if a value exceeds a threshold for a specified amount of time or frequency. Alerts and alert history can be viewed in the monitoring UI. Most of these tools offer notification features in the form of email, SMS messages, and calls. Alerting systems usually check for threshold violations every 10 seconds.
Reference
CLM Monitoring Managed Beans Reference
About the authors
Vishy Ramaswamy is a Senior Technical Staff Member in the Jazz Foundation development group in Persistent Systems. In this capacity he is responsible for defining and managing the overall architecture of the Jazz Application Framework services and capabilities for CLM (Collaborative Lifecycle Management) products. Vishy’s career in software development spans 21 years, during which time Vishy has worked in a technical leadership role on products in Application LifeCycle Management space and software services related to the telecom, wireless, health care, federal government, and defense industries.
Vaughn Rokosz is a Senior Technical Staff Member (STSM) and technical lead of the performance engineering team for Jazz products, where he looks at the performance and reliability of the Jazz products at scale. He curates the Performance pages on the Jazz.net Deployment wiki, and has published a number of articles on capacity planning. He has worked in a variety of areas, including factory automation, statistical analysis, document and knowledge management, and collaborative lifecycle management, and is deeply interested in the dynamics of complex software systems.
Richard Watts is the Jazz Foundation Program Director and Product Delivery Lead for the Jazz Team Server, part of the CLM team in Persistent Systems. He has over 25 experience years building commercial software and leading development teams. He has worked on various products in the application lifecycle management, application development tooling, messaging, calendar and scheduling, and financial applications.
© Copyright IBM Corporation 2018