Must-gather information for diagnosing long-running SQL statements on DB2
Authors: WilliamChatham, HongyanHuo, MadanKumarShanmugam, VaughnRokosz, PaulEllisBuild basis: DOORS Next 7.x, ETM, EWM 6.x, 7.x
Page contents
- Symptoms
- Root Causes
- Checklist Before Execution
- During `db2batch` Execution
- If No Data Captured in `actuals_mon` , then try the following steps:
- Cleanup and Reset Instructions
- Alternative: Use `db2caem`
- Additional Tips
It is important that before starting an expensive investigation into Db2 performance that you ensure that the database statistics are up-to-date. See How often do the database statistics need to be updated when using IBM Engineering Lifecycle Management? to understand when they were last run and ensure they were updated within the last week, or since a large data change.
There is a DOORS Next must gather for performance issues which should be used in conjunction with this guide. ELM Support troubleshoot use cases which are regarding slow performance and typically do not start with Db2 symptoms. It is imperative when investigating a DB2 performance, such as 100% CPU, that you collect ELM-specific data too so that you clarify whether the root cause is ELM or database related.
In order to diagnose a long-running SQL statement on DB2 we need to gather the following:
 You can also enable diagnostic logging in DOORS Next Generation by editing conf/rm/log4j2.xml and adding in the following line:
 Each bind parameter will have a value in the XML file, similar to this:
entry, you need to manually at a #PARAM directive to your SQL. This can be tedious, so you may want to use a simple script to extract values and generate PARAM statements.
Note: the main querystats page does not reliably report the queries, as they may not list literals and may condense long query strings. These will not be usable to get Actuals values later. Use the stat record, or the application log using the SQL loggers.
* `section_actuals` length appears as 0
* `EXPLAIN_FROM_ACTIVITY` call fails with missing application ID or activity
The client accounting string must be set to `'actuals'` to match the workload created.
2. section_actuals not enabled:
The command was not issued or didn't take effect:
The event monitor was created but never started:
`db2batch` was run in background or via script that doesnt inherit accounting info. 5. **Previous stale data or corrupted event monitor state.
During `db2batch` Execution
Make sure the SQL file has this line at the top:
1. Check if monitor is running:
2. Verify if entries are generated:
4. Recreate the event monitor under a new name:
Cleanup and Reset Instructions
1. Disable monitor:
Alternative: Use `db2caem`
You may use `db2caem` for simpler diagnostics:
Additional Tips
* Always verify `section_actuals` setting before execution:
References
* How to collect section actuals on DB2 workgroup edition
* DB2 support collection commands
* IBM Engineering Lifecycle - Statistics Best Practices
worksError: SQL0601N The name of the object to be created is identical to the existing name "SYSTOOLS.EXPLAIN_INSTANCE" of type "TABLE". SQLSTATE=42710
To upgrade the explain tables please run the following command.
and then check the EXPLAIN_FROM_SECTION procedure.
If the old data is not important, then you may consider How to create and remove explain tables.
If neither approach is successful, run
There is a DOORS Next must gather for performance issues which should be used in conjunction with this guide. ELM Support troubleshoot use cases which are regarding slow performance and typically do not start with Db2 symptoms. It is imperative when investigating a DB2 performance, such as 100% CPU, that you collect ELM-specific data too so that you clarify whether the root cause is ELM or database related.
In order to diagnose a long-running SQL statement on DB2 we need to gather the following:
- A Db2mon report.
- The explain plan of any long running queries found in the report.
- If possible, the explain plan with row actuals for any long-running queries
- db2support files.
Db2Mon output via repodebug
As of 7.0.2 ifix 15 (SR1) and 7.0.1 ifix 18, it is possible to capture the data that is used by db2batch. Collecting Db2 section actuals using repodebug. This assumes that you have setup the repodebug option within DOORS Next, but also other Jazz applications, Engineering Workflow Management and Engineering Test Management.Db2Mon report
The db2mon script is a created on top of the SQL monitoring interfaces provided by DB2 LUW It monitors database activity for a set amount of time ( default = 30 seconds ) and provides various metrics in a detailed report section as the output. The monitor report provides several valuable bits of information, including:- Database throughput
- Analysis of processing time
- Analysis of time spent waiting by the database
- Top SQL statements by execution time
Running Db2Mon (Linux)
Db2mon needs to be run using the db2 administrator:- 1 cd to the directory where the db2mon is installed.
- 2 Run "db2 connect to DB_Name" where DB_Name is the required database.
- 3 Run "db2 flush package cache dynamic" To clear the cache.
- 4 Run "./db2mon.sh DB_Name >> report.out".
- 5 Repeat /db2mon.sh DB_Name >> report.out" command 3 to 5 times in a row, so that we'll have a collection of a few datapoints gathered together.
Running Db2Mon (Windows)
Download db2mon script tar file for your db2 version, say 'DB2 v11.1' and extract on the system where you will collect.- 1 cd to the directory where the db2mon is installed (where 'db2mon.sql' is located).
- 2 Create a new file 'db2mon.cmd' with the following code.
set DBNAME=%1
db2 -v connect to %DBNAME%
db2 -v create bufferpool db2monbp
db2 -v create user temporary tablespace db2montmptbsp bufferpool db2monbp
db2 +c -tvf db2mon.sql
db2 -v commit work
db2 -v connect reset
db2 -v connect to %DBNAME%
db2 -v drop tablespace db2montmptbsp
db2 -v drop bufferpool db2monbp
db2 -v connect reset
- 3 Open a CMD window and cd to the directory where 'db2mon.cmd' exists
- 4 Run the following command to set the DB2 command line (DB2CLP) variable: db2cmd -i -w db2clpsetcp
- 5 Type echo %DB2CLP% to confirm the DB2CLP variable has been set correctly, This should now show: DB20FADE
- 6 Run the db2mon command: db2mon.cmd dbname > report.out Example: (C:\dbmon\v111>db2mon.cmd RM702 > report.out)
- 7 In report.out search for "REPORT STARTS HERE" this is where the report starts.
Analyzing the report output
In the report.out there are 2 sections to check- Currently executing SQL at start of capture/Currently executing SQL at end of capture
- Top SQL statements by execution time
Currently executing SQL at start of capture / Currently executing SQL at end of capture
Please note that there can be multiple queries captured in this section. Check the "ELAPSED_TIME_SEC", if the time is longer than a few seconds it indicates a possible query issue. The example below shows a query running for 28 seconds and has not yet completed:
================================================================
 Currently executing SQL at end of capture (non-zero metrics only)
================================================================

with mon as (select ts, count, coord_member,application_handle,uow_id,activity_id,elapsed_time_sec,total_cpu_time,rows_read,direct_reads,direct_writes,executable_id,package_name,section_number,active_sorts,active_sorts_top,active_sort_consumers,active_sort_consumers_top,sort_shrheap_allocated,sort_shrheap_top,post_threshold_sorts,post_shrthreshold_sorts,post_threshold_hash_joins,post_shrthreshold_hash_joins,post_threshold_hash_grpbys,post_threshold_olap_funcs,total_act_time,total_act_wait_time,lock_wait_time,pool_read_time,direct_read_time,direct_write_time,fcm_recv_wait_time,fcm_send_wait_time,total_extended_latch_wait_time,log_disk_wait_time,cf_wait_time,reclaim_wait_time,spacemappage_reclaim_wait_time,stmt_text from mon_current_sql_plus_end ) select t.metric "Metric", t.value "Value" from mon, table( values ('COORD_MEMBER',varchar(coord_member)), ('STMT_TEXT', cast(substr(stmt_text,1,120) as varchar(120))), ('EXECUTABLE_ID', 'x'''||hex(executable_id)||''''), ('PACKAGE_NAME', package_name || '    (Section '||cast(section_number as varchar(10))||')'), ('Partition count', varchar(count)), ('APPLICATION_HANDLE',varchar(application_handle) || '  (UOW_ID '||cast(uow_id as varchar(8))||', ACTIVITY_ID '||cast(activity_id as varchar(8))||')' ), ('ELAPSED_TIME_SEC',varchar(elapsed_time_sec)), ('TOTAL_CPU_TIME',varchar(total_cpu_time)), ('ROWS_READ',varchar(rows_read)), ('DIRECT_READS',varchar(direct_reads)), ('DIRECT_WRITES',varchar(direct_writes)), ('ACTIVE_SORTS',varchar(active_sorts)), ('ACTIVE_SORTS_TOP',varchar(active_sorts_top)), ('ACTIVE_SORT_CONSUMERS',varchar(active_sort_consumers)), ('ACTIVE_SORT_CONSUMERS_TOP',varchar(active_sort_consumers_top)), ('SORT_SHRHEAP_ALLOCATED',varchar(sort_shrheap_allocated)), ('SORT_SHRHEAP_TOP',varchar(sort_shrheap_top)), ('POST_THRESHOLD_SORTS',varchar(post_threshold_sorts)), ('POST_SHRTHRESHOLD_SORTS',varchar(post_shrthreshold_sorts)), ('POST_THRESHOLD_HASH_JOINS',varchar(post_threshold_hash_joins)), ('POST_SHRTHRESHOLD_HASH_JOINS',varchar(post_shrthreshold_hash_joins)), ('POST_THRESHOLD_HASH_GRPBYS',varchar(post_threshold_hash_grpbys)), ('POST_THRESHOLD_OLAP_FUNCS',varchar(post_threshold_olap_funcs)), ('Pct wait times', 'Total: '      || cast(case when total_act_time > 0 then smallint( (total_act_wait_time / double(total_act_time)) * 100 ) else 0 end as varchar(5)) || '   Lock: '    || cast(case when total_act_time > 0 then smallint( (lock_wait_time / double(total_act_time)) * 100 ) else 0 end as varchar(5)) || '   Pool rd: ' || cast(case when total_act_time > 0 then smallint( (pool_read_time / double(total_act_time)) * 100 ) else 0 end as varchar(5)) || '   Dir IO: '  || cast(case when total_act_time > 0 then smallint( ((direct_read_time+direct_write_time) / double(total_act_time)) * 100 ) else 0 end as varchar(5)) || '   FCM: '     || cast(case when total_act_time > 0 then smallint( ((fcm_recv_wait_time+fcm_send_wait_time) / double(total_act_time)) * 100 ) else 0 end as varchar(5)) || '   Latch: '   || cast(case when total_act_time > 0 then smallint( (total_extended_latch_wait_time / double(total_act_time)) * 100 ) else 0 end as varchar(5)) || '   Log: '     || cast(case when total_act_time > 0 then smallint( (log_disk_wait_time / double(total_act_time)) * 100 ) else 0 end as varchar(5)) || '   CF: '      || cast(case when total_act_time > 0 then smallint( (cf_wait_time / double(total_act_time)) * 100 ) else 0 end as varchar(5)) || '   Reclaim: ' || cast(case when total_act_time > 0 then smallint( ((reclaim_wait_time+spacemappage_reclaim_wait_time) / double(total_act_time)) * 100 ) else 0 end as varchar(5)) ), (cast(repeat('-',32) as varchar(32)),cast(repeat('-',120) as varchar(120))) ) as t(metric,value) where t.metric = 'COORD_MEMBER' or t.value <> '0' order by elapsed_time_sec desc with UR

Metric                           Value
-------------------------------- --------------------------------------------------------------------------------------------------------------------------------------------------------
COORD_MEMBER                     0
STMT_TEXT                        with ctx(ctx_uuid) as ( select CTX_SUB.CONTEXT_UUID from REPOSITORY.CONTEXT_SUBCONTEXTS CTX_SUB union select CTX_MEMB2.C
EXECUTABLE_ID                    x'0100000000000000250800000000000000000000020020210403101135761558'
PACKAGE_NAME                     SYSSH200    (Section 1)
Partition count                  1
APPLICATION_HANDLE               2505  (UOW_ID 6249, ACTIVITY_ID 1)
ELAPSED_TIME_SEC                 28
TOTAL_CPU_TIME                   2320751
ROWS_READ                        868292
ACTIVE_SORTS                     1
ACTIVE_SORTS_TOP                 1
ACTIVE_SORT_CONSUMERS            5
ACTIVE_SORT_CONSUMERS_TOP        5
SORT_SHRHEAP_ALLOCATED           295
SORT_SHRHEAP_TOP                 1424
Pct wait times                   Total: 5   Lock: 0   Pool rd: 0   Dir IO: 0   FCM: 0   Latch: 0   Log: 0   CF: 0   Reclaim: 0
Keep note of the EXECUTABLE_ID "x'0100000000000000250800000000000000000000020020210403101135761558'" as this can be used to obtain the explain plan.
Top SQL statements by execution time
This section covers queries that finished executing and are stored in the package cache. The list is sorted by "COORD_STMT_EXEC_TIME", but we are actually interested in the "AVG_COORD_EXEC_TIME" (milliseconds)====================================== Top SQL statements by execution time ====================================== select member, count(*) num_stmts, integer(num_exec_with_metrics) total_exec, sum(coord_stmt_exec_time, MEMBER NUM_STMTS TOTAL_EXEC COORD_STMT_EXEC_TIME AVG_COORD_EXEC_TIME PCT_COORD_STMT_EXEC_TIME TOTAL_CPU_TIME -------- -------------------- ------------------- -------------- ------------ ------------- ---------------------------------------------- 0 1 4 1729 432.25 29.89 0 1 1 2526 2526.00 50.18 0 1 5 1832 366.40 31.04So find the largest "AVG_COORD_EXEC_TIME" 2526.00 in the example above and then navigate to the section Statement & plan identifiers - top statements by execution time, this is again sorted in the same order as before so you can find and take note of the EXECUTABLE_ID to gather the explain plan.
Explain plan
An execution plan shows the detailed steps necessary to execute a SQL statement. The steps are expressed as a set of database operators that produce and consume rows. Get the explain plan by using the EXECUTABLE_ID (do NOT leave out the character x) as gathered from the db2mon report and add it to the command below:
db2 "CALL EXPLAIN_FROM_SECTION(x'0100000000000000250800000000000000000000020020210403101135761558', 'M', NULL, 0, NULL, ?, ?, ?, ?, ?)"
Followed by:
db2exfmt -d <DB_Name> -1 -o /tmp/Explain_test.txt
We can also obtain the bind variables from the queries by running the following command
db2 "export to output.txt of del messages test select XMLPARSE(DOCUMENT max_coord_stmt_exec_time_args) FROM TABLE(MON_GET_PKG_CACHE_STMT(NULL,x'0100000000000000250800000000000000000000020020210403101135761558',NULL,-1))"
This generates an xml file called output.txt.001.xml which contains the set of parameters used in the query.
Automating the db2mon data gathering
If the DB2 server is installed on Linux, instead of manually running db2mon and collecting EXPLAIN PLANs, an alternative way is provided to automate the whole process. We have a shell script db2mon_auto_v2.sh, which can be found at the bottom of the article, that wraps around db2mon and does post processing. The script will run db2mon multiple times, then generates the EXPLAIN PLANs as well as binding parameter input files for the hotspot queries captured.Prerequisites
- copy the wrapper script db2mon_auto_v2.sh to the same directory that contains db2mon.sh, user to execute the script must have read and write permission to this directory
- db2 EXPLAIN tables must be created. if not yet, run the following commands as db2 administrator
db2 connect to <dbname> db2 "CALL SYSPROC.SYSINSTALLOBJECTS('EXPLAIN', 'C', CAST (NULL AS VARCHAR(128)), CAST (NULL AS VARCHAR(128)))" - test db2mon.sh and make sure it runs properly alone: ./db2mon.sh
> report.out. Look for errors in report.out and fix them prior to running the wrapper script
Usage
Issue command as db2 administrator:./db2mon_auto_v2.sh <dbname> <number_of_db2monCalls>For example, to run db2mon.sh 5 times against database RMDB:
./db2mon_auto_v2.sh RMDB 5where number_of_db2monCalls is an integer; we recommend to use a value between 3 and 10
Output files
The script finishes in a few minutes depending on the number_of_db2monCalls specified in the command line. The output files will be generated under a newly created directory called report_db2mon%datetime% . A list of hotspot queries with their EXECUTABLE_IDs and stats will be written to the end of the report file.db2support files
db2support is a built in DB2 tool that collects all important DB2 configuration information as well as certain system catalogs relevant to the query optimizer. To run the tool, use the following command as db2 administratordb2support -d <dbname> -cl 0db2support will compress all information collected in a single zip file.
Getting explain plans with row actuals
The most useful bit of diagnostic information is an explain plan that shows the actual row counts processed by each step. Unfortunately, db2mon_auto only generates explain plans that include row estimates. You need to run through some additional steps to generate an explain plan that includes row actuals. If you are using Db2 11.1 workgroup edition, see the section below "How to collect section actuals on DB2 workgroup edition 11.1" for the steps to enable actuals. Here's an overview of the process:- Create EXPLAIN tables if you have not already done so.
- Identify any slow SQL statements of interest, and create a stand-alone text file for each statement that is compatible with db2batch. You may be able to get SQL statements from product log files. Otherwise, you'll need to use the db2mon_auto output.
- Enable the actuals_mon DB2 event monitor.
- Run the SQL statement using DB2 batch and generate the explain plan
- Optional: Disable the event monitor and drop diagnostic tables.
Creating db2batch-compatible files for slow SQL statements
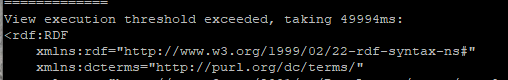
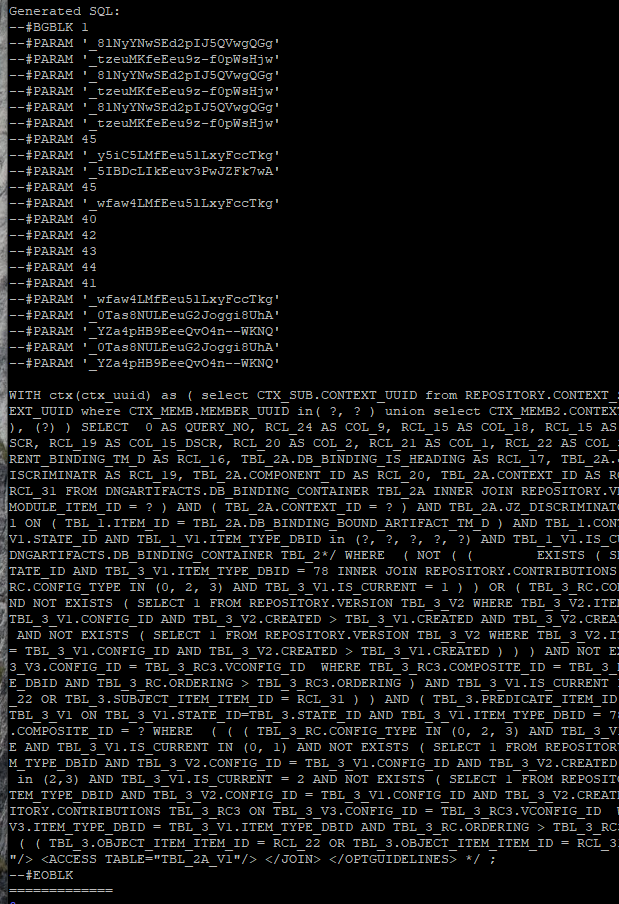
db2batch is a benchmarking tool that allows you to run SQL statements from a flat file and then collect performance information about the execution. In order to generate explain plans with row actuals, you'll need a structure similar to the one below:CALL SYSPROC.WLM_SET_CLIENT_INFO(NULL, NULL, NULL, 'actuals', NULL); --#BGBLK 1 ...PARAM statements that declare values of bind parameters query with params ; --#EOBLKThe call to WLM_SET_CLIENT_INFO creates the association between the event monitor for actuals and the SQL statement to be executed. The SQL statement itself is placed between --#BGBLK 1 and --#EOBLK tags. If the SQL statement contains bind parameters (e.g. question marks in the SQL), then you must define values for each of the bind parameters using --#PARAM directives (these are placed after the #BGBLK directive but before the SQL statement). You can get more information about the format expected by db2batch by referring to the DB2 documentation. Most SQL statements issued from the ELM products use bind parameters, and it can be tricky to extract out the values of the bind parameters in order to create a db2batch-compatible file. There are a couple of ways to do this. First, for DOORS Next Generation, you can check the product log files (rm.log). The view service will log slow SQL automatically if a statement runs for longer than a specified threshold (configurable in rm/admin Advanced Properties). The log file will contain the SQL (with PARAM statements for any bind variable as well as the #BGBLK and #EOBLK directorives). You can just copy the relevant section of the log into a file and then add in the WLM_SECT_CLIENT_INFO call at the top. Look for occurences of #BGBLK in rm.log:
.....
You can also enable diagnostic logging in DOORS Next Generation by editing conf/rm/log4j2.xml and adding in the following line:
<Logger name="com.ibm.rdm.fronting.server.rrs.views.execution.sql.internal.run.DirectSqlExecutor" level="DEBUG"/>Note that from 7.1.0 version, the logger name has been changed to
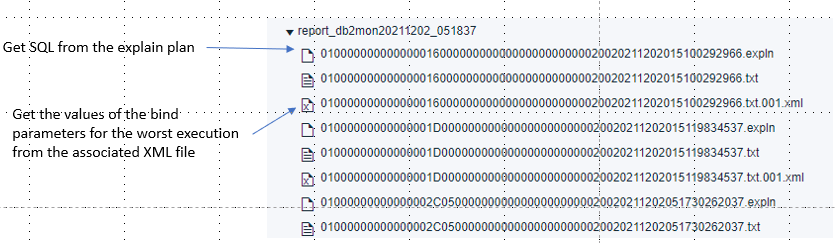
<Logger name="com.ibm.rdm.jafquery.internal.DirectSqlQueryService" level="DEBUG"/>The DEBUG level logging will log SQL generated by DNG in db2batch-compatible form, so you can just copy the relevant sections out of rm.log and paste them into a stand-alone file. Note that the logging applies only to SQL generated by DNG. It will not log slow SQL that is generated by Jazz Foundation or other applications. In that case, you'll need to get the bind parameters from the db2mon_auto output. db2mon_auto generates explain plans without row actuals, but you can extract the SQL statement from the .expln file. You can also get the values of the bind parameters for the longest execution from the XML file generated for the SQL statement.
Each bind parameter will have a value in the XML file, similar to this:
<stmt_value_data>_ldLMIFMoEeyE0fLvzO5lDQ</stmt_value_data>For each
Enabling the actuals_mon event monitor
Run the following commands to set up the DB2 event monitoring for gathering row actuals:
db2 connect to <RMDB>
db2 update database configuration using section_actuals base
db2 create event monitor actuals_mon for activities write to table
db2 set event monitor actuals_mon state 1
db2 "create workload actuals current client_acctng('actuals') collect activity data with details,section"
db2 "grant usage on workload actuals to public"
Running the SQL statement using DB2 batch and generating explain plans
Note Run these commands in the foreground not background. Run the following commands to execute the SQL via db2batch and then generate an explain plan. To run the SQL:db2batch -d <RMDB> -f <query>.sql -i complete -o r 0 p 5 -r <query_exe_with_actuals>.out3Optionally, disable the event monitor (if you aren't planning to generate more explain plans):
db2 set event monitor actuals_mon state 0Next, get the application id for the statement that was just executed:
db2 "SELECT a.time_completed, Substr(appl_name, 1, 20) appl_name, Substr(a.appl_id, 1, 28) appl_id, a.uow_id, a.activity_id, Length(a.section_actuals) act_len, Substr(s.stmt_text, 1, 50) stmt FROM activity_actuals_mon a, activitystmt_actuals_mon s WHERE a.appl_id = s.appl_id AND a.uow_id = s.uow_id AND a.activity_id = s.activity_id"Next, generate the explain plan. Use the values of *LOCAL.db2inst1.xxxxx (dont leave out the * as a valid character), 2, and 1, from the output of the previous step.
db2 "CALL EXPLAIN_FROM_ACTIVITY( '*LOCAL.db2inst1.210308171806', 2, 1, 'ACTUALS_MON', '', ?, ?, ?, ?, ? )"Finally, generate the explain plan. This should include row actuals.
db2exfmt -d <RMDB> -1 -o actual.explnTo verify that you have the row actuals, look in the .expln file and check for the "Rows Actual" entry:
    Rows
    Rows Actual
    RETURN
    (   1)
    Cost
    I/O
Optional: Disabling the event monitor and cleaning up
After you are done generating explain plans, you can optionally disable the event monitor and clean up:db2 set event monitor actuals_mon state 0; db2 ALTER workload actuals disable; db2 DROP workload actuals; db2 DROP TABLE ACTIVITYMETRICS_ACTUALS_MON; db2 DROP TABLE ACTIVITYSTMT_ACTUALS_MON; db2 DROP TABLE ACTIVITYVALS_ACTUALS_MON; db2 DROP TABLE ACTIVITY_ACTUALS_MON; db2 DROP TABLE CONTROL_ACTUALS_MON; db2 drop event monitor actuals_mon;
How to collect section actuals on DB2 workgroup edition 11.1
Db2 workgroup edition 11.1 will return the following error code when attempting to use the above methods for obtaining the actual values:SQL8029N A valid license key was not found for the requested functionality. Reference numbers: 7In order to work around this issue, see WebSphere technote How to collect section actuals on DB2 workgroup edition.
Other useful Db2 commands:
To gather DB2 parameters and their current values use the following command :
db2 get database configuration for <dbname>
To monitor Tablespaces, Transaction logs, No of reads/update/writes, Memory used and heap size the Command below will run 12 times (Every 5 minutes), so will generate 1 hour of monitoring.
db2pd -d <dbname> -tablespaces -logs -tcbstat-transactions -dyn-rep 12 300 > db2pd.mon.out
db2support - Problem analysis and environment collection tool command
db2support . -d <dbname> -s
Note: These next commands require the actual SQL of the long running query top run:
The Db2batch command captures the actual timings and other metrics as the query you are testing is running:
db2batch -d dbname -f file.sql > file_sql.out
The Db2 Design Advisor is a tool that can help you significantly improve your workload performance. It identifies all of the objects that are needed to improve the performance of your workload. You can either run the command by passing in the query or by using a File containing the SQL:
db2advis -d dbname -n schemaname -s "sql_statement" > db2advis.out
or
db2advis -d dbname -n schemaname -i file.sql > db2advis.out
The db2caem command can be used to execute a poorly performing query and gather formatted explain output that includes section actuals showing the actual number of rows processed by each operator in the access plan.
db2caem -d dbname -st "sql text goes here"
Troubleshooting: DB2 Section Actuals Event Monitor (`actuals_mon`) Not Capturing Data
After running a query using `db2batch` with the `actuals_mon` event monitor enabled, you may not see the executed SQL captured in the `ACTIVITY_ACTUALS_MON` and related tables.Symptoms
* No entries in `ACTIVITY_ACTUALS_MON` or `ACTIVITYSTMT_ACTUALS_MON` after running `db2batch`* `section_actuals` length appears as 0
* `EXPLAIN_FROM_ACTIVITY` call fails with missing application ID or activity
Root Causes
1. Workload not associated correctly:The client accounting string must be set to `'actuals'` to match the workload created.
2. section_actuals not enabled:
The command was not issued or didn't take effect:
db2 update db cfg using section_actuals base3. Monitor not started:
The event monitor was created but never started:
db2 set event monitor actuals_mon state 14. Execution done in background:
`db2batch` was run in background or via script that doesnt inherit accounting info. 5. **Previous stale data or corrupted event monitor state.
Checklist Before Execution
db2 connect to <your_database>
db2 update db cfg using section_actuals base
db2 create event monitor actuals_mon for activities write to table
db2 set event monitor actuals_mon state 1
db2 "create workload actuals current client_acctng('actuals') collect activity data with details,section"
db2 "grant usage on workload actuals to public"
During `db2batch` Execution
Make sure the SQL file has this line at the top:
CALL SYSPROC.WLM_SET_CLIENT_INFO(NULL, NULL, NULL, 'actuals', NULL)Then run:
db2batch -d <dbname> -f query.sql -i complete -o r 0 p 5 -r out.log
If No Data Captured in `actuals_mon` , then try the following steps:
1. Check if monitor is running:
db2 "select evmonname, status from syscat.eventmonitors"Ensure `STATUS = STARTED`
2. Verify if entries are generated:
db2 "select count(*) from ACTIVITY_ACTUALS_MON"
db2 "select count(*) from ACTIVITYSTMT_ACTUALS_MON"3. Check section length:
db2 "select appl_id, activity_id, length(section_actuals) from ACTIVITY_ACTUALS_MON order by time_completed desc fetch first 5 rows only"A `0` indicates section data wasn't collected. Validate the `section_actuals` setting again.
4. Recreate the event monitor under a new name:
db2 drop event monitor actuals_monthen recreate with new name actuals_mon_test.
db2 "create event monitor actuals_mon_test for activities write to table manualstart"Note: Please make sure to use the actuals_mon_test name when activiting the event monitor
Cleanup and Reset Instructions
1. Disable monitor:
db2 set event monitor actuals_mon state 02. *Drop monitor and tables (if needed)*:
db2 drop event monitor actuals_mondrop related tables if no longer needed
Alternative: Use `db2caem`
You may use `db2caem` for simpler diagnostics:
db2caem -d <dbname> -f query.sql -o myCAEMoutIt collects section actuals and formatted explain in one step.
Additional Tips
* Always verify `section_actuals` setting before execution:
db2 get db cfg | grep section_actuals* Do not rely on package cache for freshly run explain from activity capture quickly after execution.
References
* How to collect section actuals on DB2 workgroup edition
* DB2 support collection commands
* IBM Engineering Lifecycle - Statistics Best Practices
Known Issues when Gathering Explain Plans with Actuals:
SQL0601N The name of the object to be created is identical to the existing name
This error was experienced by db2mon after upgrading Db2 from 11.1 to 11.5.7, affecting the above db2mon_auto.sh script. db2 "CALL SYSPROC.SYSINSTALLOBJECTS('EXPLAIN', 'C', CAST (NULL AS VARCHAR(128)), CAST (NULL AS VARCHAR(128)))"worksError: SQL0601N The name of the object to be created is identical to the existing name "SYSTOOLS.EXPLAIN_INSTANCE" of type "TABLE". SQLSTATE=42710
To upgrade the explain tables please run the following command.
db2exmig -d RM -e db2inst1
and then check the EXPLAIN_FROM_SECTION procedure.
If the old data is not important, then you may consider How to create and remove explain tables.
If neither approach is successful, run
db2 list tables for all |grep EXPLAINand contact IBM Db2 Support.
Error 500 Internal when running actuals collection
This issue will also apply if your tables for RM were created as a different user to the DB instance, HTTP Error 500: Internal Server Error while clicking on "RE-EXECUTE AND COLLECT ACTUALS"References:
- Db2Mon
- db2 data collection tool
- db2batch
- db2advis
- db2pd
- db2caem
- db2eximg
- How to troubleshoot query parameter markers using section actuals
Related topics: Performance sizing guides and datasheets, Disk benchmarking
External links:
Additional contributors: ShubjitNaik TadeuszJanasiewicz
- db2mon_auto_v2.sh: db2mon_auto_v2.sh


| I | Attachment | Action | Size | Date | Who | Comment |
|---|---|---|---|---|---|---|
| |
GenSQL.PNG | manage | 100.8 K | 2021-12-02 - 17:34 | VaughnRokosz | |
| |
ViewThresh.PNG | manage | 5.8 K | 2021-12-02 - 17:34 | VaughnRokosz | |
| |
db2monBinds.PNG | manage | 129.5 K | 2021-12-02 - 17:34 | VaughnRokosz | |
| |
db2mon_auto_v2.ksh | manage | 5.7 K | 2023-07-17 - 14:03 | VaughnRokosz | db2mon auto script to run on korn shell |
| |
db2mon_auto_v2.sh | manage | 5.6 K | 2021-06-15 - 15:49 | UnknownUser |
Contributions are governed by our Terms of Use. Please read the following disclaimer.
Dashboards and work items are no longer publicly available, so some links may be invalid. We now provide similar information through other means. Learn more here.