Collecting Section Actuals Using Repodebug
Authors: GaryJohnstonBuild basis: Engineering Lifecycle Management products 7.1.0, 7.0.3, 7.0.2SR1, 7.0.1 ifix 18
It is important that before starting an expensive investigation into Db2 performance that you ensure that the database statistics are up-to-date. See How often do the database statistics need to be updated when using IBM Engineering Lifecycle Management? to understand when they were last run and ensure they were updated within the last week, or since a large data change.
There is a DOORS Next must gather for performance issues which should be used in conjunction with this guide. ELM Support troubleshoot use cases which are regarding slow performance and typically do not start with Db2 symptoms. It is imperative when investigating a DB2 performance, such as 100% CPU, that you collect ELM-specific data too so that you clarify whether the root cause is ELM or database related.
The Db2MustGather describes how to generate query execution plans on DB2 and how to get the actual row counts for the operators in the execution plan manually. Since ELM 7.0.2 SR1, we streamlined the steps in the Db2MustGather in a way that better integrates with the SQL statement activity event monitoring provided by the queryStats page in the repodebug facility. This allows IBM Support and/or Development to more easily get DB2 query execution plans with actual row counts and cardinalities from ELM deployments without first having to manually construct standalone SQL files (including bind parameter values, etc.). Note: This article assumes that you have enabled repodebug. It is expected that you are using this article in conjunction with IBM Support for IBM Engineering Lifecycle Management (ELM). A DBA is expected to be assisting with the use of any additional monitoring output from Oracle, for example using the Oracle mustgather for SQL Monitor reports. A Db2 DBA may be required for the Using Db2 batch. Note: Much of this new functionality is available for all supported database types, not just DB2. Functionality available only for DB2 is marked [DB2 ONLY].
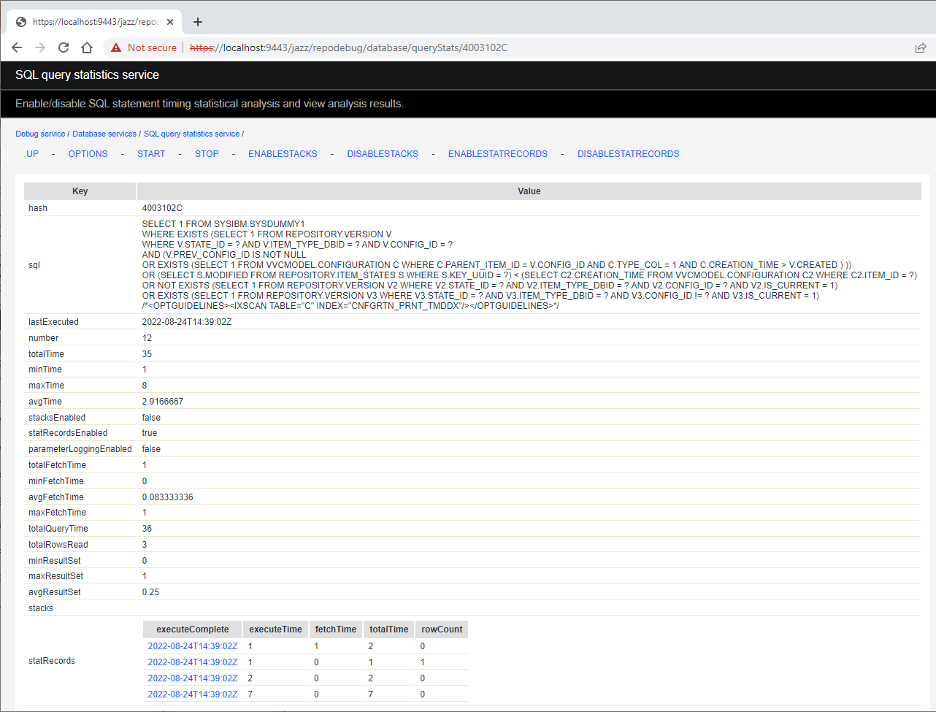 The statRecordsEnabled value indicates whether or not stat records are being collected for the query when it is executed.
The statRecords table summarizes the stat records that have been collected for the query. The table has the following columns:
The statRecordsEnabled value indicates whether or not stat records are being collected for the query when it is executed.
The statRecords table summarizes the stat records that have been collected for the query. The table has the following columns: 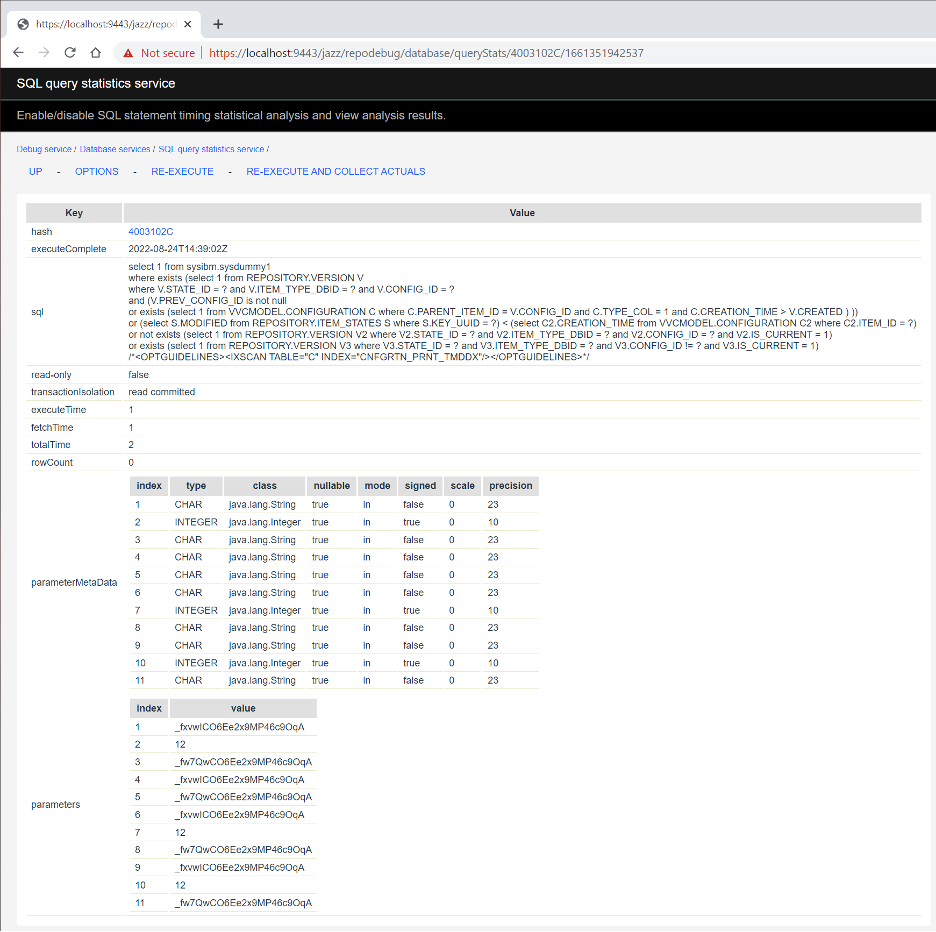 This page shows the stat record values that were collected for the query execution:
 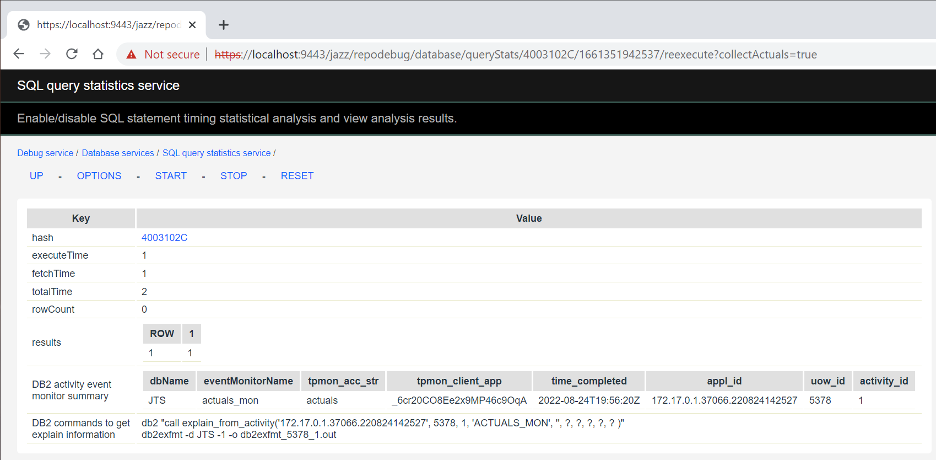 This page displays the results from re-executing the query with DB2 collecting section actuals for it.
The hash, executeTime, fetchTime, totalTime, and rowCount have the same meanings as elsewhere.
The DB2 activity event monitor summary row shows a summary of the information collected by the event monitor for the query execution.
The DB2 commands to get explain information row shows the two DB2 commands that can be executed (at a command prompt that is connected to the database) to generate a file containing the formatted query execution plan used for this execution of the statement, one that includes actual row counts and cardinalities (in addition to the estimates normally provided).
The intent is that the two commands can easily be copy & pasted to the command prompt to execute them.
This page displays the results from re-executing the query with DB2 collecting section actuals for it.
The hash, executeTime, fetchTime, totalTime, and rowCount have the same meanings as elsewhere.
The DB2 activity event monitor summary row shows a summary of the information collected by the event monitor for the query execution.
The DB2 commands to get explain information row shows the two DB2 commands that can be executed (at a command prompt that is connected to the database) to generate a file containing the formatted query execution plan used for this execution of the statement, one that includes actual row counts and cardinalities (in addition to the estimates normally provided).
The intent is that the two commands can easily be copy & pasted to the command prompt to execute them.
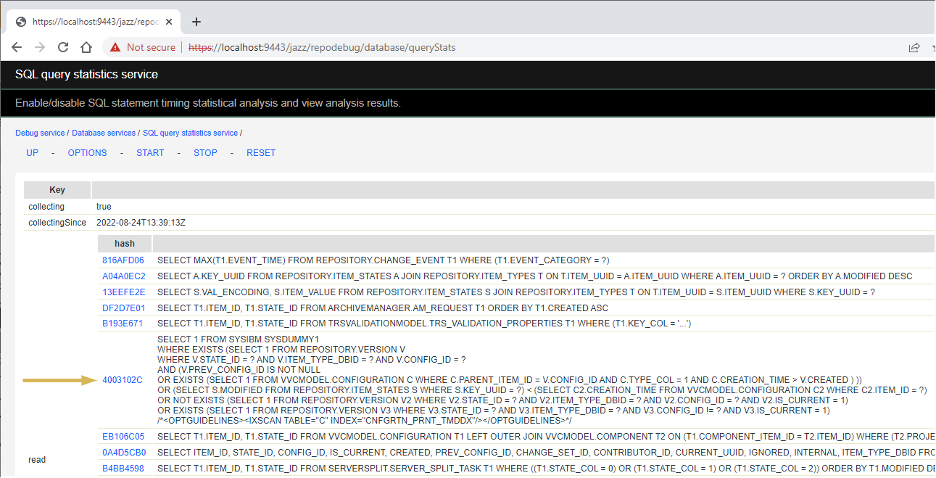
The query must be executed so that it shows up on this page. Perform (or have the customer perform) whatever action causes the query of interest to be executed. Then, refresh the queryStats page and find the query. Lets say were interested in the query whose hash is 4003102C.
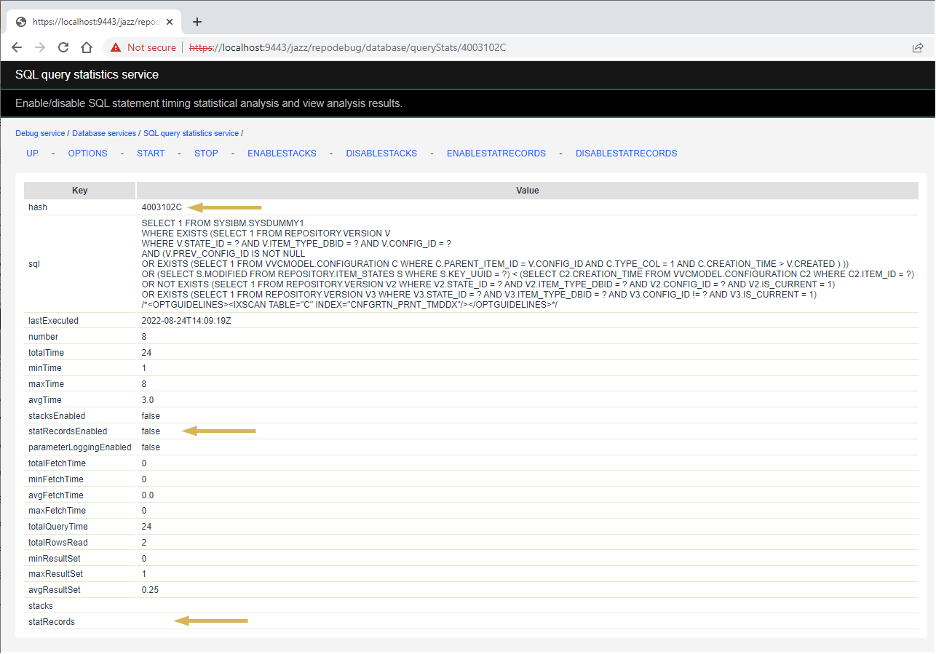
Enable the collection of stat records for the query as follows. (This is similar to enabling collecting stacks for a query.) Click on the hash value to get to the query stats details for the query. Initially, statRecordsEnabled will be false and there will be no statRecords.
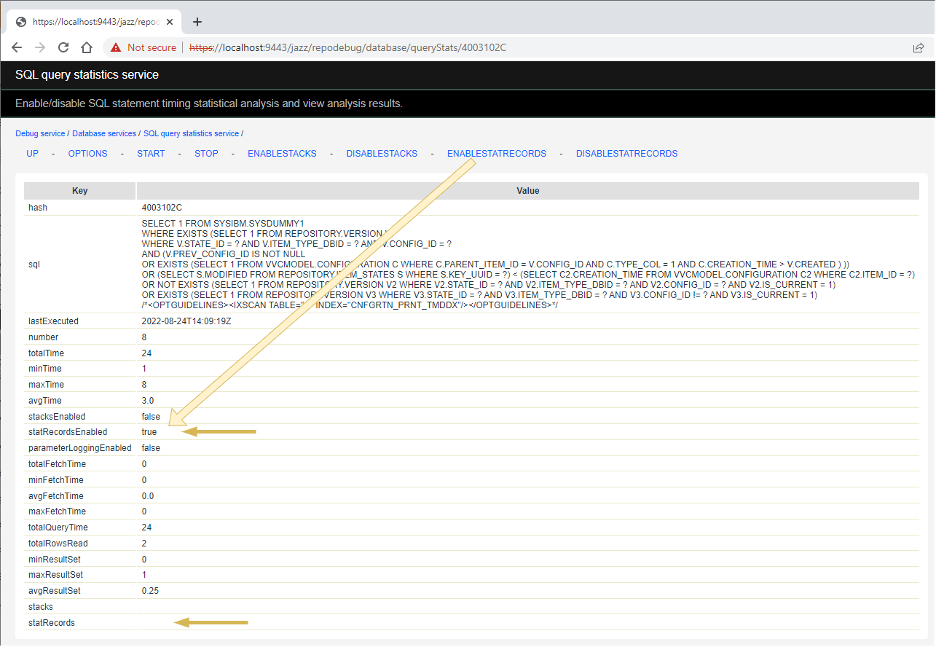
Click ENABLESTATRECORDS. Note that the value of statRecordsEnabled will change to true. But there will still be no statRecords because the query has not been executed since stat records were enabled just now.
Now, whenever this query executes, statRecords will be collected for it and be displayed on this page (when you refresh it). Cause the query to be executed again and refresh the page. The statRecords row will show (up to 10 of) the most recent executions of the query.
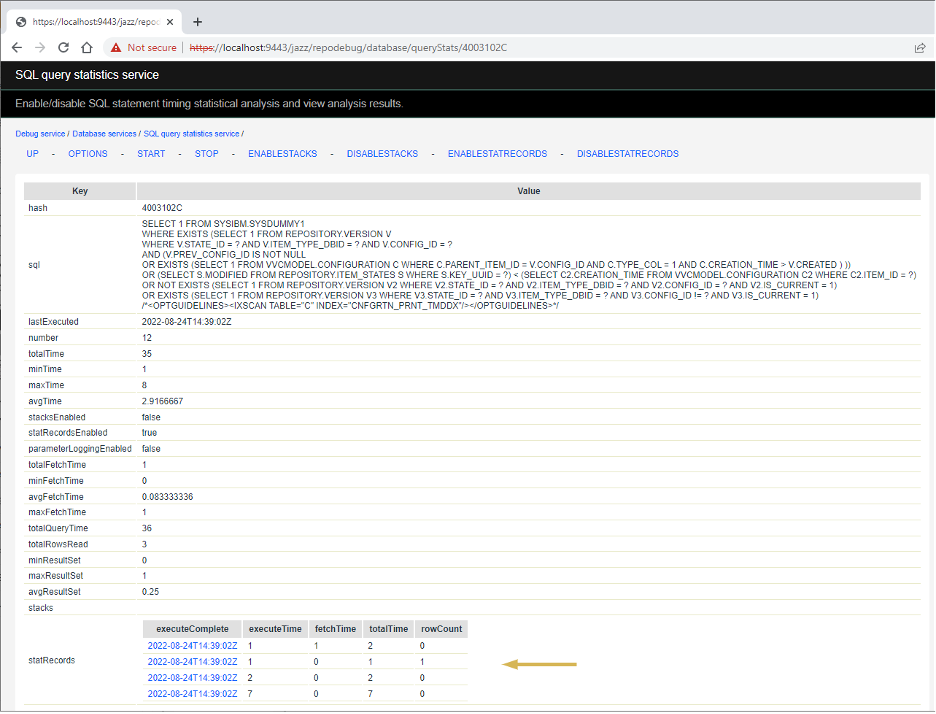
Click on one of the executeComplete timestamps to see that executions stat record.
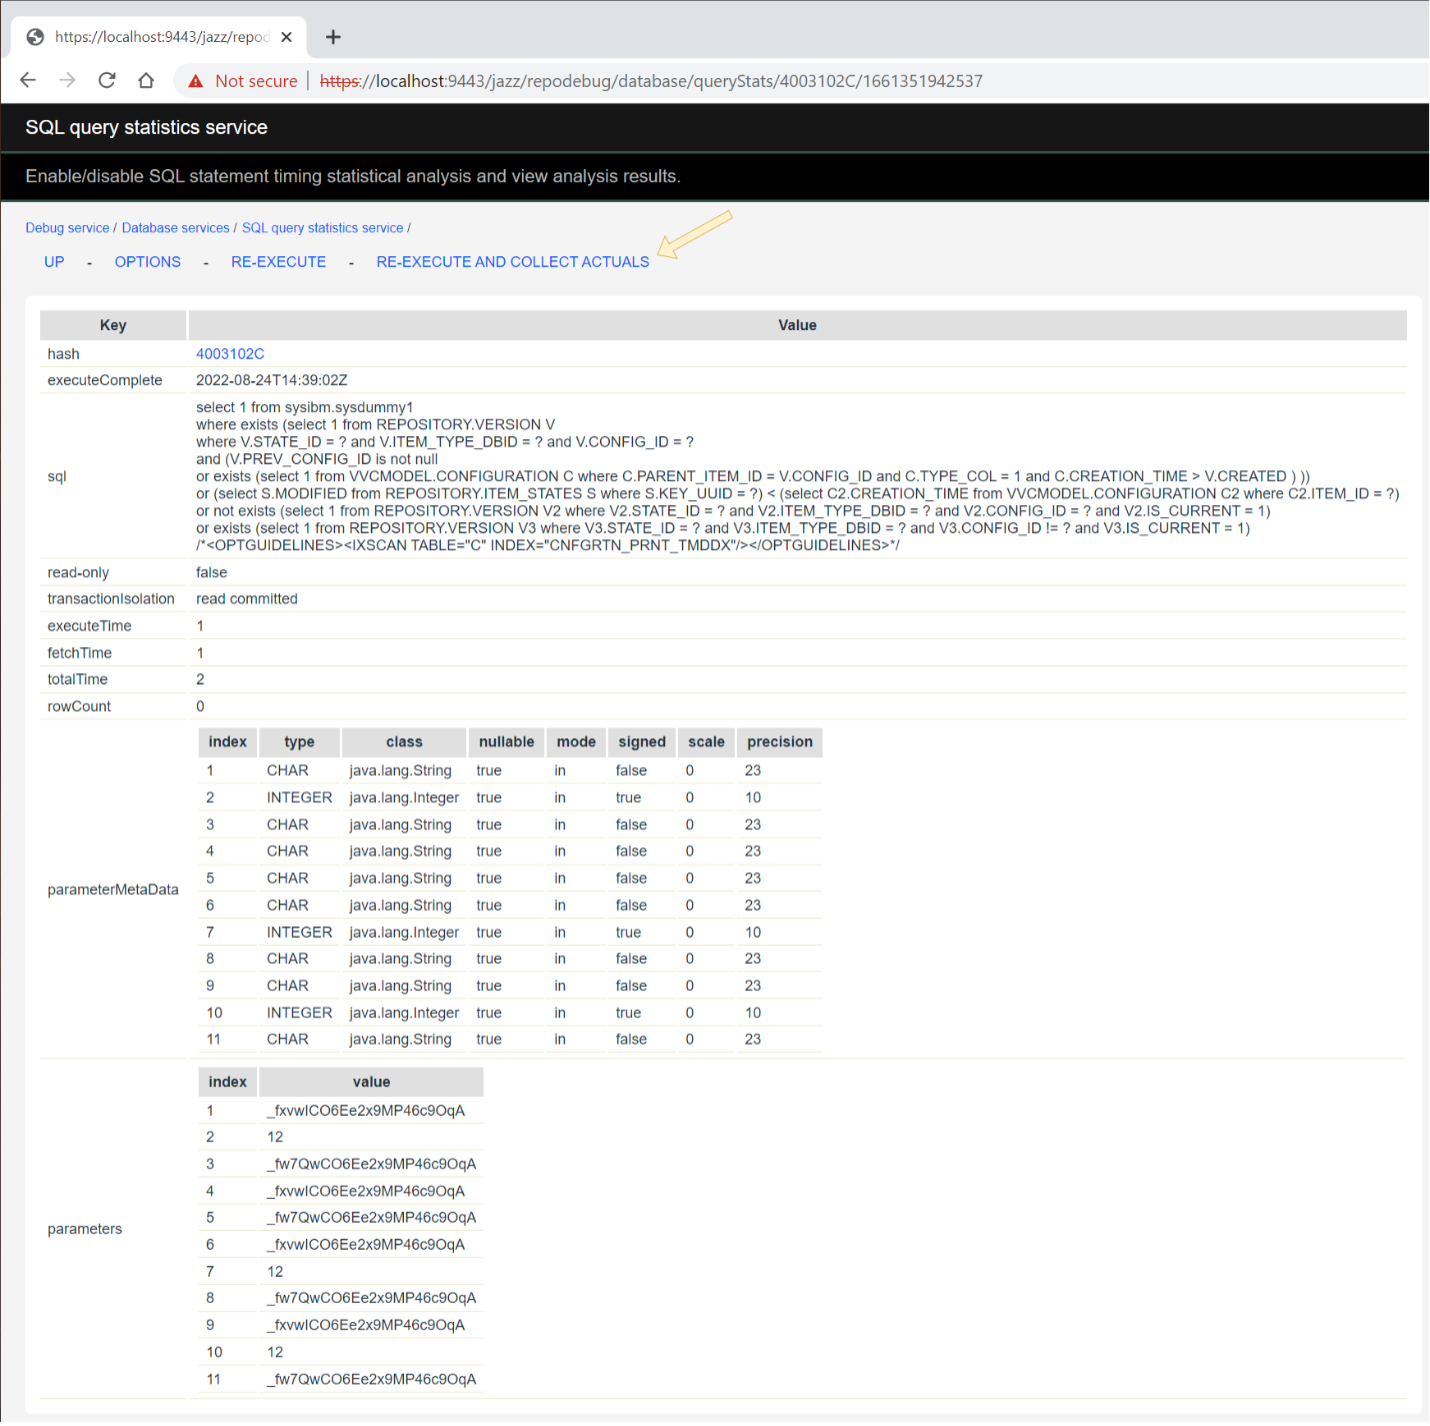
[DB2 ONLY] Click on RE-EXECUTE AND COLLECT ACTUALS. This will re-execute the query in such a way that a DB2 activity event monitor will have captured section actuals for the query, as well as the DB2 commands that you can execute to get a query explain plan that includes the actuals.
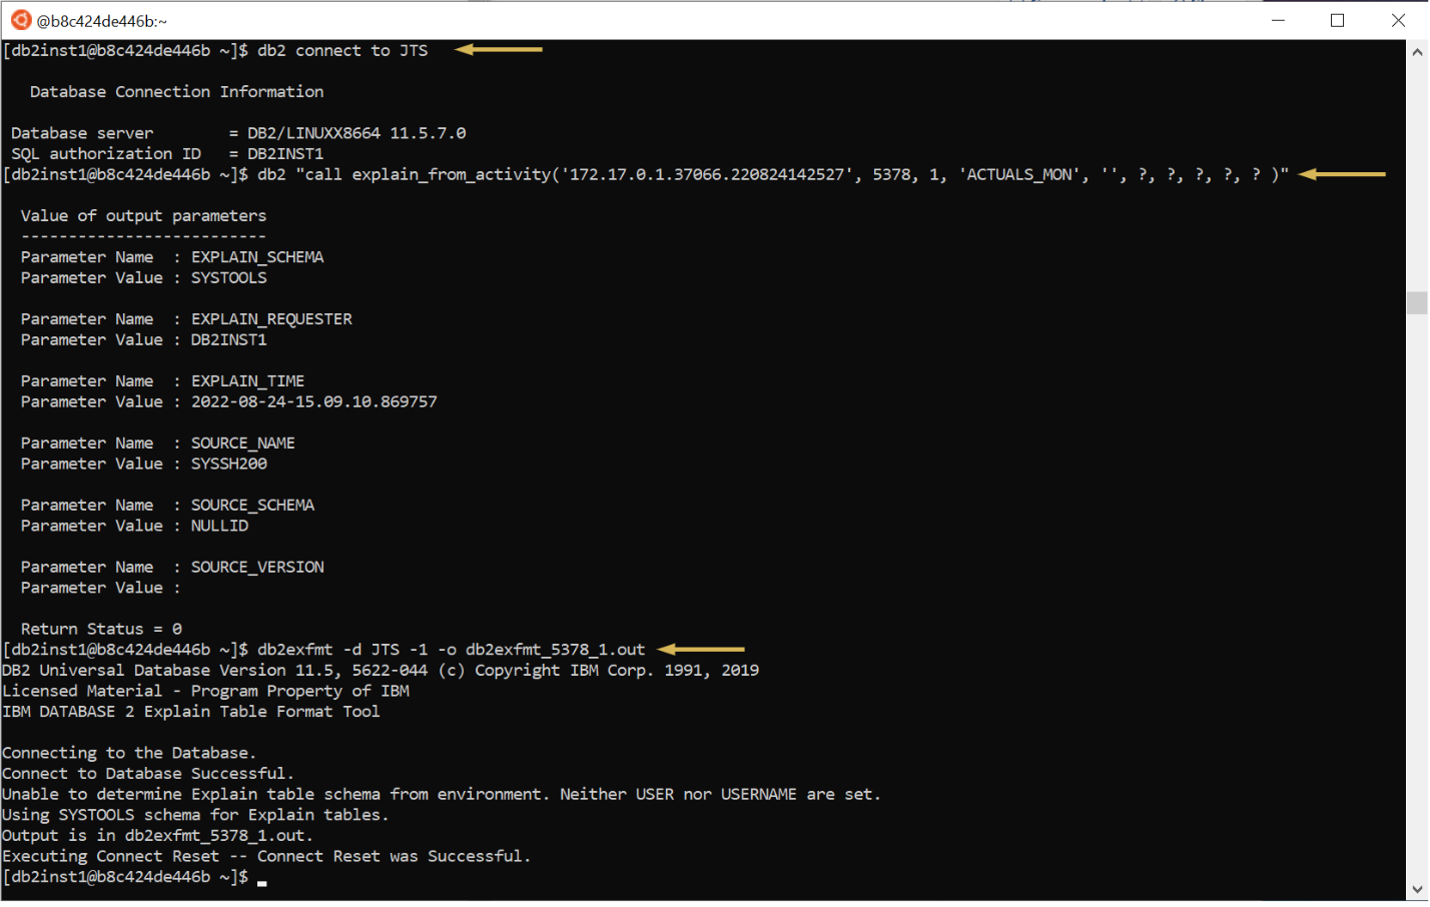
In a command prompt from which you can connect to the DB2 database (named JTS in this example), connect to the database and then execute each of the two commands shown in the DB2 commands to get explain information row.
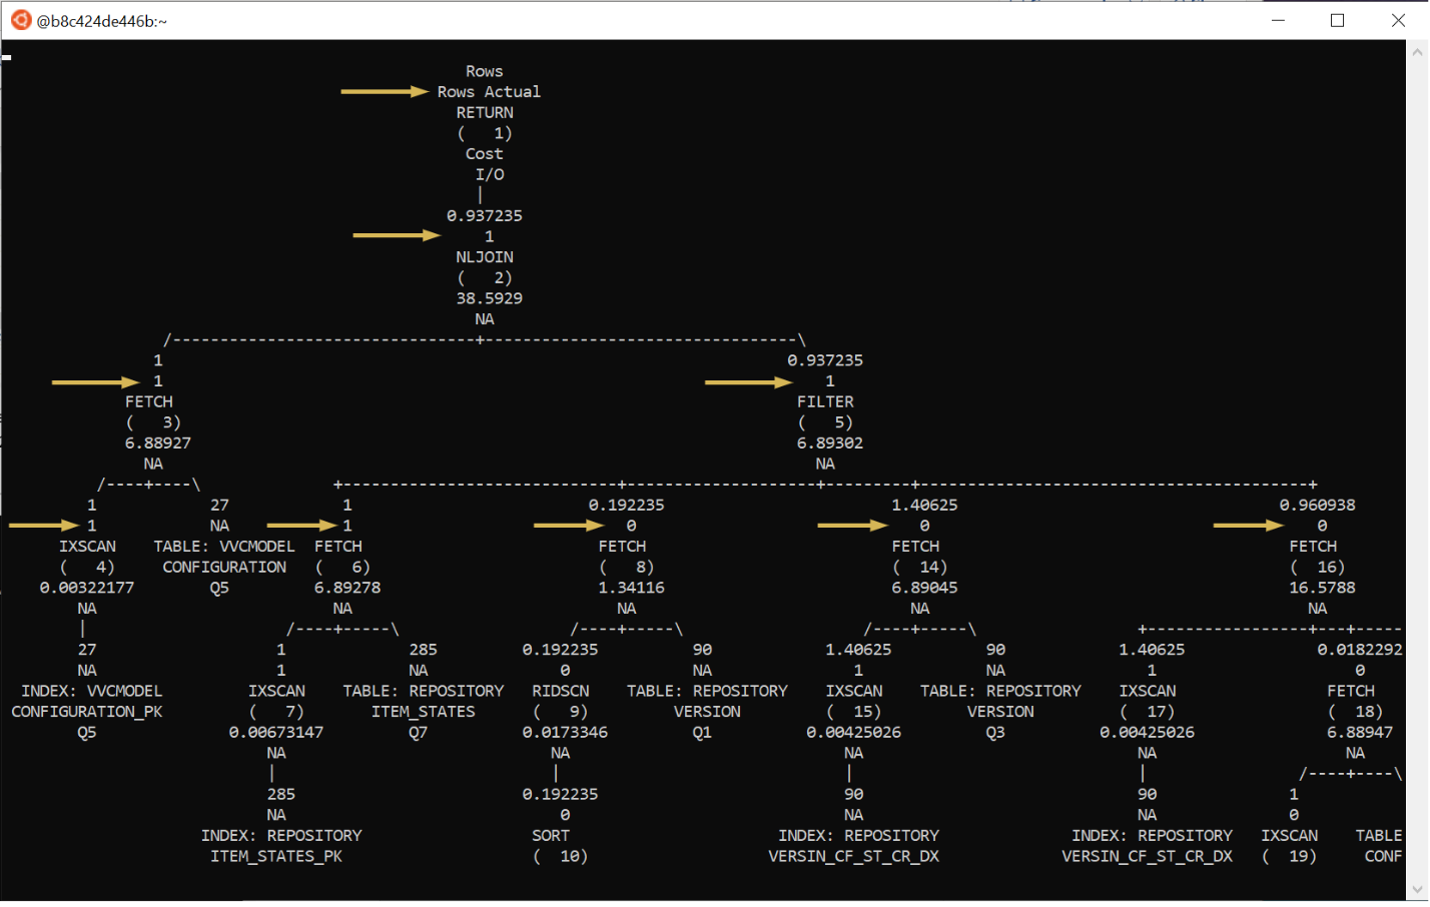
The resulting output file (db2exfmt_5378_1.out in this example) will contain the formatted query plan containing actual cardinalities and row counts (in addition to the estimates). For each node in the plan tree, the second row will show the actual row count or cardinality (which the following picture points out for just the first few levels).
HTTP Error 500: Internal Server Error while clicking on "RE-EXECUTE AND COLLECT ACTUALS"
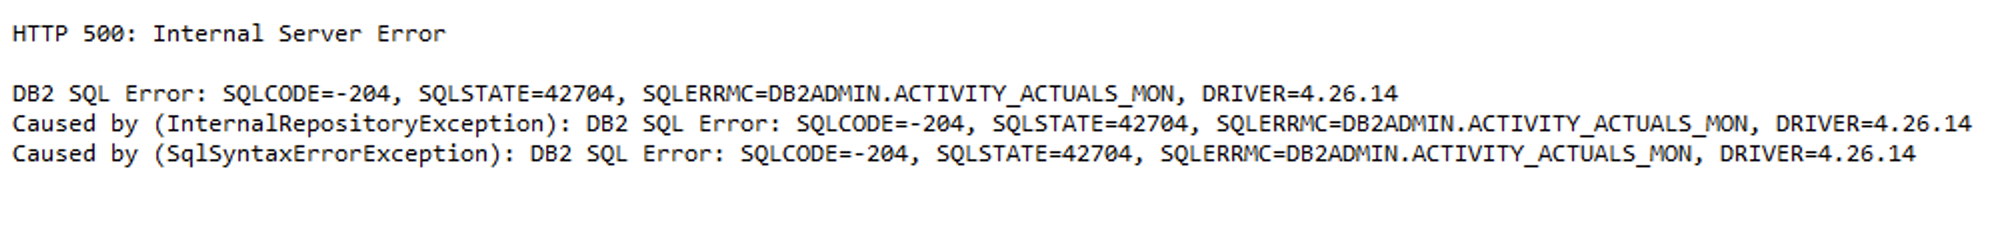
Solution: Ensure the actuals_mon event monitor commands are executed with the same user that connects to application DB.
The error states that an activity monitor must exist as a specific userID. In the example above, DB2ADMIN does not own the ACTIVITY_ACTUALS_MON event monitor. Use the Disabling the event_mon steps, using the install user.
There is a DOORS Next must gather for performance issues which should be used in conjunction with this guide. ELM Support troubleshoot use cases which are regarding slow performance and typically do not start with Db2 symptoms. It is imperative when investigating a DB2 performance, such as 100% CPU, that you collect ELM-specific data too so that you clarify whether the root cause is ELM or database related.
The Db2MustGather describes how to generate query execution plans on DB2 and how to get the actual row counts for the operators in the execution plan manually. Since ELM 7.0.2 SR1, we streamlined the steps in the Db2MustGather in a way that better integrates with the SQL statement activity event monitoring provided by the queryStats page in the repodebug facility. This allows IBM Support and/or Development to more easily get DB2 query execution plans with actual row counts and cardinalities from ELM deployments without first having to manually construct standalone SQL files (including bind parameter values, etc.). Note: This article assumes that you have enabled repodebug. It is expected that you are using this article in conjunction with IBM Support for IBM Engineering Lifecycle Management (ELM). A DBA is expected to be assisting with the use of any additional monitoring output from Oracle, for example using the Oracle mustgather for SQL Monitor reports. A Db2 DBA may be required for the Using Db2 batch. Note: Much of this new functionality is available for all supported database types, not just DB2. Functionality available only for DB2 is marked [DB2 ONLY].
Summary of New Functionality
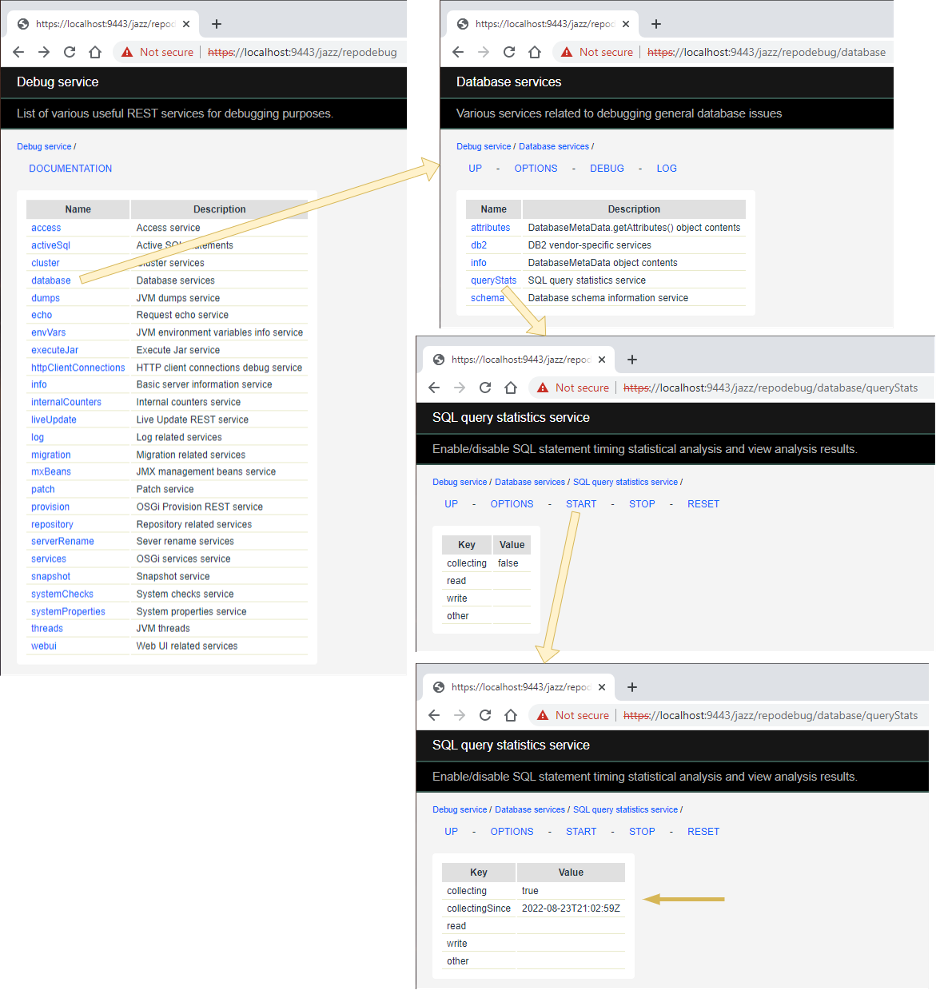
The new functionality is provided through the application's queryStats repodebug page. You can get to the queryStats page from the top-level repodebug page at https://server:9443/application/repodebug (where server is the hostname of the application server and application is the application (e.g., rm, qm, etc.)) by clicking the database link and then the queryStats link.On the queryStats Main Page
If query stats collection has been started and some query stats have been collected, the statRecordsEnabled column indicates whether or not stat records are being collected for each listed query when it is executed. A stat record captures details about a single execution of a query, including its parameter values. It supports being able to re-execute the query from repodebug (as described below). Initially, no query has stat records enabled. It must be enabled individually for each query of interest. From the queryStats main page, you can get to the queryStats page for an individual query by clicking on its hash value link. Note: the main querystats page does not reliably report the queries, as they may not list literals and may condense long query strings. These will not be usable to get Actuals values later. Use the stat record, or the application log using the SQL loggers.On the queryStats page for an individual query
The statRecordsEnabled value indicates whether or not stat records are being collected for the query when it is executed.
The statRecords table summarizes the stat records that have been collected for the query. The table has the following columns: - executeComplete a timestamp indicating when the query execution completed.
- executeTime the number of milliseconds it took the query to execute.
- fetchTime the number of milliseconds it took to fetch the querys results (if applicable).
- totalTime the sum of the executeTime and fetchTime.
- rowCount the number of rows processed by the query (if applicable).
On the stat record page for a specific query execution
This page shows the stat record values that were collected for the query execution: - hash the hash value of the query.
- executeComplete a timestamp indicating when the query execution completed.
- sql the full SQL statement that was executed.
- read-only the read-only state of the database connection at the time the query was executed.
- transactionIsolation the transaction isolation level of the database connection when the query was executed (one of read uncommitted, read committed, repeatable read, or serializable).
- executeTime the number of milliseconds it took the query to execute.
- fetchTime the number of milliseconds it took to fetch the querys results (if applicable).
- totalTime the sum of the executeTime and fetchTime.
- rowCount the number of rows processed by the query (if applicable).
- parameterMetaData information about the data type of each parameter. May not be available for some queries on some databases.
- parameters the values of the parameters passed for this execution of the query.
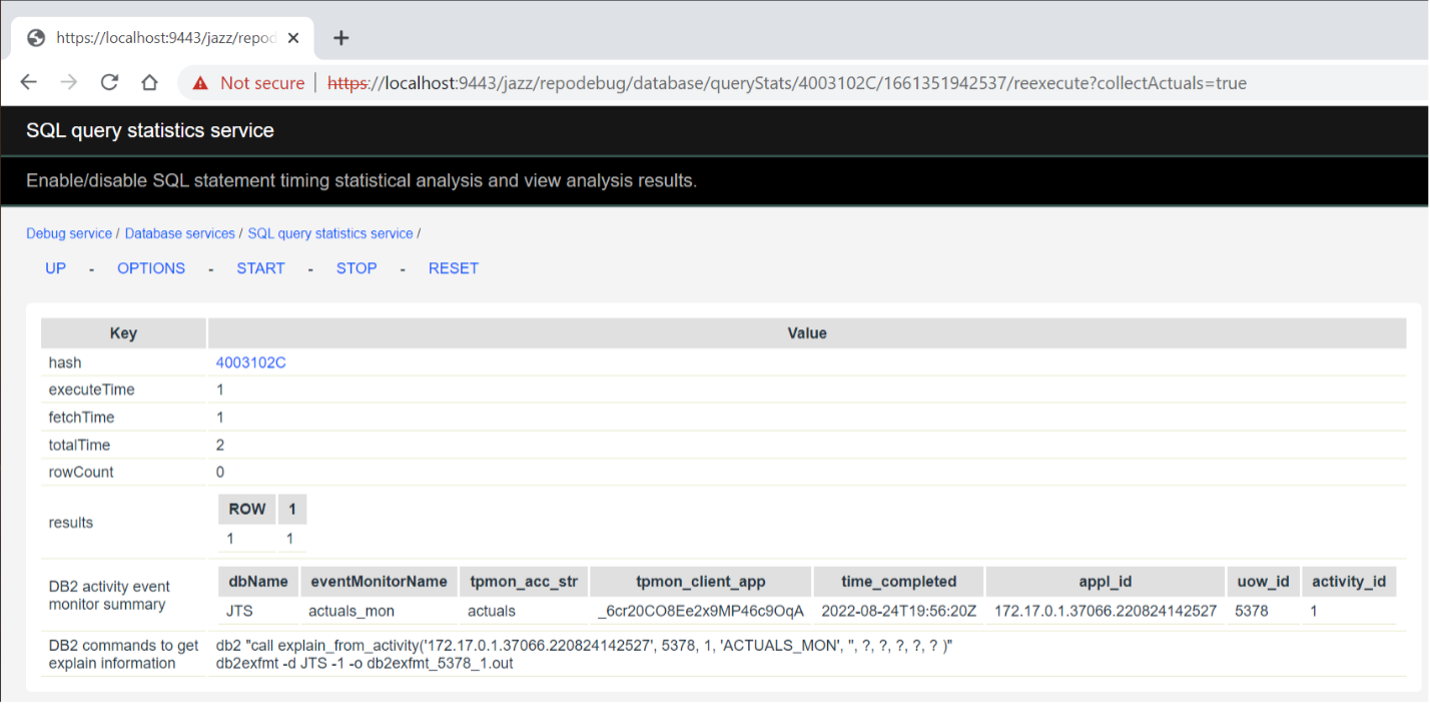
[DB2 ONLY] On the page resulting from RE-EXECUTE AND COLLECT ACTUALS
This page displays the results from re-executing the query with DB2 collecting section actuals for it.
The hash, executeTime, fetchTime, totalTime, and rowCount have the same meanings as elsewhere.
The DB2 activity event monitor summary row shows a summary of the information collected by the event monitor for the query execution.
The DB2 commands to get explain information row shows the two DB2 commands that can be executed (at a command prompt that is connected to the database) to generate a file containing the formatted query execution plan used for this execution of the statement, one that includes actual row counts and cardinalities (in addition to the estimates normally provided).
The intent is that the two commands can easily be copy & pasted to the command prompt to execute them.
Usage example
Lets assume that you have already identified a query of interest (typically, because it is unexpectedly slow) using queryStats or some other tool. Go to the queryStats page, click START to start collecting query statistics.The query must be executed so that it shows up on this page. Perform (or have the customer perform) whatever action causes the query of interest to be executed. Then, refresh the queryStats page and find the query. Lets say were interested in the query whose hash is 4003102C.
Enable the collection of stat records for the query as follows. (This is similar to enabling collecting stacks for a query.) Click on the hash value to get to the query stats details for the query. Initially, statRecordsEnabled will be false and there will be no statRecords.
Click ENABLESTATRECORDS. Note that the value of statRecordsEnabled will change to true. But there will still be no statRecords because the query has not been executed since stat records were enabled just now.
Now, whenever this query executes, statRecords will be collected for it and be displayed on this page (when you refresh it). Cause the query to be executed again and refresh the page. The statRecords row will show (up to 10 of) the most recent executions of the query.
Click on one of the executeComplete timestamps to see that executions stat record.
[DB2 ONLY] Click on RE-EXECUTE AND COLLECT ACTUALS. This will re-execute the query in such a way that a DB2 activity event monitor will have captured section actuals for the query, as well as the DB2 commands that you can execute to get a query explain plan that includes the actuals.
In a command prompt from which you can connect to the DB2 database (named JTS in this example), connect to the database and then execute each of the two commands shown in the DB2 commands to get explain information row.
The resulting output file (db2exfmt_5378_1.out in this example) will contain the formatted query plan containing actual cardinalities and row counts (in addition to the estimates). For each node in the plan tree, the second row will show the actual row count or cardinality (which the following picture points out for just the first few levels).
Known Issues
HTTP Error 500: Internal Server Error while clicking on "RE-EXECUTE AND COLLECT ACTUALS"
Solution: Ensure the actuals_mon event monitor commands are executed with the same user that connects to application DB.
The error states that an activity monitor must exist as a specific userID. In the example above, DB2ADMIN does not own the ACTIVITY_ACTUALS_MON event monitor. Use the Disabling the event_mon steps, using the install user.
db2 connect to RM702
db2 "call SYSPROC.SYSINSTALLOBJECTS( 'EXPLAIN', 'D', ' ', ' ' )"
db2 ALTER workload actuals disable;
db2 DROP workload actuals;
db2 DROP TABLE ACTIVITYMETRICS_ACTUALS_MON;
db2 DROP TABLE ACTIVITYSTMT_ACTUALS_MON;
db2 DROP TABLE ACTIVITYVALS_ACTUALS_MON;
db2 DROP TABLE ACTIVITY_ACTUALS_MON;
db2 DROP TABLE CONTROL_ACTUALS_MON;
db2 drop event monitor actuals_mon;
In order to create the Event Monitor as the correct user, you can use these steps:
db2 connect to RM702 user db2admin using PassWord
db2 create tablespace actuals_mon
db2 "CREATE EVENT MONITOR ACTUALS_MON FOR ACTIVITIES WRITE TO TABLE ACTIVITY (TABLE ACTIVITY_actuals_mon IN actuals_mon), ACTIVITYSTMT (TABLE ACTIVITYSTMT_actuals_mon IN actuals_mon), ACTIVITYVALS (TABLE ACTIVITYVALS_TESTMON IN actuals_mon), CONTROL (TABLE CONTROL_TESTMON IN actuals_mon) MANUALSTART"
As db2admin, list the tables and ensure the ACTIVITY tables exist, then turn on the event monitor:
db2 list tables  | grep ACTIVITY
ACTIVITYSTMT_ACTUALS_MON            DB2ADMIN        T     2021-10-21-20.54.47.576757
ACTIVITYVALS_ACTUALS_MON            DB2ADMIN        T     2021-10-21-20.54.47.922461
ACTIVITY_ACTUALS_MON                    DB2ADMIN        T     2021-10-21-20.54.47.922461
Follow the steps to create the Explain tables
db2 "CALL SYSPROC.SYSINSTALLOBJECTS('EXPLAIN', 'C', CAST (NULL AS VARCHAR(128)), CURRENT USER)"
db2 update database configuration using section_actuals base
db2 create event monitor actuals_mon for activities write to table
db2 set event monitor actuals_mon state 1
db2 "create workload actuals current client_acctng('actuals') collect activity data with details,section"
db2 "grant usage on workload actuals to public"
Finally, check to see that the event monitor has is active
db2 "SELECT substr(EVMONNAME,1,20) as EVMONNAME, CASE WHEN EVENT_MON_STATE(EVMONNAME) = 0 THEN 'Inactive' WHEN EVENT_MON_STATE(EVMONNAME) = 1 THEN 'Active' END FROM SYSCAT.EVENTMONITORS"

EVMONNAME            2
-------------------- --------
DB2DETAILDEADLOCK    Active
ACTUALS_MON              Active     <====
As activity monitors consume resources, you should set any unwanted monitors to inactive, for example:
db2 connect user ANOther using Pa55Word
db2 set event monitor actuals_mon state 0
Also see Disabling the event monitor after use.
Related topics: Deployment web home, Db2 MustGather, DOORS Next MustGather
External links:
Additional contributors: PaulEllis, BhagathPB, IanBarnard


| I | Attachment | Action | Size | Date | Who | Comment |
|---|---|---|---|---|---|---|
| |
Picture_1.png | manage | 190.6 K | 2022-09-13 - 20:29 | PaulEllis | |
| |
Picture_10.png | manage | 258.4 K | 2022-09-13 - 21:15 | PaulEllis | |
| |
Picture_11.png | manage | 422.4 K | 2022-09-13 - 21:16 | PaulEllis | |
| |
Picture_12.png | manage | 344.1 K | 2022-09-13 - 21:18 | PaulEllis | |
| |
Picture_2.png | manage | 224.8 K | 2022-09-13 - 20:42 | PaulEllis | |
| |
Picture_3.png | manage | 103.9 K | 2022-09-13 - 21:01 | PaulEllis | |
| |
Picture_4.png | manage | 315.2 K | 2022-09-13 - 21:03 | PaulEllis | |
| |
Picture_5.png | manage | 235.3 K | 2022-09-13 - 21:05 | PaulEllis | |
| |
Picture_6.png | manage | 172.2 K | 2022-09-13 - 21:08 | PaulEllis | |
| |
Picture_7.png | manage | 179.1 K | 2022-09-13 - 21:10 | PaulEllis | |
| |
Picture_8.png | manage | 192.9 K | 2022-09-13 - 21:11 | PaulEllis | |
| |
Picture_9.png | manage | 512.9 K | 2022-09-13 - 20:24 | PaulEllis |
Contributions are governed by our Terms of Use. Please read the following disclaimer.
Dashboards and work items are no longer publicly available, so some links may be invalid. We now provide similar information through other means. Learn more here.