In any active Enterprise Lifecycle Management (ELM) deployment, the size of the repository grows over time. The amount of disk I/O also grows, either because more users are accessing the deployment at once, or simply because the database tables get bigger and the database server doesn't have enough memory to cache everything. That means that the storage system on the database server can become a bottleneck. It is a good idea to know what your storage system is capable of, and how that compares to the test systems we use in the IBM labs are part of our performance tests.
This article covers tools that can benchmark the performance of storage systems, and includes some sample results from the IBM labs.


The theory and practice of disk benchmarking
There are several factors that will influence disk performance, including:- the total number of disk drives in the system
- the throughput limits of each individual disk
- the throughput limits of the disk controller
- the latency between the computer system and the storage system.
- IOPS: I/O operations per second
- Throughput: amount of data transferred per second
- Latency: time required to execute an I/O operation
- Calibrate_io is part of Oracle and can collect IOPS and throughput data for an Oracle server by running a simple stored procedure. It is easy to use and available on all Oracle systems, but its main disadvantage is that the results can be dependent on the size and layout of the Oracle databases. That makes comparing disk performance between Oracle servers unreliable.
- SLOB is an open-source tool that drives SQL load against a test database. It is harder to use than calibrate_io since it must be downloaded, and a test database must be created. But it provides a greater degree of control over the I/O workload and can generate numbers that are comparable across systems. However, you need to minimize the memory used by Oracle in order to force reads to go to disk, and so this is not a good tool to use against a production database server.
- sysbench is an open-source benchmarking tool that can drive load against the disk via files. It can generate both random and sequential I/O. It must be downloaded and installed, and you must create a set of files for it to run against. Results should be comparable between systems. The main disadvantage is that the I/O patterns from sysbench are not the same as the I/O patterns from a database, so it isn't possible to correlate sysbench IOPS numbers with IOPS numbers from calibrate_io or SLOB.
Disk benchmarking with calibrate_io
Oracle provides a tool that lets you characterize the performance of your storage subsystem. You can run a calibration inside the database using the procedure DBMS_RESOURCE_MANAGER.CALIBRATE_IO. To run the CALIBRATE_IO procedure, you need to be accessing datafiles using asynchronous I/O. This is not the default, so you can check your state by running the SQL statement below. You should see "ASYNC_ON" in the output. If you see ASYNC_OFF (as in the output below), you'll need to change that.
SELECT d.name,
       i.asynch_io
FROM   v$datafile d,
       v$iostat_file i
WHERE  d.file# = i.file_no
AND    i.filetype_name  = 'Data File';

NAME                                               ASYNCH_IO
-------------------------------------------------- ---------
/u01/app/oracle/oradata/DB11G/system01.dbf         ASYNC_OFF
/u01/app/oracle/oradata/DB11G/sysaux01.dbf         ASYNC_OFF
/u01/app/oracle/oradata/DB11G/undotbs01.dbf        ASYNC_OFF
/u01/app/oracle/oradata/DB11G/users01.dbf          ASYNC_OFF
/u01/app/oracle/oradata/DB11G/example01.dbf        ASYNC_OFF

5 rows selected.

SQL>
To switch to asynchronous I/O, use the following command:
ALTER SYSTEM SET filesystemio_options=setall SCOPE=SPFILE;Then, shutdown and restart Oracle. You should now see "ASYNC_ON" in the output from the above SQL. Using this I/O option should bypass the operating system's page cache, although there will still be caching by Oracle. To run the calibration, you can execute the calibrateio.sql file (attached) which calls DBMS_RESOURCE_MANAGER.calibratio_io with the default max latency of 20 ms.. It also specifies 16 disks, which is the configuration for most of our RAID arrays on the database servers in the test lab. Adjust the disk count based on the number of physical drives in your own environment. You should do this with your ELM servers shut down. Here's some sample output from one of our database servers:
SQL> @calibrateio
max_iops = 3766
latency = 18
max_mbps = 358

Note: The high I/O latencies from the calibration run indicate that the calibration I/Os are being
serviced mostly from disk. If your storage has a cache, you may achieve better results by rerunning.
Rerunning will warm or populate the storage cache.

max_iops = 3766
latency = 18
max_mbps = 358
PL/SQL procedure successfully completed.
calibrate_io tradeoffs
Calibrate_io is simple to use and is delivered with Oracle, which means it is readily available. The main drawback is that the results are dependent on factors other than storage. The documentation for calibrate_io says that it issues random reads to all data files from all database instances. The max_iops value is derived from random reads of 8K blocks. The max_mbps value is derived from random 1M reads. So, these values may vary between systems based on:- Total size and number of the data files
- Amount of memory dedicated to Oracle
- Number of Oracle instances
- The number of different storage devices that contain Oracle data
Disk benchmarking with SLOB
SLOB is a workload-generation tool which can be used to assess I/O performance for Oracle. It drives load against an actual Oracle database via SQL, and so it can test the same sort of SGA-buffered I/O that the ELM applications generate. If you use a large-enough test database and you also reduce the size of the SGA, you can create a workload where most of the I/O requests have to be satisified via physical reads from disk, and this lets you estimate the IOPS for your storage system. This makes the results from SLOB more reliable than those from calibrate_io, since you have more control over what the workload does.Installing and configuring SLOB
SLOB is available as a download at this site. Download it onto your Oracle server and unzip it into your Oracle home directory (e.g. /home/oracle/SLOB). You can get detailed information (including a tutorial) in the reference links at the end of this page. After downloading and unpacking the SLOB binary, you'll need to build the "wait kit" (that's a semaphore library used by SLOB):cd wait_kit makeYou next need to create a tablespace which will be used as a target for load. Create this as a BIGFILE, and make sure you place the datafile on the disk that you want to benchmark. I used a tablespace called IOPS:
create BIGFILE tablespace IOPS datafile '/home/oracle/tablespaces/orcl/IOPS.dbf' size 1G NOLOGGING ONLINE PERMANENT EXTENT MANAGEMENT LOCAL AUTOALLOCATE SEGMENT SPACE MANAGEMENT AUTO ;
alter tablespace IOPS autoextend on next 200m maxsize unlimited;
Next, you run the setup.sh command to populate the tablespace with data. You will want a fairly large database - one that will not fit entirely in the Oracle cache. If your database is too small, then all you are really testing is Oracle's ability to access memory. I used a 200G database. Edit slob.conf as follows:
SCALE=2G
LOAD_PARALLEL_DEGREE=2
THREADS_PER_SCHEMA=1
DATABASE_STATISTICS_TYPE=awr
Other parameters can be left at their defaults, except for DBA_PRIV_USER and SYSBA_PASSWORD. You will need to set those two values to the credentials for a privileged Oracle user. Now, in /home/oracle/SLOB, run:
./setup.sh IOPS 100This will create 100 schemas in the IOPS tablespace. Each schema will be 2G in size (since that's the value of the SCALE parameter) for a total of 200G of data. setup.sh will also create 100 test users (user1 through user100) - these test users will be used by the workload generator to connect to the test schemas.
Running tests
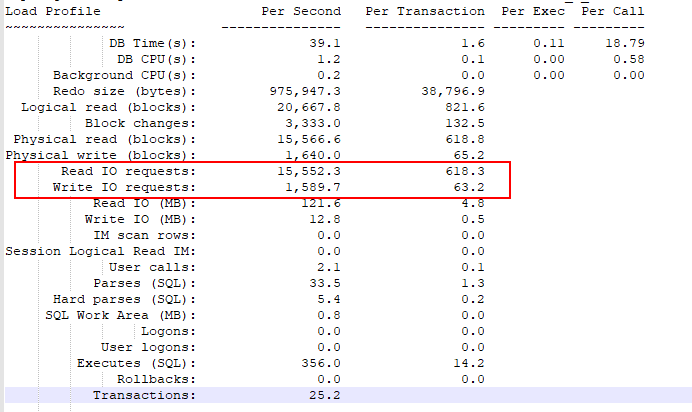
The script "runit.sh" will generate load against the test database and collect metrics from the system during the test. You provide runit.sh with the number of schemas to test against simultaneously. For example, "./runit.sh 10" will run the workload against 10 schemas, using a number of threads for each schema based on the THREADS_PER_SCHEMA parameter. I'm just using one thread per schema, so "./runit.sh 10" will run 10 load generating threads against 10 different schemas. When the test completes, there are several files generated in the /home/oracle/SLOB directory. OS metrics are in iostat.out, mpstat.out and vmstat.out. There is also an AWR report covering the period during which the workload executed (awr.txt). You should reduce the memory allocated to Oracle to minimize the amount of in-memory caching. I've used MEMORY_TARGET of 3g, which works well with a 200G test database. Don't go too much lower or Oracle may not start. You can check the awr output to see if you have a good value - you'll want to see a value for "Logical read (blocks)" that is close to the "physical read (blocks)" value. That means that the I/O is going to disk rather than being satisfied by data cached in SGA memory. If you see logical read values that are much higher than "physical read (blocks)", your test is finding data cached in the SGA so you are not measuring disk I/O. To get the IOPS metrics for the test, open awr.txt and look for "Read IO requests" and "Write IO requests". The total IOPS is the sum of these two values. In the example output below, the IOPS for the test was 17142 (15552.3 + 1589.7).
Tradeoffs
The advantage to using SLOB is that the IOPS numbers are more general than calibrateio, and are therefore better suited to making comparisons between systems. You have more control over how the benchmark runs. The drawbacks:- You need to create a tablespace and test users, and the tablespace will need to be relatively large.
- You'll need to minimize the amount of memory allocated to Oracle in order to reduce caching. This means that running the benchmark against a production database server would require downtime.
- You have to download and configure an open-source tool.
- You'll need to be able to generate AWR reports on your Oracle server, which requires the Diagnostics and Tuning option. You may not be able to run SLOB against the standard edition of Oracle.
Example test run
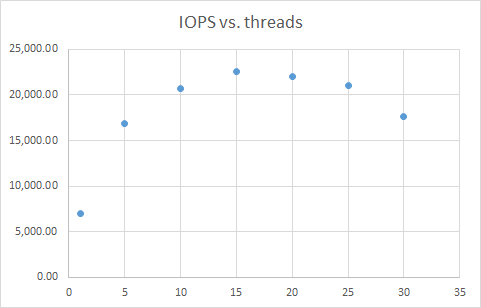
Here's an example of using SLOB to find the maximum IOPS for one of the database servers in our test lab. The basic approach was to increase the number of SLOB threads and look at where the IOPS value peaks. For the lab Oracle server, with a MEMORY_TARGET value of 3g and a test database 200g in size, the following graph shows the IOPS values achieved as a function of the number of threads. The maximum IOPS was 22581 (at 15 threads). Beyond 15, the IOPS dropped off since the threads were beginning to interfere with each other.
Disk benchmarking with sysbench
sysbench allows for benchmarking various aspects of system performance (disk, CPU, memory). When using sysbench for measuring storage, you first create a set of test files, and then run tests against them. You can test both random and sequential disk access, and you can also run in a mode that bypasses the file caches of the operating system.Installing sysbench
To install sysbench on Linux, you first update your local yum repository:curl -s https://packagecloud.io/install/repositories/akopytov/sysbench/script.rpm.sh | bashThen, install sysbench using yum:
yum -y install sysbench
Running sysbench disk benchmarks
Disk benchmarking with sysbench proceeds in two steps. First, you create a set of test files to be used as I/O targets. Be sure to create this on the disk volume that you are testing. I try to create a fairly large set of test data (200G or more) - so you need to be sure you have enough free space on the target disk for the test files.sysbench --test=fileio --file-total-size=200G prepareThen, you run the disk benchmark as follows:
- For a random read/write workload: sysbench --file-total-size=200G --file-test-mode=rndrw --file-extra-flags=direct --time=300 --max-requests=0 fileio run
- For a sequential read workload: sysbench --file-total-size=200G --file-test-mode=seqrd --file-extra-flags=direct --time=300 --max-requests=0 fileio run
Tradeoffs
sysbench interacts directly with the operating system. That means that the I/O workload does not necessarily match the I/O workload from the database. The other disadvantage is that you will need to download and install sysbench. Sysbench does provide separate modes for benchmarking random and sequential access, and it can use direct I/O so that caching does not inflate I/O numbers. Numbers from sysbench should be reliable and should be comparable across systems, and sysbench can run against any database server (it is not vendor-dependent).Appendix: Test results from the IBM labs
The table below summarizes the hardware configurations (and benchmarking results) for three different systems in the IBM lab.| System 1 | System 2 | System 3 | |
| Controller | Lenovo RAID 930-16i 4GB flash | AVAGO MegaRAID SAS 9361-8i | Lenovo RAID 930-16i 4GB flash |
| RAID mode | RAID10 | RAID10 | RAID10 |
| RAM (G) | 64 | 128 | 64 |
| Total disks | 14 | 32 | 14 |
| Spans | 7 | 8 | 7 |
| Disks per span | 2 | 4 | 2 |
| Drive speed (Gbps) | 12 | 6 | 12 |
| Strip size (Kbyte) | 256 | 64 | 256 |
| Logical sector size (bytes) | 512 | 512 | 512 |
| Physical sector size (bytes) | 4096 | 512 | 4096 |
| Caching mode | Write-back | Write-back | Write-back |
| Disk type | 900G Lenovo ST900MP0146 | 600G Seagate ST3600057SS | 900G Lenovo ST900MP0146 |
| Spin rate (rpm) | 15000 | 15000 | 15000 |
| Calibrate_io - IOPS | 6896 | 14087 | 15452 |
| Calibrate_io - Mbps | 449 | 1452 | 829 |
| SLOB IOPS | 22581 | 16119 | 24,768 |
| Sysbench random r/w | |||
|
IOPS |
989 | 1064 | 969 |
|
Read MiB/s |
4.1 | 4.4 | 4.9 |
|
Write MiB/s |
2.7 | 2.9 | 2.7 |
| Sysbench sequential read | |||
|
IOPS |
15280 | 30431 | 16828 |
|
Read MiB/s |
239 | 475 | 263 |
Related topics: Deployment web home, Deployment web home
External links:
- Measuring storage performance for Oracle systems
- Oracle documentation: CALIBRATE_IO procedure
- Calibration inside the database
- I/O configuration and design for Oracle
- Introducing SLOB - The simple database I/O testing toolkit for Oracle database
- SLOB deployment - a picture tutorial
- sysbench command line options
| I | Attachment | Action | Size | Date | Who | Comment |
|---|---|---|---|---|---|---|
| |
SLOBIOPS.png | manage | 6.0 K | 2020-01-27 - 17:38 | VaughnRokosz | |
| |
SLOBreport.png | manage | 21.0 K | 2020-01-27 - 17:28 | VaughnRokosz | |
| |
calibrateio.sql | manage | 0.4 K | 2020-01-27 - 16:30 | VaughnRokosz | SQL to execute the calibrate_io procedure |
Contributions are governed by our Terms of Use. Please read the following disclaimer.
Dashboards and work items are no longer publicly available, so some links may be invalid. We now provide similar information through other means. Learn more here.

