 RTCEE Performance Testing: EE Workload Scenario Scenario 1 Test Report
Authors: Jorge Diaz Date: Nov 21st, 2014
Build basis: Rational Team Concert 5.0
Introduction
This report gathers the result of the execution of the
Disclaimer
The information in this document is distributed AS IS. The use of this information or the implementation of any of these techniques is a customer responsibility and depends on the customer’s ability to evaluate and integrate them into the customer’s operational environment. While each item may have been reviewed by IBM for accuracy in a specific situation, there is no guarantee that the same or similar results will be obtained elsewhere. Customers attempting to adapt these techniques to their own environments do so at their own risk. Any pointers in this publication to external Web sites are provided for convenience only and do not in any manner serve as an endorsement of these Web sites. Any performance data contained in this document was determined in a controlled environment, and therefore, the results that may be obtained in other operating environments may vary significantly. Users of this document should verify the applicable data for their specific environment.
Performance is based on measurements and projections using standard IBM benchmarks in a controlled environment. The actual throughput or performance that any user will experience will vary depending upon many factors, including considerations such as the amount of multi-programming in the user’s job stream, the I/O configuration, the storage configuration, and the workload processed. Therefore, no assurance can be given that an individual user will achieve results similar to those stated here.
This testing was done as a way to compare and characterize the differences in performance between different versions of the product. The results shown here should thus be looked at as a comparison of the contrasting performance between different versions, and not as an absolute benchmark of performance.
What our tests measure
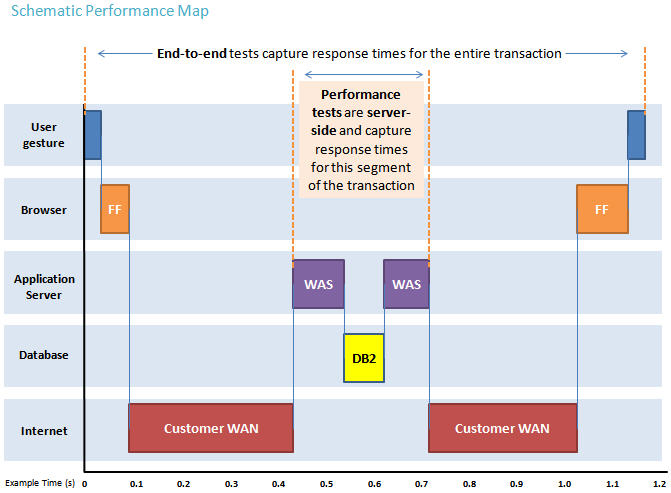
We use predominantly automated tooling such as Rational Performance Tester (RPT) to simulate a workload normally generated by client software such as the Eclipse client or web browsers. All response times listed are those measured by our automated tooling and not a client.
The diagram below describes at a very high level which aspects of the entire end-to-end experience (human end-user to server and back again) that our performance tests simulate. The tests described in this article simulate a segment of the end-to-end transaction as indicated in the middle of the diagram. Performance tests are server-side and capture response times for this segment of the transaction.
Findings
Topology
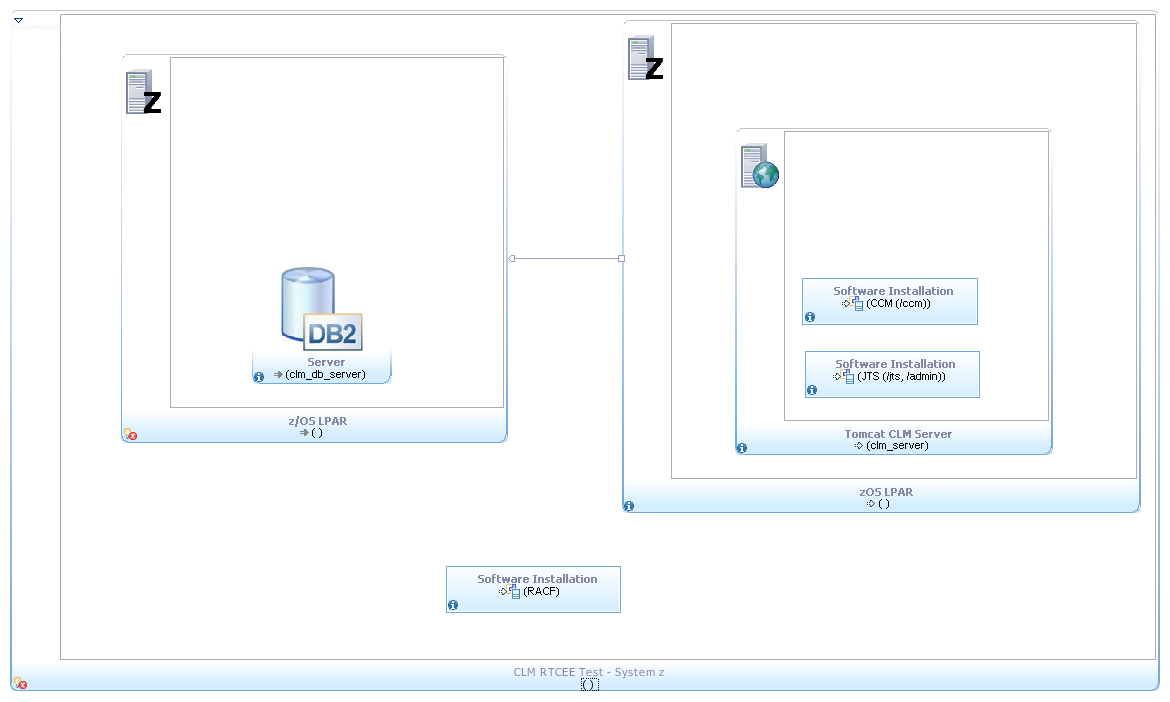
The tests are executed in a Single Tier Topology infrastructure like the one in the following diagram:
Dual Tier Topology: z/OS
Test Topology Parameterization
The following system configuration is used in the execution of this particular scenario variant:| Test Environment | Configuration | Model | MSU |
|---|---|---|---|
| RTC Server | Operating System & Version: z/OS 01.12.00 System Resource : 10 GB Storage, 2 CPs (1000 mips, CPU type : 2097.710) CALM: 5.0 GA, 4 GB heap size WAS: 8.5.5.1 |
E12 | |
| Build Forge Agent & DB2z | Operating System & Version: z/OS 01.12.00 System Resource: 6 GB Storage, 4 CPs (2000 mips, CPU type : 2097.710) Build System Toolkit: 5.0 GA DB2: 10.1.0.0 |
E12 | 513 |
Results
- For 8 hours long run of scenario1, 46 times(iterations) concurrent builds have been launched, total 1288 personal builds and 44 team builds have been processed successfully.
| Start Time | End Time | Concurrent Request Times | Concurrent Users Each Time | Total Personal Builds Num | Team Build Request Times | Total Team Builds Num | |
|---|---|---|---|---|---|---|---|
| 8/16/2014 11:30:50 AM | 8/16/2014 7:34:38 PM | 46 | 28 | 1288 | 4 | 40 |
- Personal build time/aversage build time of concurrent builds in 8 hours test;
| Build Definition | Build duration of Personal Build | |
|---|---|---|
| Build Definition 1 - 2 | 22 seconds - 4 minutes 22 seconds, average 2 minutes | |
| Build Definition 3 - 5 | 30 seconds - 4 minutes 53 seconds, average 2 minutes 30 seconds | |
| Build Definition 6 - 10 | 29 seconds - 3 minutes 43 seconds, average 2 minutes 10 seconds |
- No build(both personal and team build) fails in EE workload scenario 1 test;
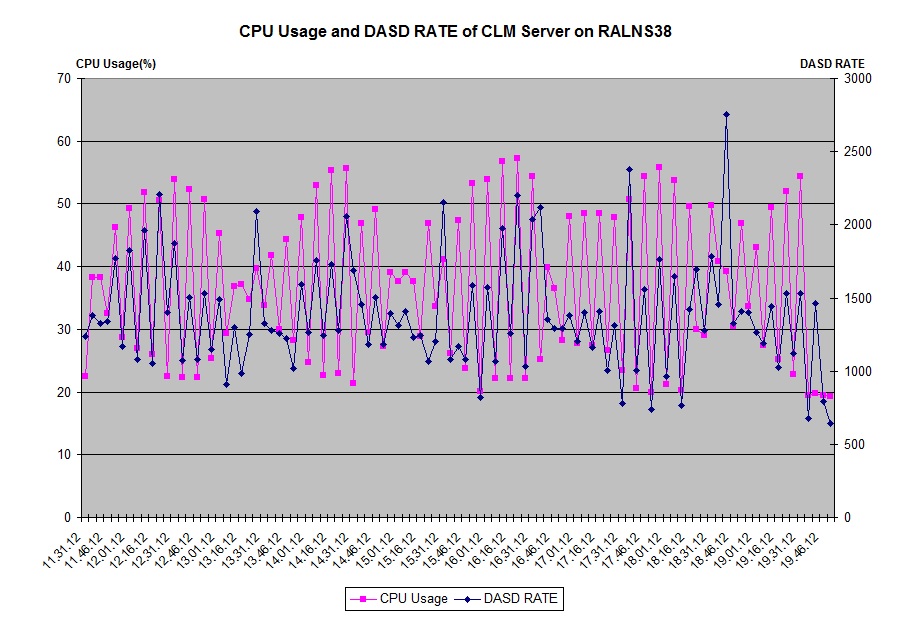
- CPU usage of CLM server is < 60% ;
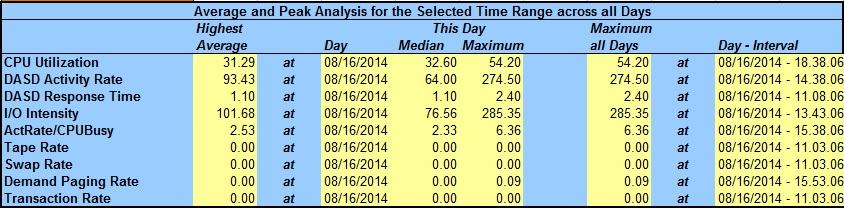
- CPU usage of BST & DB2z is < 60% ;
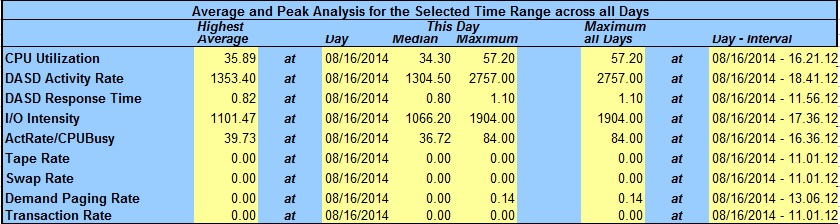
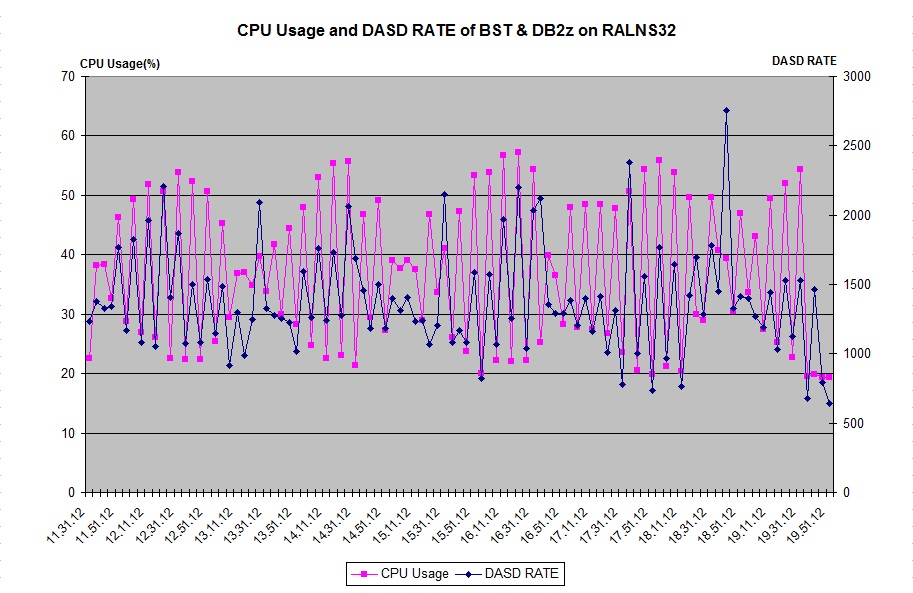
- CPU usage of DB2z is smoothly under 6% ;

- 140.4 Contributors are simulated in 2nd run - Overall Count Attempted Tasks For Run = 23990
- Size of repository volume don't increases in 8 hours exeuction(compare end with start condition).
- Indice incremental rate:
Indice Directory Name Before execution After execution Incresed Rate _Indices 2115620 2242828 6.01% ./jfs-rdfhistory 308 424 37.66% ./jfs-rdfindex 1986436 2112940 6.37% ./jfs-texthistory 52 252 0.00% ./jfs-textindex 128816 129404 0.46% About the authors
Questions and comments:
- What other performance information would you like to see here?
- Do you have performance scenarios to share?
- Do you have scenarios that are not addressed in documentation?
- Where are you having problems in performance?
Warning: Can't find topic Deployment.PerformanceDatasheetReaderComments
-
 Deployment web
-
 Planning and design
- Installing and upgrading
- Migrating and evolving
- Integrating
- Administering
- Monitoring
- Troubleshooting
Status icon key:
-
 To do
To do
-
 Under construction
- New
-
 Updated
-
 Constant change
- None - stable page
- Smaller versions of status icons for inline text:
-


Contributions are governed by our Terms of Use. Please read the following disclaimer.
Dashboards and work items are no longer publicly available, so some links may be invalid. We now provide similar information through other means. Learn more here.