RTCEE for Application Development for z/OS Performance Testing
Authors: Jorge DiazBuild basis: RTC 4.x, RTC 5.x, RTC 6.x
This topic provides general information regarding the different performance tests for Rational Team Concert Enterprise Extensions for the System Z platform.
 From the diagram, we can differentiate:
 From the diagram, we can differentiate:
 From the diagram, we can differentiate:
The sample application is a COBOL/CICS application that has a number of both statically called programs and dynamically called programs with a number of common and module specific copybooks. The process flow of the application from a CICS perspective is as follows:
The tests are executed against different sets of scalability data based on the Mortgage Application sample. This scenario tests are usually executed as a single user operation run. Detailed information about this scenario and test reports can be found here.
Detailed information about this scenario and test reports can be found here.
The specific scenarios in this category will vary because they are specially designed in every release to test the features that have performance related changes. Note: For detail scenarios, please refer to 'Test Report' section to get the specific feature test you interested on. Detailed information about this scenario and test reports can be found here.
The tests scenario themselves are based on observations of the usage performed by our customers and our recommended practices to them. Detailed information about this scenario and test reports can be found here.
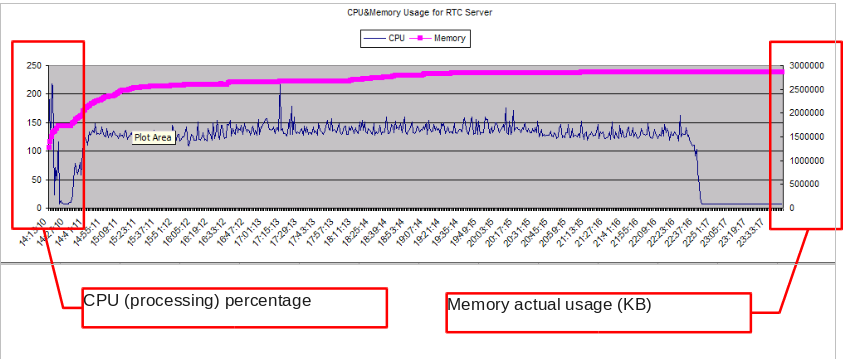
The following is an example of a resources graphic and the information presented. Axis meaning will vary depending on information tracked:
Introduction: Platform vs. Features Testing
There are two different sets of tests and two testing aspects to consider when talking about RTC and the System Z platform:- System Z as deployment platform: this is core RTC testing, therefore no system Z development practices nor RTCEE features are considered in this type of tests; but the RTC server is deployed on system Z. For example, when talking about deployments following the the E5 and E6 topologies captured in the Original Standard Deployment Topologies article on Jazz.net. This is the case of reports like Rational Team Concert 4.x sizing report for z/OS. This article won't cover information on this type of testing as the focus is to provide information around RTCEE features performance testing.
- Developing for System Z: The RTC Enterprise Extensions features provide capabilities that leverage and provides support for the development for the mainframe. Specific performance tests are run for this type of features to assure they are performant; this is the focus of the information in this wiki page.
- RTCEE Benchmark Testing: these are well defined specific Rational Team Concert Enterprise Extensions features tests. The data gathered will allow to assure the performance of these capabilities, and compare releases performance. Given how these tests are run in the development cycle they also allow the identification of potential issues/bugs.
- Regression Tests: this category of tests includes the ones like regression tests, the testing of new EE features or new EE configuration options, or special cases like changes in the technology.
Typical Testing Topologies
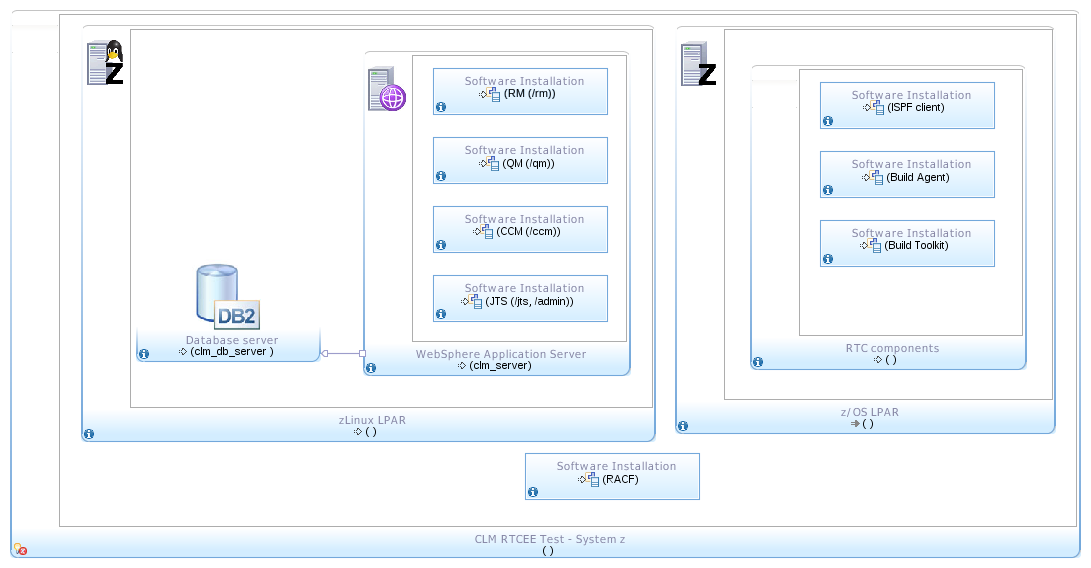
Specific RTCEE performance tests are typically executed in a Single Tier Topology infrastructure like the one in the following diagram: This section describes the testing topologies used for performance tests focused on RTCEE features for Application Development for z/OS.Single Tier Topology: zLinux
From the diagram, we can differentiate:
- Server components are installed in a zLinux LPAR where CLM server and database server are deployed. In spite that the tests are focused on RTC Enterprise Extensions capabilities, the software installation includes the full CLM solution.
- A z/OS LPAR in the same system Z holds the installation of the RTC build components (Build Agent and Build Toolkit), and the RTC ISPF client.
- Both LPARs are dedicated to the CLM components described.
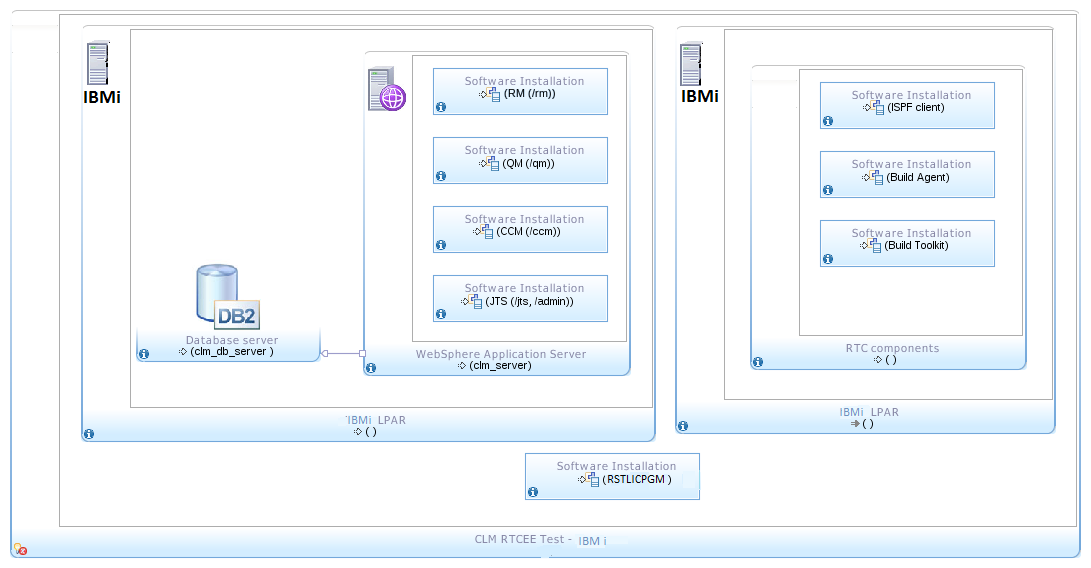
Single Tier Topology: IBMi
From the diagram, we can differentiate:
- Server components are installed in a IBMi LPAR where CLM server are deployed and DB2 server is used. In spite that the tests are focused on RTC Enterprise Extensions capabilities, the software installation includes the full CLM solution.
- A IBMi LPAR in the same IBMi system holds the installation of the RTC build components (Build Agent and Build Toolkit).
- Both LPARs are dedicated to the CLM components described.
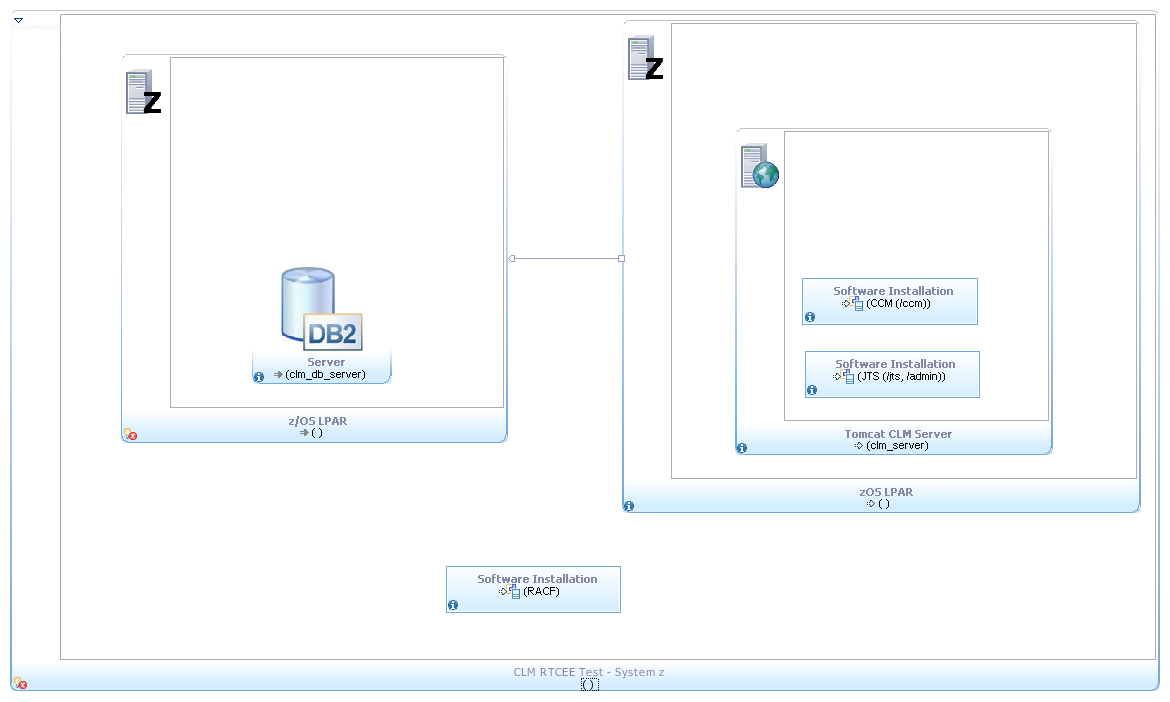
Dual Tier Topology: z/OS
From the diagram, we can differentiate:
- RTC Server components are installed in a z/OS LPAR.
- A z/OS LPAR in the same system Z holds the installation of both the DB2 database and the RTC build components (Build Agent and Build Toolkit).
- Both LPARs are dedicated to the CLM components described during the testing
Test Data
This section describes the data that is used for the performance tests that are specific for the Enterprise Extensions features tests scenarios. The data is based on a sample application which, to achieve levels that will allow us to test scalability of the solution, is replicated generating several different variations. The base application used as data for the testing is the Mortage Application. This sample application is included as part of the Money That Matters sample. The application contains 5 (five) zComponent projects with the following base assets relevant numbers:| Element Type | # Elements | Size | Average size | Max size |
|---|---|---|---|---|
| COBOL program | 6 | 165KB | 27.5KB | 133KB |
| Copybook | 6 | 3KB | 0.5KB | 568 bytes |
| REXX | 2 | 2.6KB | 1.3KB | 1.3KB |
| BMS | 2 | 9KB | 4.5KB | 6.5KB |
| Link Card | 1 | 0.5KB | 0.5KB | 0.5KB |
| BIND file | 2 | 0.8KB | 0.4KB | 492 bytes |
- Users starts the application by issuing the EPSP transaction and this runs the EPSCMORT program.
- EPSCMORT statically calls EPSNBRVL to perform number validation
- EPSCMORT dynamically calls EPSCSMRT via an EXEC CICS LINK to pass parameters to the mortgage payments program
- EPSCMORT dynamically calls EPSMLIST when PF9 is pressed to display a list of records from a file
- EPSCSMRT dynamically calls EPSMPMT via an EXEC CICS LINK to calculate the mortgage payment
Test Scenarios and Reports
A set of scenarios that are executed as part of the RTCEE Benchmark Tests are defined. While these are standard scenarios that are run, additional scenarios may be defined for execution of specifically designed tests.Enterprise Dependency Build Scenario
This scenario tests the performance of the enterprise Dependency Based Build focused on a single user executing a team build. The tests are executed against two sets of data: MortgageApplicationx100 and MortgageApplicationx1000 on z/OS, and "Maillistx100" and "Maillistx1000" on IBMi platform. Unless otherwise specified, the following options are commonly used in the tests executing this scenario:- Leave the publish build maps option cleared
Enterprise Extensions Features Scenario
This scenario consists on testing the performance of the Enterprise Extensions features used in a complete end-to-end feature testing, from 'Promotion', 'Package', to final 'Deployment'. Detailed information about this scenario and test reports can be found here.SCM Command Line Scenario
This scenario tries to test the performance of the zImport and zLoad utilities.The tests are executed against different sets of scalability data based on the Mortgage Application sample. This scenario tests are usually executed as a single user operation run. Detailed information about this scenario and test reports can be found here.
ISPF Client Scenario
This scenario tests the performance of the Rational Team Concert ISPF client for the operation of loading sources. There are two set of sample projects being used:- Small Files sample project: this sample project contains COBOL files of 40K each.
- Large Files sample project: this sample project contains COBOL files of 1.2MB each.
Concurrent Builds Scenario
The scenario targets the concurrent execution builds. To accomplish that, team builds and personal builds are executed concurrently in different steps of the scenario.Detailed information about this scenario and test reports can be found here.
Customized Regression Tests Scenarios
This scenario is consider one of the "Additional" ones, as it's not part of the standard set of test scenarios executed every time (i.e. in every release), as part of the RTCEE Benchmark Tests.The specific scenarios in this category will vary because they are specially designed in every release to test the features that have performance related changes. Note: For detail scenarios, please refer to 'Test Report' section to get the specific feature test you interested on. Detailed information about this scenario and test reports can be found here.
EE Workload Scenario (Additional Scenario)
This scenario tests the performance of the Enterprise Dependency Based Build feature under a high volume workload, simulating concurrent build operations that developers would execute in a real case scenario.The tests scenario themselves are based on observations of the usage performed by our customers and our recommended practices to them. Detailed information about this scenario and test reports can be found here.
Test Reports Analysis Guidelines
The information presented previously in this wiki page describes the type of performance tests regularly executed for RTCEE features, and the different assets used on them. This subsection, as a wrap-up of the information, will describe data that you can expect to find in the RTCEE performance tests reports.What system information is provided?
In the different reports you will find information about the specifies of the system used and the software versions used as well. In the different test reports you will usually find:- Specifics of the topology, if anything that needs to be pointed out
- Particular software versions of the components used: WebSphere Application Server version, Database version and CLM version used in the test
- Resources assigned to the system and the components: processing units assigned to the systems, MIPS estimation, memory assigned to the system and as JVM heap
What is tracked?
The following table outlines the resources that are tracked and the units in which results are reported:- RTC and DB Server LPAR
| CPU | Percentage of processing usage. The actual RTC server process is monitored. |
|---|---|
| Memory | Measured in Kilobytes. Whole system memory consumption is monitored. |
- Build Machine LPAR
| CPU | Percentage of processing usage. Whole system memory consumption is monitored. Being a dedicated LPAR is assumed that system CPU and Build Agent CPU for builds are comparable. |
|---|---|
| Memory | Response times and rate are measured. |
Related topics:
External links:
Additional contributors:
Contributions are governed by our Terms of Use. Please read the following disclaimer.
Dashboards and work items are no longer publicly available, so some links may be invalid. We now provide similar information through other means. Learn more here.