7.0.2 iFix008 Performance Update: IBM Engineering Requirements Management DOORS Next
 Authors: VaughnRokosz, LeeByrnes, RamnarayanKumar, SkyeBischoff
Build basis: 7.0.2 iFix008
Authors: VaughnRokosz, LeeByrnes, RamnarayanKumar, SkyeBischoff
Build basis: 7.0.2 iFix008
Page contents
- Introduction
- Testing changes for 7.0.2 ifix8
- Performance limitations and mitigations
- Link validity
- Views that include link columns and columns with different attribute types
- Other recommendations for mitigating performance issues
- Ensure DNG DB instance is sufficiently sized
- Keep DB buffer cache properly sized.
- Simplify your views and keep them fit for purpose
- Keep contributions within recommended limits
- Avoid compare and deliver operations involving large number of changesets
- Keep concurrent user load under 500
- Avoid enabling the "show link validity" property for a component
- Avoid use of "link does not exist" filters on views if the database is DB2
- Schedule DNG ETL operations for non-peak hours
- Detailed test results
- Compare and deliver operations
- Appendix - Additional details
- References:
Introduction
This report describes the performance testing done for the 7.0.2 ifix8 release. The goal in this release was to test against a more complex data shape (as compared to our 7.0 testing), and to include use cases that had caused problems in large customer configurations. The testing improvements included:- Increasing the complexity of the test requirement types by adding more attributes
- Ensuring all attributes had default values
- Increasing the number of links per artifact
- Enabling link validity on all components
- Adding test views with link columns and query filters, based on reported customer problems
- Including heavily edited artifacts in the workload (up to 60,000 edits for some artifacts)
- Using streams with large numbers of change sets (more than 200K)
- Changes to data shape and workload
- Performance limitations and mitigations
- Detailed test results for ifix8
- Test results for manual compare and deliver tests
Standard disclaimer
The information in this document is distributed AS IS. The use of this information or the implementation of any of these techniques is a customer responsibility and depends on the customers ability to evaluate and integrate them into the customers operational environment. While each item may have been reviewed by IBM for accuracy in a specific situation, there is no guarantee that the same or similar results will be obtained elsewhere. Customers attempting to adapt these techniques to their own environments do so at their own risk. Any pointers in this publication to external Web sites are provided for convenience only and do not in any manner serve as an endorsement of these Web sites. Any performance data contained in this document was determined in a controlled environment, and therefore, the results that may be obtained in other operating environments may vary significantly. Users of this document should verify the applicable data for their specific environment. Performance is based on measurements and projections using standard IBM benchmarks in a controlled environment. The actual throughput or performance that any user will experience will vary depending upon many factors, including considerations such as the amount of multi-programming in the users job stream, the I/O configuration, the storage configuration, and the workload processed. Therefore, no assurance can be given that an individual user will achieve results similar to those stated here. This testing was done as a way to compare and characterize the differences in performance between different versions of the product. The results shown here should thus be looked at as a comparison of the contrasting performance between different versions, and not as an absolute benchmark of performance.Testing changes for 7.0.2 ifix8
Performance work in 7.0.2 ifix8 was focused on making the code less sensitive to data shape. The performance test repositories were enhanced to allow us to reproduce, fix, and validate data-related performance issues. This section describes what we did in more detail.Creating richer requirement types
In 7.0 performance testing, the test requirements had 40 simple string attributes. 20 of those attributes had default values, while the others were empty. For 7.0.2 ifix8, we added 11 additional attributes of varying types and assigned default values to all of them. The new attributes covered the following types:- Date
- Float
- Integer
- Multi-value enumeration with 10 options and 2 options selected as default values
- Boolean
- 5 Single-value enumeration attributes
- Range
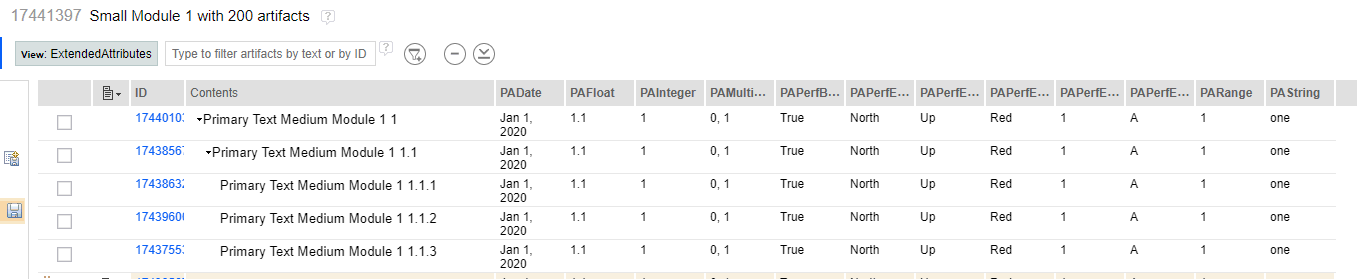 There were two reasons for doing this. First, having more attribute types with defined values enabled the creation of module views with more complex filters. Secondly, this ensured that the database tables used for storing attribute values were not empty for any attribute type. This was needed in order to reproduce customer-reported issues.
We also increased the number of links per artifact. In 7.0, requirement artifacts were sparsely linked, with a single artifact having no more than 1 link (and often 0). In 7.0.2 ifix8 testing, all artifacts have at least 10 links (with the links pointing to other artifacts in the same component).
There were two reasons for doing this. First, having more attribute types with defined values enabled the creation of module views with more complex filters. Secondly, this ensured that the database tables used for storing attribute values were not empty for any attribute type. This was needed in order to reproduce customer-reported issues.
We also increased the number of links per artifact. In 7.0, requirement artifacts were sparsely linked, with a single artifact having no more than 1 link (and often 0). In 7.0.2 ifix8 testing, all artifacts have at least 10 links (with the links pointing to other artifacts in the same component).
Simulating evolving customer deployments
After 7.0 shipped, we realized that the code could be sensitive to the way that a customer deployment evolves over time. For example, artifacts get edited over time and so the number of artifact versions increases. There were extreme customer cases caused by third-party integrations or imports, but normal user activity over a long period of time slowly but steadily increases version counts. Additionally, intense activity in a component results in large numbers of change sets being delivered to a stream - millions of change sets in extreme cases. In 7.0.2 ifix8, we created a "stress" component and ensured that the artifacts in that component were heavily edited. Modules in the stress component have up to 60,000 versions; artifacts have up to 300 versions. The stress component contains a stream with more than 200,000 change sets, to better support testing of compare and deliver operations.Adding new use cases inspired by customer-reported problems
In 7.0.2 ifix8, we enhanced the performance workload to test against the improved data shape. This included:- Enabling link validity for all components
- Defining new test views to display links in addition to the new attributes
- Adding view filters to reproduce specific customer-reported problems
- Running performance scenarios in the new stress component
- Adding compare and cross-stream deliver use cases
New view automation
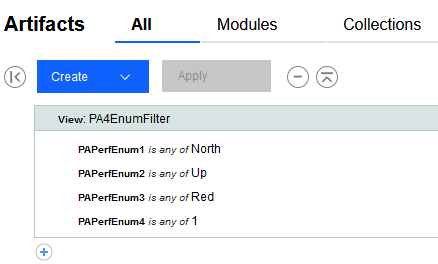
We added automation to open 6 different views. The new views include LinkTo and LinkFrom columns and also display all of the new attributes. These views are listed below.- RM_ELM_ViewPA4EnumFilterAllArtifacts - A view showing attribute columns filtered on 4 enums in the all artifacts view:
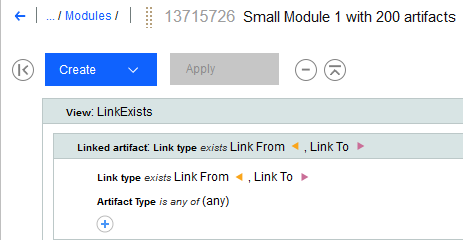
- RM_ELM_ViewLinkExists - A view showing artifacts that contain LinkTo or LinkFrom links
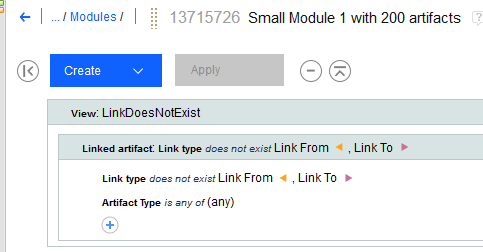
- RM_ELM_ViewLinkDoesNotExist - A view showing artifacts that do not have links:
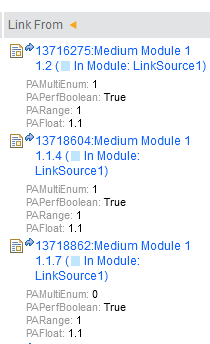
- RM_ELM_ViewExtendedLinks - A view showing attribute columns and the extended links data:
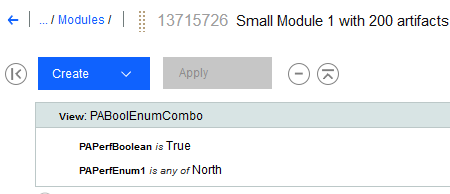
- RM_ELM_ViewPABoolEnumCombo - A view showing artifacts filtered on a combination of Bool and Enum values:
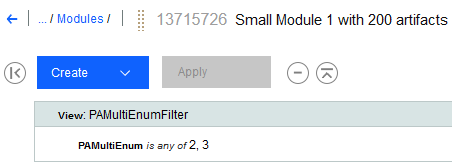
- RM_ELM_ViewPAMultiEnumFilter - A view showing artifacts filtered on multiple enums:
| Script | Percentage Usage | Target Component |
| RM_ELM_ScrollModule | 1.5% | General |
| RM_ELM_HoverArtifactEditMod | 9% | General |
| RM_ELM_Upload4MbFileNewArtifact | 2% | General |
| RM_ELM_CreateModArtifactComment | 2% | General |
| RM_ELM_CopyPaste25 | 4% | General |
| RM_ELM_CreateStream | 1 User | General |
| RM_ELM_CreateBaseline | 1% | General |
| RM_ELM_MultiSizeDeliver_Small | 8% | General |
| RM_ELM_MultiSizeDeliver_Large | 2% | General |
| RM_ELM_MultiSizeDiscard_Small | 4.5% | General |
| RM_ELM_MultiSizeDiscard_Large | 2% | General |
| RM_ELM_ViewModuleHistory | 2% | General |
| RM_ELM_CreateWordFromModule | 1% | General |
| RM_ELM_HoverModuleLink | 4% | General |
| RM_ELM_CreateLinkAndDeliver | 9% | General |
| RM_ELM_ViewLinkExists | 1.5% | General |
| RM_ELM_ViewLinkDoesNotExist | 1.5% | General |
| RM_ELM_ViewPA4EnumFilterAllArtifacts | 2% | General |
| RM_ELM_ExtendedLinks | 2% | General |
| RM_ELM_ViewPABoolEnumCombo | 2% | General |
| RM_ELM_ViewPAMulitEnumFilter | 2% | General |
| RM_ELM_ScrollModule | 1.5% | Stress |
| RM_ELM_Upload4MbFileNewArtifact | 2% | Stress |
| RM_ELM_CreateModArtifactComment | 2% | Stress |
| RM_ELM_CreateBaseline | 1% | Stress |
| RM_ELM_MultiSizeDeliver_Small | 8% | Stress |
| RM_ELM_MultiSizeDeliver_Large | 2% | Stress |
| RM_ELM_MultiSizeDiscard_Small | 4.5% | Stress |
| RM_ELM_MultiSizeDiscard_Large | 2% | Stress |
| RM_ELM_ViewModuleHistory | 2% | Stress |
| RM_ELM_CreateWordFromModule | 1% | Stress |
| RM_ELM_ViewLinkExists | 1.5% | Stress |
| RM_ELM_ViewLinkDoesNotExist | 1.5% | Stress |
| RM_ELM_ViewPA4EnumFilterAllArtifacts | 2% | Stress |
| RM_ELM_ExtendedLinks | 2% | Stress |
| RM_ELM_ViewPABoolEnumCombo | 2% | Stress |
| RM_ELM_ViewPAMulitEnumFilter | 2% | Stress |
Database configuration changes
The updates to the data shape and workload significantly increased the load on both the RM and database servers when compared to the 7.0 tests. In particular, the RM database is much larger, and this can result in overloading the I/O subsystem on the database server. We increased the total RAM on the database server from 64G to 192G. This allows for more caching in the database and less overall I/O during the load tests.Performance limitations and mitigations
The changes delivered in 7.0.2 ifix8 greatly reduce the sensitivity of the application to data shape. There are still some areas where data shape at large volume may degrade performance. This section discusses those areas, and suggests potential mitigations.Link validity
Link validity is a feature that indicates whether the contents of two artifacts meet the intended meaning of the link between them. If this feature is enabled for a component, it can place a large amount of load on the RM server. Determining the validity of the links can be expensive as the number of links increases (and as the number of link columns increases). This can lead to view timeouts in extreme cases. The validity summary column is the most significant contributor since it involves computing validity status of all links on the displayed artifacts. One issue is that the RM server does not batch requests for link validity. This can result in a large number of concurrent requests from the RM server to the JTS server, since the JTS server is the keeper of the link validity status. The default settings for HTTP connections are likely to be too low for resolving link validity in module views where the average number of links per artifact is 10 or more. This is tracked in the following work items:- Workarounds: Link validity information may load slowly, timeout, or cause a general decline in server responsiveness due to high load
- Slow /rm/checkValidity/isValid
Recommendations when link validity is enabled
Option 1: Avoid views that display link columns if the artifacts in those views have many links. Alternatively, modify those views by removing unnecessary link columns. Additionally, remove the "validity summary" column since that can incur a high cost for views that show artifacts with many links. Link validity information for a single artifact can be loaded by opening the link sidebar for a single artifact. This should put less load on the server and use fewer HTTP connections. Option 2: Check the value for the admin property "Maximum outgoing HTTP connections per destination" in Advanced Properties for RM. The default value of 50 might be too low since the code uses 1 connection per link and retrieves validity information in parallel. Double the value and check if the validity status and/or validity summary loads any faster. This value should not exceed the value for "Maximum outgoing HTTP connections total". In our 500 user tests, we set the "Maximum outgoing HTTP connections per destination" to 400, and the value of "Maximum outgoing HTTP connections total" to 500. Option 3: If these requests do cause a general degradation in server performance due to load and neither of the options above helped, the feature can be turned off. A Project admin can uncheck "Show link validity" in the "Link Validity" tab of the project/component properties tab. Note that this setting is per component. If link validity is being used in other components, the change will need to be made there as well. This change turns off display of link validity info in DNG. It might still show up in external apps such as ETM but it is not expected that it will produce as much load there due to implementation details.Views that include link columns and columns with different attribute types
Our testing found that views that display link columns can be slow to open under the following circumstances:- The artifacts in the view contain more than 10 links per artifact on average
- There is at least one link column in the view
- The view also displays columns of several different attribute types (e.g. text, enumerations, integers, floats and others). The number of attribute columns in the view is less important than the number of different types
Recommendations
Simplify the view as much as possible by eliminating any columns that are not critical. You'll get the most improvement by:- Removing link columns
- Removing all columns of a particular type (e.g. remove all integer columns)
Other recommendations for mitigating performance issues
The guidance below is expected to be temporary and removed as further performance optimizations are introduced.Ensure DNG DB instance is sufficiently sized
A high performance DB server is required for both Oracle and DB2. A minimum of 128GB dedicated to the DNG DB 'instance' is required. 192GB of RAM is recommended for high user workloads. If using Db2, Db2 Advanced Edition is required to take advantage of:- More than 128GB RAM
- More than 16 cores
- Query plan analysis necessary to troubleshoot performance issues
- Query plan analysis necessary to troubleshoot performance issues
- Database partitioning, which is used by ETM at the highest scale
Keep DB buffer cache properly sized.
The database buffer cache is used to avoid reading from disk, making read operations faster. Buffer cache size is a function of the size of the RM tablespace. A good rule of thumb is to set it at 5-10% of tablespace for Oracle, and 10% for Db2. See Database memory sizing for details.Simplify your views and keep them fit for purpose
Complex views with many attribute columns of varying types and including links to DNG artifacts can be slower to display. Create views with a particular purpose and intent in mind; minimize what needs to be shown in the view versus obtained by navigating to the artifact. Avoid displaying link validity in a view. Consider when a report can achieve the same goal as a complex view. Complex views should be tested as per: scenarios to include in day in the life testing.Keep contributions within recommended limits
Response times increase as the number of contributions to a global configuration (GC) increases, but this increase in response time is often small - 1 second or less. Additionally, the CPU utilization on the DNG server increases as GC size increases. Stay within recommended maximum contributions per GC.Contributions per GC can be estimated by this Oracle query and this query for Db2.
The number of contributions to a GC has the most impact on scenarios involving links (such as views that display link columns). In these cases, the queries to resolve links are scoped to include all of the configurations that contribute to the GC, and this has an impact as the number of contributions grows.
Avoid compare and deliver operations involving large number of changesets
Compare and deliver operations involving many changesets or artifacts with much history may be slow. Where possible, deliveries should be small and frequent to keep the number of changesets included small. For stream to stream deliveries, check the number of changesets in the source stream. You may find a compare or delivery above ~50K (Oracle) and ~25K (DB2) changesets to be slow or to not complete. If you have a large number of changesets to deliver, try a compare first to see if that works. If it doesnt, the delivery is not likely to work either. You can find additional details on our compare/deliver testing here.Keep concurrent user load under 500
At present, DNG performance may degrade when concurrent user loads exceed 500 users. Load can be monitored using the Server Activity Summary Metrics MBean. When the user load reaches that limit, consider taking steps to reduce load on the server else performance may degrade. One customer does this by notifying their users, temporarily removing DNG from the Reverse Proxy configuration (commenting out its entry), monitoring the load until it reduces, then adding DNG back into the proxy configuration and informing the users.Avoid enabling the "show link validity" property for a component
This feature is enabled at the component level. It is disabled by default and should be left disabled unless the ability to see and set link validity in the DOORS Next UI is truly needed (link validity status will be visible and editable in other apps, and visible in reports in any case). Its use in a view can lead to degraded performance and end user experience. For customers that absolutely need this function and have large numbers of links per artifact, 7.0.2 ifix8 may not yet be fully viable.Avoid use of "link does not exist" filters on views if the database is DB2
Currently this filter option performs poorly on DB2. Its use should be avoided. This is tracked in DB2: Slow SQL from "Link does not exist view" (142710).Schedule DNG ETL operations for non-peak hours
DNG ETL operations are initiated by the DCC application for populating the data warehouse. There may be times that these ETL operations are slow to complete due to long running queries employed to gather the necessary data. If this happens, then user experience may degrade. In such cases, it is recommended to move ETL operations to non-peak hours.Detailed test results
Oracle 7.0.2 iFix008 results
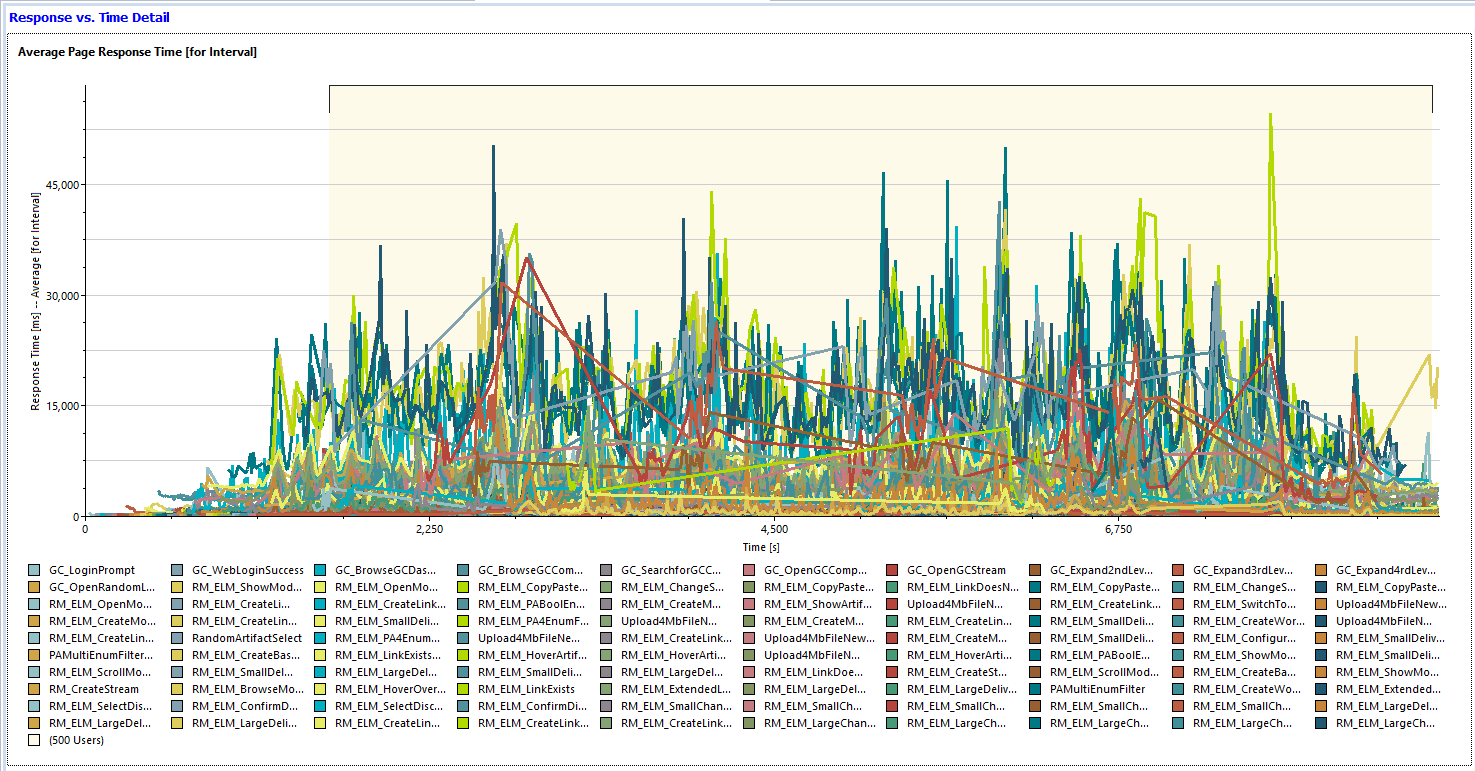
The updates to the data shape for 7.0.2 ifix8 significantly increased the amount of load on the system as compared to our 7.0 tests. While we fixed a number of problems, we did not meet our performance targets in all cases. The main pain points remaining are related to views with link columns and link validity. Nonetheless, we were able to run a 500 user load successfully in ifix8, even though some pages had high average response times. In 7.0.2 ifix3, we could not successfully run the workload at all.Oracle 7.0.2 iFix008 general statement
About this test;- Performed on a Linux/Oracle environment
- Performance workload as detailed above
- Number of contributions in global configuration: 2500
- Number of users: 500
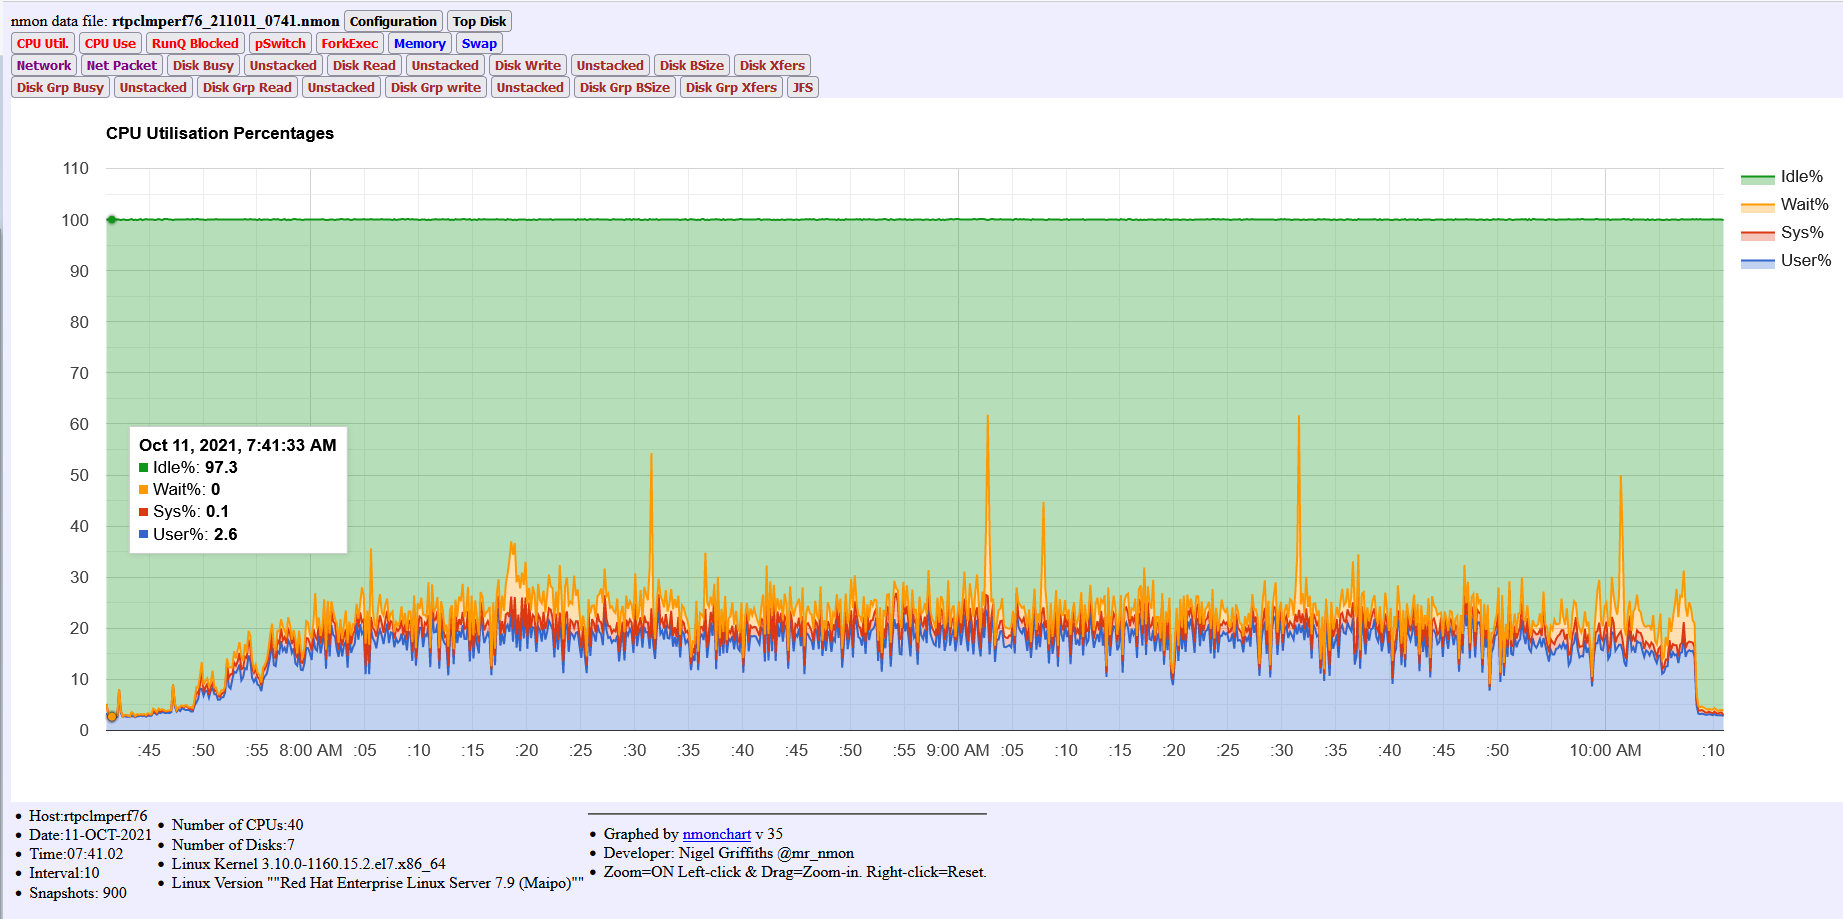
- Oracle CPU utilization ~20% and Disk Busy ~60% (Oracle server memory increased to 192G)
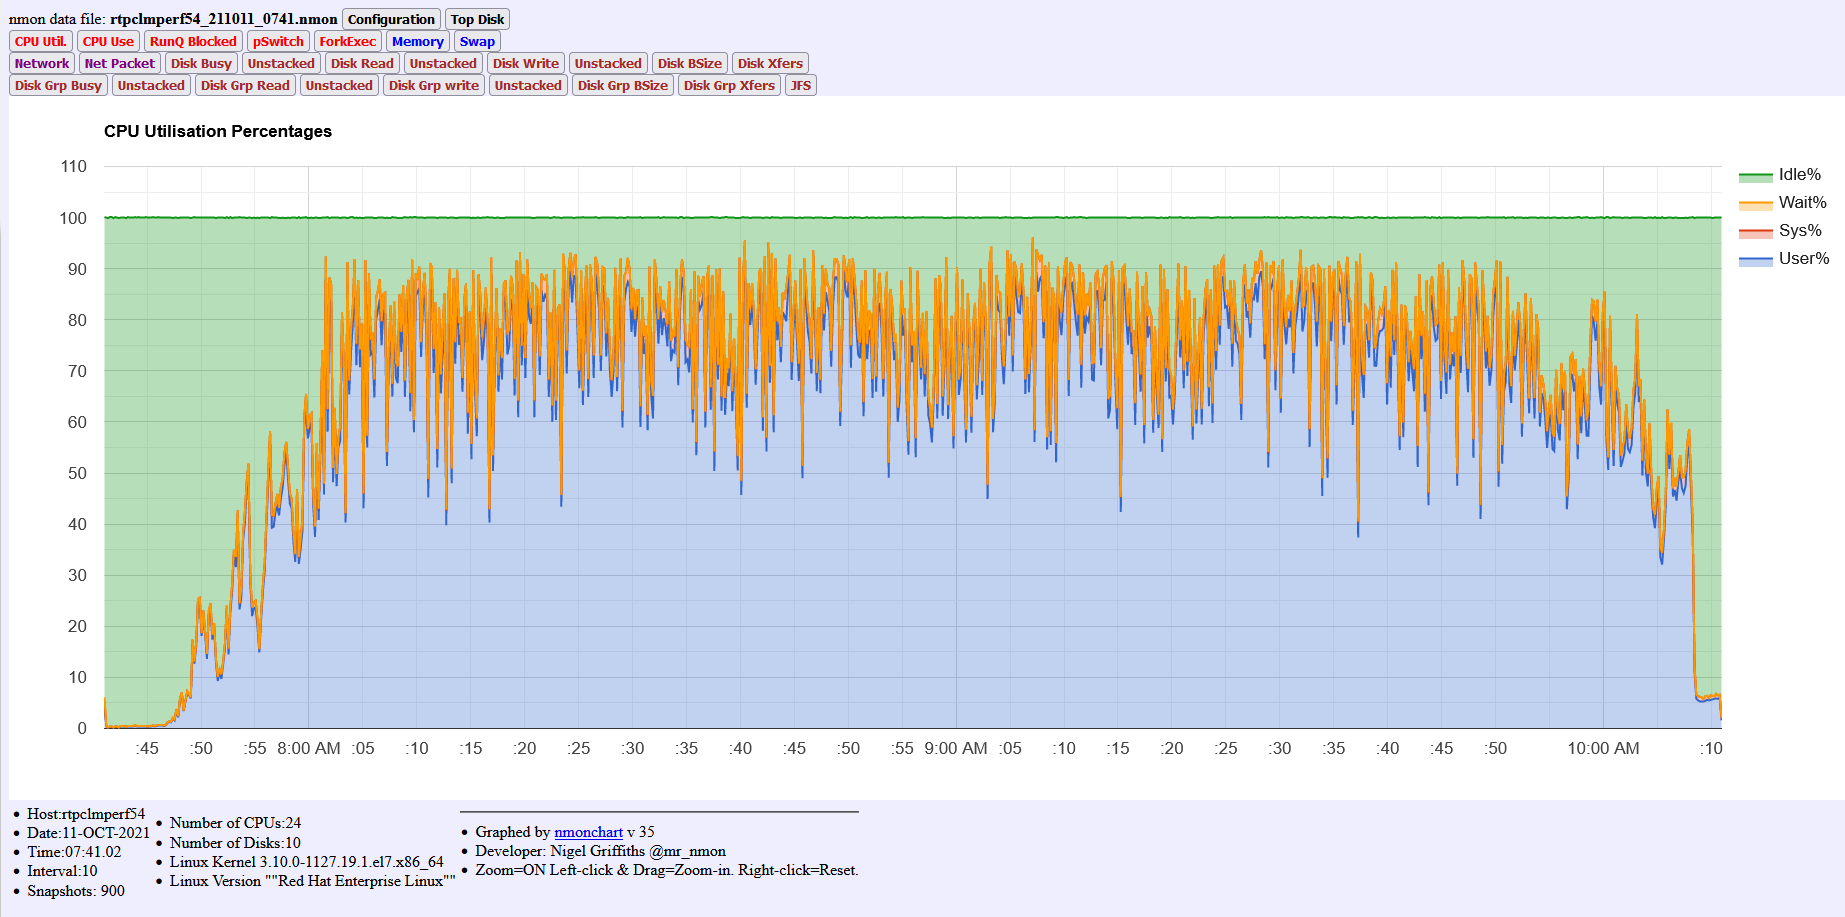
- RM Server utilization 70%-80%
- Repository size: 20 million artifacts
- One stress component with high version counts
- Additional details on jazz.net: Oracle 20m Performance test 7.0.2+ RC1 build
Oracle 7.0.2 iFix008 performance test approach
For every test the test environment is restarted. Then, we ensure that the system is fully initialized by:- manually logging into all the application components
- running the administration diagnostics,
- opening the GC and DNG UI's and perform basic actions such as opening a component from the GC project and opening a module
Once this is completed we start a performance schedule and allow it to complete the 500 user warm up and the 10 minute settle period. The test is then stopped.
At this point the recorded test is executed and all appropriate metrics gathered.
Oracle 7.0.2 iFix008 top operations
The following table shows all operations over one second ordered by their average response times. Most of the slow operations involve opening views that display link columns.| Operation | Description | Time [ms] |
| RM_ELM_LinkExists | Open a view that with a "Link does exist" filter | 18,889.30 |
| RM_ELM_BrowseModuleWithLinks | Add LinkTo and LinkFrom columns to a module view | 16,955.70 |
| RM_ELM_ExtendedLinks | Open a view that gathers links end point attribute data | 16,906.10 |
| RM_ELM_PABoolEnumCombo | Open a view that filters on multiple attribute types | 15,867.80 |
| PAMultiEnumFilter | Open a view that filters on a multi-enum attribute | 15,757.20 |
| RM_ELM_ChangeSetCreate_ConfirmCreate | Create a new change set | 8,530.50 |
| RM_ELM_LinkExists_Stress | Open a view that with a "Link does exist" filter in the stress component | 8,074.10 |
| RM_ELM_PA4EnumFilterAllArtifacts | Open a view that checks pa4enum enumfilter on all artifacts view | 7,601.70 |
| PAMultiEnumFilter_Stress | Open a view that filters on a multi-enum attribute in the stress component | 7,060.90 |
| RM_ELM_PABoolEnumCombo_Stress | Open a view that filters on multiple attribute types in the stress component | 6,638.60 |
| RM_ELM_ExtendedLinks_Stress | Open a view that gathers links end point attribute data in the stress component | 6,391 |
| RM_ELM_CreateLink_ConfirmCreateLink | Confirm link creation | 5,728 |
| RM_ELM_CreateLink_SelectModule | Select link destination module | 5,289.90 |
| Upload4MbFileNewArtifact_ShowArtifacts | Show artifacts list | 4,696.70 |
| RM_ELM_ShowModules | Show modules list | 4,327.70 |
| RM_ELM_CreateLink_SelectComponent | Select link destination component | 4,003.40 |
| RM_ELM_ShowArtifacts | Show artifacts list | 3,241.50 |
| RM_ELM_OpenModule | Open selected module | 3,183.20 |
| RM_ELM_HoverArtifactEditMod_DoneEdit | Confirm module description edit | 2,893.40 |
| RM_ELM_SmallDeliver_SelectInsertNewArtifactAfter | Insert artifact in module | 2,847.90 |
| RM_ELM_OpenModule_Stress | Open selected module in stress component | 2,727 |
| RM_ELM_CreateLink_SelectLinkTo | Select link creation type | 2,706.20 |
| RM_ELM_HoverOverLinkedArtifact | Hover over an artifact that has links | 2,677.50 |
| RM_ELM_SelectDiscard_Stress | Select changeset discard in stress component | 2,495 |
| RM_ELM_SelectDiscard | Select changesest discard | 2,308.20 |
| RM_ELM_LargeChangeSetDeliver_OpenConfigurationMenu | Open configuration menu | 2,232.60 |
| RM_ELM_PA4EnumFilterAllArtifacts_Stress | Open a view that checks PA4enum enumfilter on all artifacts view in stress component | 2,157.10 |
| RM_ELM_SmallChangeSetDeliver_OpenConfigurationMenu | Open configuration menu | 2,149.80 |
| RM_ELM_SmallDeliver_ConfirmInsertNewArtifactAfter | Confirm new artifact insert in module | 1,905.90 |
| RM_ELM_SmallDeliver_SelectArtifactTab | Select artifact tab in module | 1,855.90 |
| RM_ELM_LargeDeliver_SelectArtifactTab | Select artifact tab in module | 1,815.70 |
| RM_ELM_LargeDeliver_SelectEditArtifact | Select edit artifact tab in module | 1,718.10 |
| RM_ELM_SmallDeliver_SelectEditArtifact | Select edit artifact tab in module | 1,711.40 |
| RM_ELM_SmallDeliver_EditAndSaveArtifact | Save artifact edit in module | 1,687 |
| RM_ELM_LargeDeliver_EditAndSaveArtifact | Save artifact edit in module | 1,666.80 |
| RM_ELM_LargeDeliver_ConfirmInsertNewArtifactAfter | Confirm new artifact insert in module | 1,604.90 |
| RM_ELM_LargeDeliver_SelectInsertNewArtifactAfter | Insert artifact in module | 1,298.10 |
| RM_ELM_CreateLink_OpenConfigurationMenu | Open configuration menu | 1,262.20 |
| RandomArtifactSelect | Select random artifact in module | 1,216.50 |
| Upload4MbFileNewArtifact_SelectUploadMenu | Open upload menu | 1,202.70 |
| RM_ELM_CreateLink_SelectLinksTab | Select links | 1,118.70 |
| RM_ELM_ChangeSetCreate_SelectCreate | Select create changeset | 1,116.10 |
Oracle 7.0.2 iFix008 top transactions
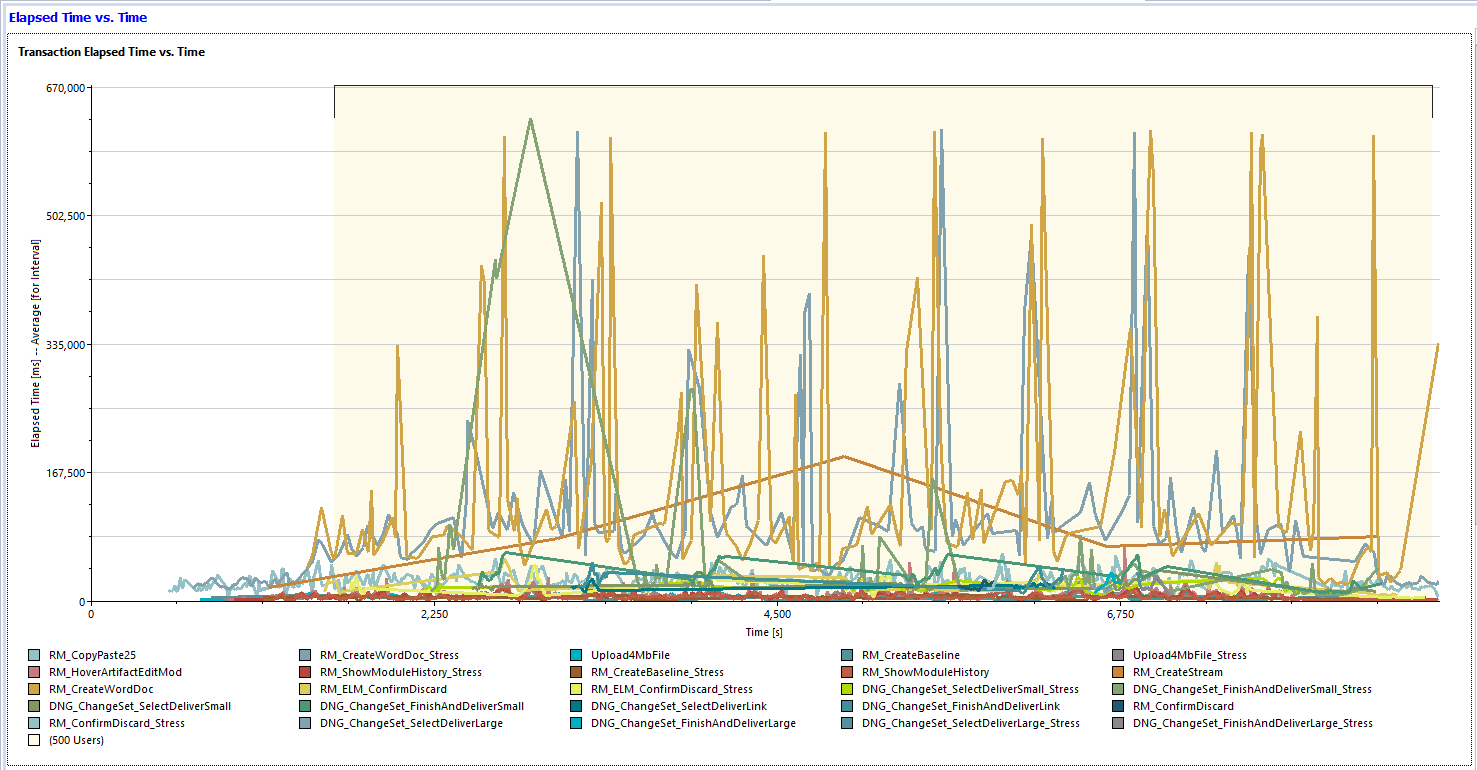
Some of the more complex operations (creating streams or baselines, delivering change sets, or creating reports from modules) can take longer - response times for the complex operations are listed below.| Transaction | Description | Time [ms] |
| RM_CreateWordDoc | Create a word document from a module | 148,583 |
| RM_CreateWordDoc_Stress | Create a word document from a module in the stress component | 100,724 |
| RM_CreateStream | Create a new stream | 88,424 |
| DNG_ChangeSet_FinishAndDeliverSmall_Stress | Delivering a change set with the small profile in the stress component | 41,582 |
| DNG_ChangeSet_FinishAndDeliverSmall | Delivering a change set with the small profile | 30,564 |
| RM_CopyPaste25 | Copying 25 artifacts and pasting in same module | 27,359 |
| DNG_ChangeSet_FinishAndDeliverLarge | Delivering a change set with the large profile | 26,658 |
| DNG_ChangeSet_FinishAndDeliverLink | Delivering a change set from a link generation script | 24,023 |
| DNG_ChangeSet_SelectDeliverLarge_Stress | Delivering a change set with the large profile in the stress component | 19,786 |
| DNG_ChangeSet_SelectDeliverLink | Delivering a change set with the large profile | 19,520 |
| DNG_ChangeSet_FinishAndDeliverLarge_Stress | Delivering a change set with the large profile in the stress component | 19,384 |
| DNG_ChangeSet_SelectDeliverSmall | Initial deliver step with changes from small profile | 17,476 |
| DNG_ChangeSet_SelectDeliverSmall_Stress | Initial deliver step with changes from small profile in stress component | 17,276 |
| DNG_ChangeSet_SelectDeliverLarge | Initial deliver step with changes from large profile | 16,641 |
| RM_CreateBaseline | Create new baseline | 4,291 |
| RM_CreateBaseline_Stress | Create new baseline in stress component | 3,976 |
DB2 7.0.2 iFix008 results
DB2 results are similar to the Oracle results, although keep in mind that the scale of the DB2 tests is half that of Oracle. DB2 results also show that link columns in views (and link validity) is a pain point.DB2 7.0.2 iFix008 general statement
About this test;- Performed on a Linux/DB2 environment
- Performance workload as detailed above
- Number of users: 300
- Number of contributions in global configuration: 1250
- DB2 CPU utilization ~70% and Disk Busy ~85%
- RM Server utilization 70%
- Repository size: updated 10 million artifacts
- One stress component with high version counts
- Additional details on jazz.net: DB2 10m Performance test 7.0.2+ RC1 build
DB2 7.0.2 iFix008 performance test approach
For every test the test environment is restarted. Then, we ensure that the system is fully initialized by:- manually logging into all the application components
- running the administration diagnostics,
- opening the GC and DNG UI's and perform basic actions such as opening a component from the GC project and opening a module
Once this is completed we start a performance schedule and allow it to complete the 300user warm up and the 10 minute settle period. The test is then stopped.
At this point the recorded test is executed and all appropriate metrics gathered.
DB2 7.0.2 iFix008 top operations
The following table shows all operations over one second ordered by their average response times. Most of the slow operations involve opening views that display link columns.| Operation | Description | Time (ms) |
| RM_ELM_LinkDoesNotExist_Stress | Open a view that with a "Link does not exist" filter in the stress component | 15079.2 |
| RM_ELM_BrowseModuleWithLinks | Add LinkTo and LinkFrom columns to a module view | 7011.1 |
| RM_ELM_LinkExists | Open a view that with a "Link does exist" filter | 6900.4 |
| RM_ELM_LinkExists_Stress | Open a view that with a "Link does exist" filter in the stress component | 5463.7 |
| RM_ELM_HoverOverLinkedArtifact | Hover over an artifact that has links | 5117.2 |
| RM_ELM_ExtendedLinks | Open a view that gathers links end point attribute data | 4900.9 |
| RM_ELM_ConfirmDiscard | Discard a change set with multiple changes | 4518.4 |
| PAMultiEnumFilter_Stress | Open a view that filters on a multi-enum attribute in the stress component | 4380.4 |
| RM_ELM_ExtendedLinks_Stress | Open a view that gathers links end point attribute data in the stress component | 4318.9 |
| RM_ELM_PABoolEnumCombo | Open a view that filters on multiple attribute types | 4268.6 |
| PAMultiEnumFilter | Open a view that filters on a multi-enum attribute | 3896.7 |
| RM_ELM_PABoolEnumCombo_Stress | Open a view that filters on multiple attribute types in the stress component | 3876.4 |
| RM_ELM_ConfirmDiscard_Stress | Discard a change set with multiple changes in the stress component | 3863.8 |
| RM_ELM_ChangeSetCreate_ConfirmCreate | Create a change set | 3052.1 |
| RM_ELM_ShowModules | Show modules list | 2723.3 |
| Upload4MbFileNewArtifact_Upload4MbFile_Stress | Upload a 4Mb text file into a selected artifact in the stress component | 1936.1 |
| Upload4MbFileNewArtifact_Upload4MbFile | Upload a 4Mb text file into a selected artifact | 1896.9 |
| RM_ELM_PA4EnumFilterAllArtifacts | Open a view that checks pa4enum enumfilter on all artifacts view | 1824.3 |
| RM_ELM_SmallDeliver_SelectArtifactTab | Select artifact tab in module | 1802 |
| RM_ELM_LargeDeliver_SelectArtifactTab | Select artifact tab in module | 1677.8 |
| RM_ELM_LinkDoesNotExist | Open a view that with a "Link does not exist" filter | 1675.8 |
| RM_ELM_PA4EnumFilterAllArtifacts_Stress | Open a view that checks PA4enum enumfilter on all artifacts view in stress component | 1588.7 |
| RM_ELM_ShowModuleHistory_Stress | Show the module history in stress component | 1567 |
| RandomArtifactSelect | Select random artifact in module | 1414.9 |
| RM_ELM_OpenModule_Stress | Open selected module in stress component | 1391.2 |
| RM_ELM_CreateLink_ConfirmCreateLink | Confirm link creation | 1379.6 |
| RM_ELM_SelectDiscard_Stress | Select changeset discard in stress component | 1346.4 |
| Upload4MbFileNewArtifact_ShowArtifacts | Show artifacts list | 1255.9 |
| RM_ELM_SmallDeliver_EditAndSaveArtifact | Save artifact edit in module | 1197.7 |
| RM_ELM_CreateLink_SelectModule | Select link destination module | 1157.2 |
| RM_ELM_LargeDeliver_EditAndSaveArtifact | Save artifact edit in module | 1128.3 |
DB2 7.0.2 iFix008 top transactions
Some of the more complex operations (creating streams or baselines, delivering change sets, or creating reports from modules) can take longer - response times for the complex operations are listed below.| Operation | Description | Time (ms) |
| RM_CreateWordDoc | Create a word document from a module | 54449.2 |
| RM_CreateStream | Create a new stream | 48392.2 |
| RM_CreateWordDoc_Stress | Create a word document from a module in the stress component | 22329.2 |
| DNG_ChangeSet_FinishAndDeliverSmall_Stress | Delivering a change set with the small profile in the stress component | 18598.1 |
| RM_CopyPaste25 | Copying 25 artifacts and pasting in same module | 15028.7 |
| DNG_ChangeSet_SelectDeliverLink | Delivering a change set with the large profile | 14946.5 |
| DNG_ChangeSet_SelectDeliverLarge | Initial deliver step with changes from large profile | 11989 |
| DNG_ChangeSet_SelectDeliverSmall_Stress | Initial deliver step with changes from small profile in stress component | 11560.9 |
| DNG_ChangeSet_SelectDeliverSmall | Initial deliver step with changes from small profile | 11412.2 |
| DNG_ChangeSet_SelectDeliverLarge_Stress | Delivering a change set with the large profile in the stress component | 10923.2 |
| DNG_ChangeSet_FinishAndDeliverLink | Delivering a change set from a link generation script | 9370 |
| DNG_ChangeSet_FinishAndDeliverLarge | Delivering a change set with the large profile | 9028.7 |
| DNG_ChangeSet_FinishAndDeliverSmall | Delivering a change set with the small profile | 8521.6 |
| DNG_ChangeSet_FinishAndDeliverLarge_Stress | Delivering a change set with the small profile in the stress component | 7744.7 |
| RM_CreateBaseline_Stress | Create new baseline in stress component | 5128.2 |
| RM_CreateBaseline | Create new baseline | 4343.7 |
Compare and deliver operations
This section describes the results of manual tests for the compare and deliver operations. The focus of this testing was to see how the performance of compare and deliver were impacted by the number of change sets delivered to a stream. This is not the only factor that impacts the performance of cross-configuration operations. The number of artifacts that are different between two configurations, as well as the number of versions of those artifacts, can have a significant impact. We did not study those other factors in this testing, so keep that in mind when interpreting how these results apply to your own deployments. A detailed summary of the performance results can be found here: Task 544057: DN Compare & Deliver single user performance summary spreadsheet.Compare
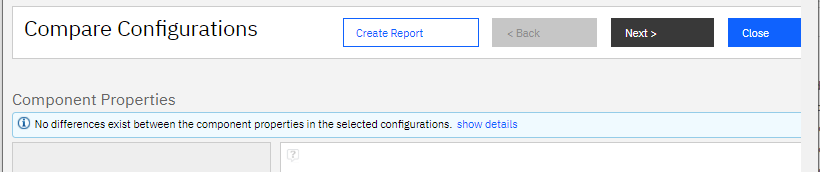
The compare operation involves 3 main steps. You start by navigating to a stream or a baseline - this is the source configuration for the compare. Then, select the "Compare Configurations" menu and select a target configuration from the dialog. The first step begins when you select "OK" in the "Select Configuration to Compare" dialog. During this step, the server determines which change sets have been delivered to the two configurations and finds the change sets that the two configurations do not have in common. Next, the server looks at the artifacts delivered in those change sets and finds the specific versions that need to be compared between the source and target configurations.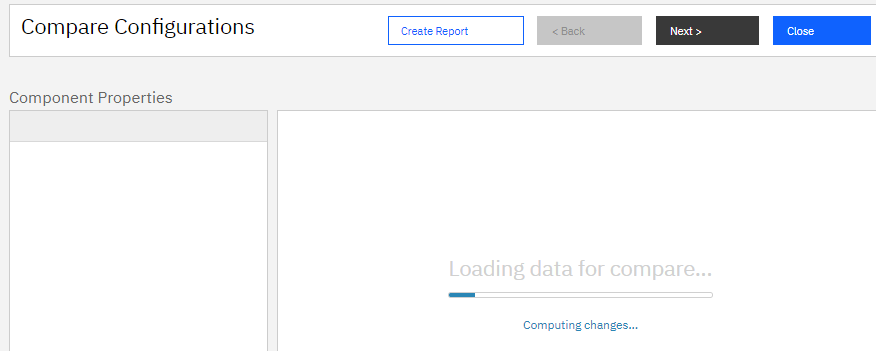 When this step completes, it displays any differences between the component properties in the selected configurations.
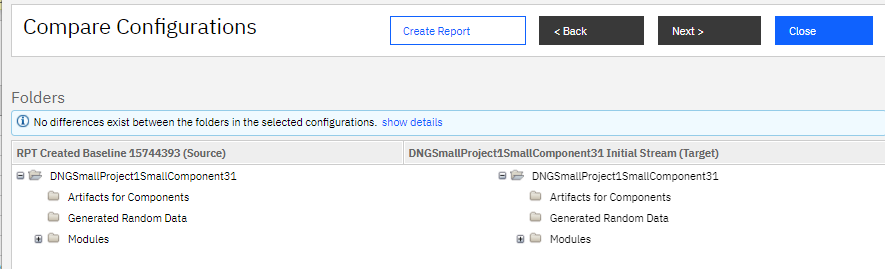
 The second step begins when you select the Next button. When this step completes, it displays any differences between the folders in the selected configurations.
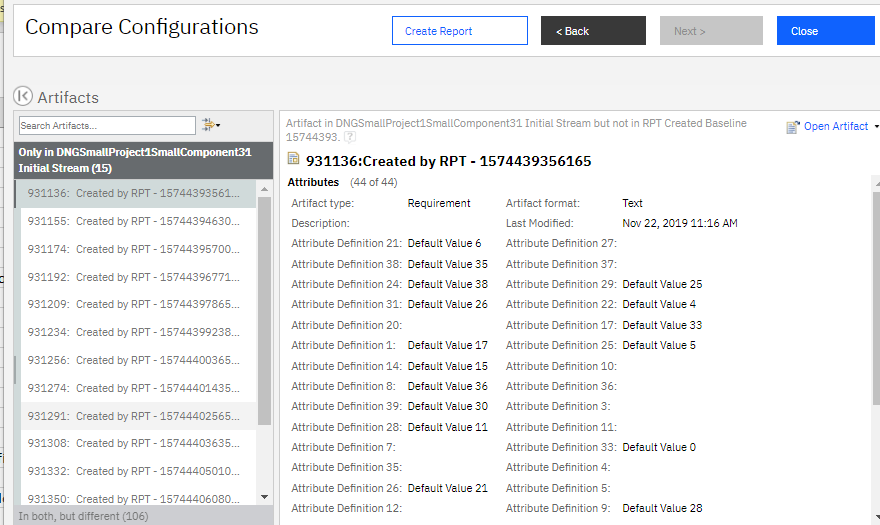
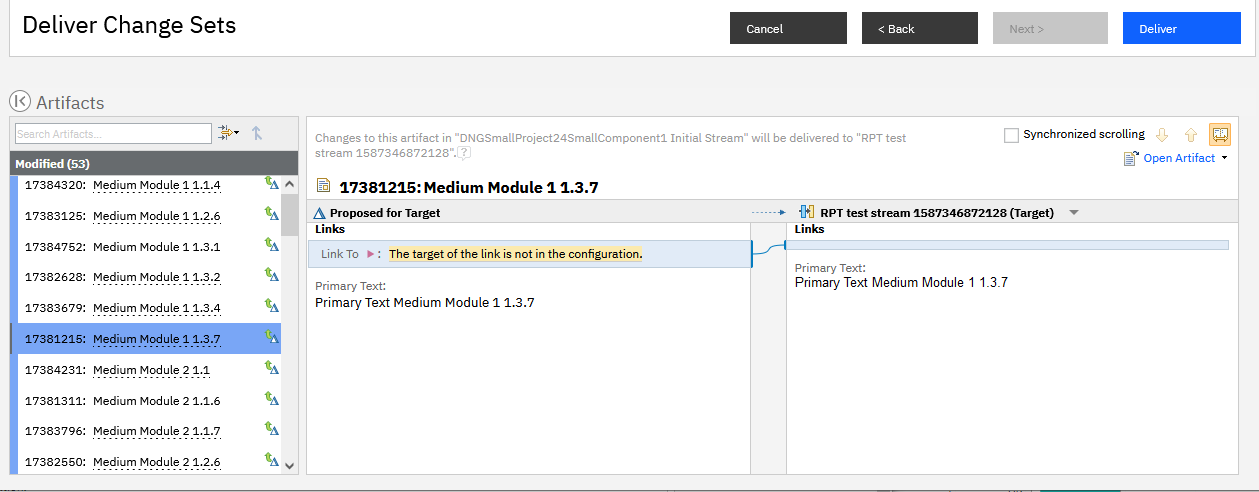
 The last step beings when you select the Next button. When this step completes, it displays the list of artifacts that are different between the two configurations (in a left-hand pane), and it will show a comparison for one selected artifact in a right-hand pane).
Oracle results
On Oracle, we tested compare at 3 different scalability levels:- 47,000 change sets updating 327 different artifacts
- 128,000 change sets updating 327 different artifacts
- 198,000 change sets
- There is a weak correlation between the number of change sets that are different between the configuration and the compare times. The correlation was the strongest when comparing an older configuration to a newer configuration. In that case, the 198,000 level was close to 4 minutes (while the 47,000 level was around 1 minute).
- It is generally faster to compare a newer configuration to an older configuration. There is less sensitivity to change set counts in that case.
- Times can be influenced by caching, both at the database level and in the application. The longest compare time we observed was 1 hour and 30 minutes, when comparing at the 198,000 level on a system that had just been restarted.
- Times are also influenced by the number of artifacts that are different between the two configurations, and by the amount of history for each of those artifacts. We did not study this in detail, however.
DB2 results
On DB2, we tested compare at 3 different scalability levels:- 60,000 change sets
- 120,000 change sets
- 240,000 change sets
- 60,000 change sets: 18 seconds
- 120,000 change sets: 83 seconds
- 240,000 change sets: 115 seconds
- 535,000 change sets: 19 hours
- 60,000 change sets: 47 seconds
- 120,000 change sets: 660 seconds
- 240,000 change sets: 932 seconds
Deliver
The deliver operation consists of 3 main steps. You start by navigating to a stream or a baseline - this is the source configuration for the deliver. Then, select the "Deliver Changes" menu and select a target stream from the dialog. The first step begins when you select "OK" in the "Select Target Configuration" dialog. During this step, the server determines which change sets need to be delivered to the target configuration. When this step completes, it displays a screen that tells you how many change sets will be delivered, and allows you to pick a delivery mechanism.
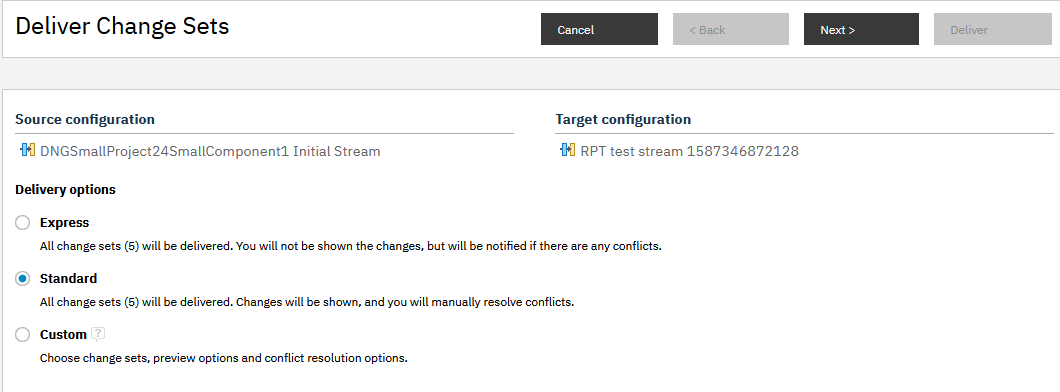 We tested both Express and Standard. The Express option skips over step 2 and starts executing step 3. If you select Standard and then Next, the server will then display a list of changes that will be delivered and allow you pick how to resolve each proposed delivery.
 Step 3 involves delivering the changes to the target stream. You initiate this step by selecting the Deliver button.
Oracle results
We measured the following times for step 1 (finding change sets to deliver):- 47,000 change sets: 210 seconds
- 128,000 change sets: 555 seconds
- 198,000 change sets: 709 seconds
DB2 results
On DB2, we tested deliver at 3 different scalability levels:- 60,000 change sets
- 120,000 change sets
- 240,000 change sets
Appendix - Additional details
Oracle test environment
| Role | Server | Number of machines | Machine type | Processor | Total processors | Memory | Storage | Network interface | OS and version |
|---|---|---|---|---|---|---|---|---|---|
| Proxy Server | IBM HTTP Server and WebSphere Plugin | 1 | IBM System x3550 M3 | 2 x Intel Xeon X5667 3.07 GHz (quad-core) | 16 | 32 GB | RAID 5 279GB SAS Disk x 4 | Gigabit Ethernet | Red Hat Enterprise Linux Server 7 (Maipo) |
| RM server | Embedded WebSphere Liberty | 1 | IBM System x3550 M4 | 2 x Intel Xeon E5-2640 2.5GHz (six-core) | 24 | 32 GB | RAID 5 279GB SAS Disk x 4 | Gigabit Ethernet | Red Hat Enterprise Linux Server 7 (Maipo) |
| Jazz Team Server and Global Configuration Server | Embedded WebSphere Liberty | 1 | IBM System x3550 M4 | 2 x Intel Xeon E5-2640 2.5GHz (six-core) | 24 | 32 GB | RAID 5 279GB SAS Disk x 4 | Gigabit Ethernet | Red Hat Enterprise Linux Server 7 (Maipo) |
| Database | Oracle 19c Enterprise Edition | 1 | IBM System SR650 | 2 x Xeon Silver 4114 10C 2.2GHz (ten-core) | 40 | 192 GB | RAID 10 900GB SAS Disk x 16 | Gigabit Ethernet | Red Hat Enterprise Linux Server 8 (Ootpa) |
Storage details are below. See Disk benchmarking for more details on I/O benchmarking.
| RAID controller | Lenovo RAID 930-16i 4GB flash |
| RAID mode | RAID10 |
| RAM (G) | 64 |
| Total disks | 14 |
| Spans | 7 |
| Disks per span | 2 |
| Drive speed (Gbps) | 12 |
| Strip size (Kbyte) | 256 |
| Logical sector size (bytes) | 512 |
| Caching mode | Write-back |
| Disk type | 900G Lenovo ST900MP0146 |
| Spin rate (rpm) | 15000 |
| Calibrate_io - IOPS | 6896 |
| Calibrate_io - Mbps | 449 |
| SLOB IOPS | 22581 |
| Sysbench random r/w | |
| * IOPS | 989 |
| * Read MiB/s | 4.1 |
| * Write MiB/s | 2.7 |
| Sysbench sequential read | |
| * IOPS | 15280 |
| * Read MiB/s | 239 |
Additional system settings:
- -Xmx20G -Xms20G -Xmn5G -Xcompressedrefs -Xgc:preferredHeapBase=0x100000000 -XX:MaxDirectMemorySize=1G
- -Dcom.ibm.rdm.configcache.expiration=5040
- -Dcom.ibm.rdm.configcache.size=5000
- In rm/admin and gc/admin:
- Maximum number of contributions per composite: 5000
- JDBC connection pool: 400
- RDB Mediator pool: 400
- Maximum outgoing HTTP connections per destination: 400
- Maximum outgoing HTTP connections total: 500
- In rm/admin:
- View query threadpool size override: 500
DB2 test environment
| Role | Server | Number of machines | Machine type | Processor | Total processors | Memory | Storage | Network interface | OS and version |
|---|---|---|---|---|---|---|---|---|---|
| Proxy Server | IBM HTTP Server and WebSphere Plugin | 1 | IBM System x3550 M3 | 2 x Intel Xeon X5667 3.07 GHz (quad-core) | 8 | 16 GB | RAID 5 279GB SAS Disk x 4 | Gigabit Ethernet | Red Hat Enterprise Linux Server 7 (Maipo) |
| RM server | Embedded WebSphere Liberty | 1 | IBM System x3550 M4 | 2 x Intel Xeon E5-2640 2.5GHz (six-core) | 24 | 32 GB | RAID 5 279GB SAS Disk x 4 | Gigabit Ethernet | Red Hat Enterprise Linux Server 7 (Maipo) |
| Jazz Team Server and Global Configuration Server | Embedded WebSphere Liberty | 1 | IBM System x3550 M4 | 2 x Intel Xeon E5-2640 2.5GHz (six-core) | 24 | 32 GB | RAID 5 279GB SAS Disk x 4 | Gigabit Ethernet | Red Hat Enterprise Linux Server 7 (Maipo) |
| Database | DB2 11.5 Advanced Edition | 1 | IBM System x3650 M4 | 2 x Intel Xeon E5-2640 2.5GHz (six-core) | 24 | 192 GB | RAID 10 900GB SAS Disk x 16 | Gigabit Ethernet | Red Hat Enterprise Linux Server 7 (Maipo) |
Performance defects deferred out of 7.0.2 ifix8
- Errors occur after initiating step 2 (i.e. compare) of a Standard deliver that includes 198,000 change sets in Oracle (142836)
- DB2: View timeout caused by type system initialization in a GC (142826)
- Express deliver with 60K change sets takes more than twice as long (30 min) to complete in DB2 than it takes to express deliver roughly similar # of change sets in Oracle (142769)
- Web client timing out 30 minutes after initiating step 2 (i.e. compare) of a Standard deliver that includes 60, 000 change sets in DB2 (142768)
- DB2: long period of poor performance after RM server restart (142751)
- Performance of views with link columns that link to modules degrades as module states increase (141311)
- DB2: Slow SQL from "Link does not exist view" (142710)
- DB2: Timeout when displaying list of modules in stress component (142701)
- Slow SQL when opening views with link columns and multiple types of attribute columns (142382)
- Slow /rm/checkValidity/isValid (141335)
- Poor performance in Link Constraints tab (140942)
- Slow SQL when selecting "More" when hovering over DNG artifacts (142130)
- getChangesInConfiguration for baselines is impacted by size of history (541443)
- DB2: Slow SQL leads to view timeouts (from RequirementQueryService.getArtifactNamesInternal) (543560)
References:
Related topics:
Questions and comments:
- What other performance information would you like to see here?
- Do you have performance scenarios to share?
- Do you have scenarios that are not addressed in documentation?
- Where are you having problems in performance?


| I | Attachment | Action | Size | Date | Who | Comment |
|---|---|---|---|---|---|---|
| |
CompareStep1.png | manage | 9.7 K | 2021-11-09 - 17:33 | VaughnRokosz | |
| |
CompareStep1b.PNG | manage | 10.5 K | 2021-11-09 - 17:33 | VaughnRokosz | |
| |
CompareStep2b.PNG | manage | 21.1 K | 2021-11-09 - 17:33 | VaughnRokosz | |
| |
CompareStep3b.PNG | manage | 62.7 K | 2021-11-09 - 17:33 | VaughnRokosz | |
| |
DeliverStep1a.png | manage | 12.2 K | 2021-11-09 - 18:36 | VaughnRokosz | |
| |
DeliverStep1b.png | manage | 21.8 K | 2021-11-09 - 18:36 | VaughnRokosz | |
| |
DeliverStep2.png | manage | 46.2 K | 2021-11-09 - 18:38 | VaughnRokosz | |
| |
ExtendedLinks.png | manage | 12.6 K | 2021-11-04 - 14:55 | VaughnRokosz | A view showing attribute colums and the extended links data |
| |
LinkDoesNotExist.png | manage | 14.7 K | 2021-11-04 - 14:57 | VaughnRokosz | A view showing attribute columns filtered on links not existing |
| |
LinkExists.png | manage | 13.3 K | 2021-11-04 - 14:58 | VaughnRokosz | A view showing attribute columns filtered on links existing |
| |
NewAttributes.png | manage | 26.2 K | 2021-11-04 - 14:37 | VaughnRokosz | |
| |
NewLinks.png | manage | 12.0 K | 2021-11-04 - 14:37 | VaughnRokosz | |
| |
Oracle_AveragePageResponse.png | manage | 162.3 K | 2021-10-13 - 12:43 | UnknownUser | Average Transaction times of the Oracle 500 user performance test |
| |
Oracle_CPU.png | manage | 166.5 K | 2021-10-13 - 12:52 | UnknownUser | Oracle CPU for the Oracle 500 user performance test |
| |
Oracle_DiskBusy.png | manage | 216.9 K | 2021-10-13 - 12:53 | UnknownUser | Oracle Disk Busy for the Oracle 500 user performance test |
| |
Oracle_RM_CPU.png | manage | 210.1 K | 2021-10-13 - 12:51 | UnknownUser | RM CPU for the Oracle 500 user performance test |
| |
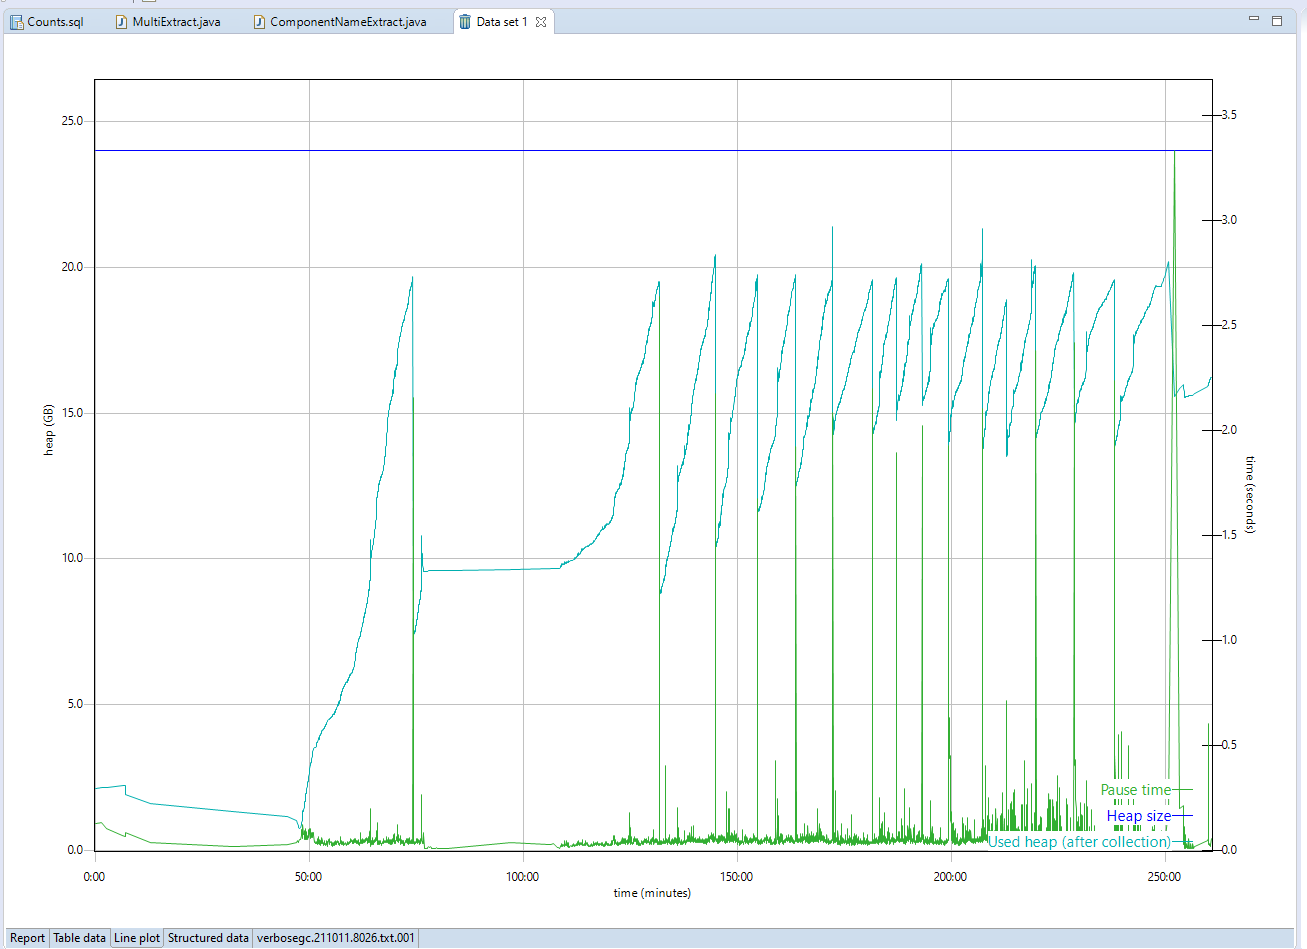
Oracle_RM_JVM.png | manage | 68.3 K | 2021-10-13 - 12:52 | UnknownUser | RM JVM memory mangement for the Oracle 500 user performance test |
| |
Oracle_Transaction.png | manage | 98.4 K | 2021-10-13 - 12:50 | UnknownUser | Large Transaction times of the Oracle 500 user performance test |
| |
PABoolEnumCombo.png | manage | 10.3 K | 2021-11-04 - 14:58 | VaughnRokosz | A view showing attribute columns filtered on a combination of Bool adn Enum values |
| |
PAMultiEnumFilter.png | manage | 9.2 K | 2021-11-04 - 14:59 | VaughnRokosz | A view showing attribute columns filtered on multiple enums |
| |
ViewPA4EnumFilterAllArtifacts.png | manage | 12.0 K | 2021-11-04 - 16:24 | VaughnRokosz | A view showing attribute columns filtered on 4 enums in the all artifacts view |
Contributions are governed by our Terms of Use. Please read the following disclaimer.
Dashboards and work items are no longer publicly available, so some links may be invalid. We now provide similar information through other means. Learn more here.