7.0 performance: IBM Engineering Requirements Management DOORS Next
Authors: VaughnRokosz, SkyeBischoff, HongyanHuo, LeeByrnes Build basis: 7.0Page contents
- Introduction
- Results from testing 10 million artifacts on Oracle
- Test results for a 10 million artifact repository (DB2)
- Results from testing 20 million artifacts on Oracle
- Database memory requirements
- Impact of global configuration size
- Impact of total artifact count
- Impact of user load
- Impact of project area size
- Tested hardware and software configurations
- Performance workloads
- Rate of execution
- Scenario details
- Initial operations: selecting and opening a module
- Adding link columns to a view
- Creating links
- Creating and delivering change sets
- Hovering over artifacts and links
- Artifact creation and editing
- Module history
- Copy/paste multiple artifacts
- Create a stream or a baseline
- Create a Microsoft Word document from a module
- Scroll through the artifacts in a module
- Upload a 4MB file
- Add a comment to an artifact
- Data shapes
- Oracle tuning
- DB2 tuning
- DOORS Next server tuning - application
- DOORS Next server tuning - operating system
- Summary of revisions
Introduction
This article presents the results of the performance testing conducted against the 7.0 release of IBM Engineering Requirements Management DOORS Next. This release greatly improves scalability and reliability, increasing the number of artifacts you can manage on a single server by almost an order of magnitude. Here is what you can expect from 7.0:- Support for up to 20 million artifacts on Oracle (10 million on DB2) - up from 2.3 million in 6.x.
- Support for global configurations containing up to 2500 contributions on Oracle (1250 on DB2).
- Higher user loads (up to 500 users) with less memory required on the DNG server.
- More resilience under stress (no more "rogue queries").
- Data limits in 7.0
- Changes to the data shape and workload for 7.0 testing
- How much memory to allocate to your database server for different repository sizes (Oracle and DB2).
- How the number of contributions in a global configuration impacts performance
- How the total number of artifacts impacts performance
- Test results for a 20 million artifact repository (Oracle)
- Test results for a 10 million artifact repository (DB2)
- Test results for a 10 million artifact repository (Oracle)
- What happens as the user load is increased past 500 users?
- How project area size impacts performance
Disclaimer
The information in this document is distributed AS IS. The use of this information or the implementation of any of these techniques is a customer responsibility and depends on the customer’s ability to evaluate and integrate them into the customer’s operational environment. While each item may have been reviewed by IBM for accuracy in a specific situation, there is no guarantee that the same or similar results will be obtained elsewhere. Customers attempting to adapt these techniques to their own environments do so at their own risk. Any pointers in this publication to external Web sites are provided for convenience only and do not in any manner serve as an endorsement of these Web sites. Any performance data contained in this document was determined in a controlled environment, and therefore, the results that may be obtained in other operating environments may vary significantly. Users of this document should verify the applicable data for their specific environment. Performance is based on measurements and projections using standard IBM benchmarks in a controlled environment. The actual throughput or performance that any user will experience will vary depending upon many factors, including considerations such as the amount of multi-programming in the user’s job stream, the I/O configuration, the storage configuration, and the workload processed. Therefore, no assurance can be given that an individual user will achieve results similar to those stated here. This testing was done as a way to compare and characterize the differences in performance between different versions of the product. The results shown here should thus be looked at as a comparison of the contrasting performance between different versions, and not as an absolute benchmark of performance.Data limits in 7.0
The table below summarizes the data scale limits for 7.0. You'll get the best performance by organizing your artifacts into many small components. (Updated June 2022): Also note: 7.0.2 iFix008 Performance Update: IBM Engineering Requirements Management DOORS Next| Oracle | DB2 | SQL Server* | |
| Repository size (artifact versions) | 20,000,000 | 10,000,000 | 2,300,000 |
| Project area size (artifact versions) | 3,800,000 | 2,000,000 | 200,000 |
| Total number of components | 4000 | 2500 | 500 |
| Max contributions in a GC | 2500 | 1250 | 25 |
| Components per project | 1000 | 215 | 100 |
| Artifacts per module | 10000 | 10000 | 10000 |
| Artifacts per folder | 10000 | 10000 | 10000 |
| Artifacts returned by a view | 10000 | 10000 | 10000 |
Repository and project area sizes are expressed in terms of the number of rows in the DNG artifacts table. In end-user terms, this would be the number of versions for requirements and modules. For example, when we say that Oracle can support 20 million artifact versions, we mean that the number of rows in the DNG artifacts table can be up to 20 million. You can get the artifact count from an existing repository by running a SQL query:
Oracle:   select count(*) from dngartifacts_db_artifact;
Db2: select count(*) from dngartifacts.db_artifact;
A more detailed breakdown of the artifacts in the test environment can be found in the Data shapes section.
Notes (Updated June 2022):
- *At the time of GA (General Availabilty) of 7.0 "We did not do performance testing with SQL Server in the 7.0 release, so we are not changing the recommended limits for SQL Server in 7.0."
- There have been additional updates on SQL Server performance where these benchmarks were invalidated and more realistic benchmarks were published. Thresholds for determining whether your DOORS Next instance has exceeded the capacity of Microsoft® SQL Server.
- These are not hard limits. However, if you grow past these limits, you may see response times increasing past 5 seconds.
- DB2 performance degrades as the size of the global configuration increases. Response times for some operations were high (more than 5 seconds) when running with a GC of 1250 on DB2, in a repository containing 10 million artifacts.
- For the Oracle sizing limits above, Oracle 19c was used.
Changes to the data shape and workload for 7.0 performance tests
We have greatly increased the complexity of data used in 7.0 testing, as compared with performance tests on prior releases. This was in part motivated by the order of magnitude improvement in the number of supported artifacts in 7.0, but it was also motivated by customer feedback on data shape, artifact counts, and use cases. This testing is the most complex configuration attempted so far in ELM, and reflects typical usage patterns for fine-grained components in global configurations. The changes include:- All use cases execute within the context of global configurations.
- Global configurations in 7.0 are 100 times larger than in previous tests (up to 2500 contributions)
- Use cases include link creation and views with link columns
- Editing simulations involve more changes (50 changes per deliver vs 1 change in 6.x)
- Artifacts are organized into many small components, with 4 times more components used in 7.0 (2100 vs. 500 in 6.x testing)
Architectural changes
For 7.0, we have greatly increased the number of artifacts that could be managed by a single server, and we have improved the resiliency of the server when under stress. These improvements were made possible by exploiting the capabilities of the relational database server. Prior to the 7.0 release, DOORS Next stored information about requirements in an index that lived on the DOORS Next server. This index was built using a schema-less, triple-based technology called Jena. Jena allowed the DOORS Next server to query against the index in a flexible way using a semantic query language called SPARQL. Unfortunately, Jena became a bottleneck as deployments grew in size, and the limitations of Jena were the reason that 6.x and prior releases were limited to 2.3 million requirements or less. Some of the specific problems with Jena included:- High memory requirements. Jena performs best when the entire index is cached in memory. This often meant that a DOORS Next server would need 128G or more of RAM.
- Inefficient query scoping. Jena does little optimization of SPARQL queries, and so some queries would end up processing far more artifacts than necessary. This was especially true for queries involving links, or views built in the "All artifacts" section of the UI. Even queries that returned only a few results might need to iterate over millions of irrelevant hits, leading to query timeouts.
- Concurrency issues leading to server instability. Jena uses a many-reader, one-writer model. While read queries are in progress, write transactions are stored in a journal. The journal grows until there is a quiet period when there are no reads in progress, and at that point, the journal is replayed into the main Jena index. The overhead of the journal gets higher over time, and so if there are very long read transactions (e.g. because of inefficient scoping) or if there are just lots of shorter queries always running (e.g. because there are lots of users), performance gets steadily worse. We refer to this as the Jena read/write bottleneck.
- Lower memory requirements for the DNG server. Our tests used systems with 32G of RAM, and this was sufficient for 500 user workloads executing against repositories with 20,000,000 requirements. DOORS Next is now similar to the other ELM applications in terms of its system requirements.
- Sophisticated SQL query optimization. Relational databases have sophisticated optimizers which minimize the number of rows that need to be processed, even for complex joins, and database indexes provide additional optimizations. The net result of using SQL is greatly improved scoping so that queries iterate through the smallest possible set of rows.
- Improved stability under load. Relational databases like DB2 and Oracle are designed for parallel processing from the ground up, unlike Jena. In 7.0, there is no equivalent of a rogue query that will bring down the server, as was possible with Jena.
Results from testing 10 million artifacts on Oracle
This section summarizes the results of a 500 user test against an Oracle configuration with 10 million artifacts, using a global configuration with 2500 contributions. In these tests, most operations complete in under 1 second; the exceptions are listed below. General observations:- JTS CPU usage is negligible
- Oracle CPU usage is low, while disk utilization is moderate
- RM CPU usage is moderate
| Operation | Time (ms) |
| Add link columns to a view | 4,288 |
| Hover over a link in the "Link to" column of a view | 4,127 |
| Select "OK" to discard a changeset with 50 changes | 2,473 |
| Hover over an artifact | 2,235 |
| Show module history | 2,214 |
| Select "OK" to discard a changeset with 10 changes | 2,191 |
| Open Module (10000 artifacts) | 2,015 |
| Select the "Artifact Links" tab in an artifact | 1,905 |
| Insert a new artifact into a view | 1,815 |
| Upload a 4 MB file | 1,550 |
| Select the "Discard a changeset" menu | 1,466 |
| Select "OK" to create a link | 1,347 |
| Open Module (1500 artifacts) | 1,208 |
| Select a module in the "Create links" dialog | 1,063 |
| Select "OK" to create a changet set | 1,024 |
Some of the more complex operations (creating streams or baselines, delivering change sets, or creating reports from modules) can take longer - response times for the complex operations are listed below.
| Operation | Time (ms) |
| Create a Word document from a module | 33,605 |
| Create a stream | 16,263 |
| Select "Deliver" for a change set that includes 10 links | 15,178 |
| Select "Deliver" for a change set that includes 50 changes | 11,049 |
| Select "Deliver" for a change set that includes 10 changes | 10,834 |
| Finish delivering a change set that includes 10 links | 7,999 |
| Finish delivering a change set that includes 10 changes | 7,145 |
| Paste multiple artifacts into a module | 7,111 |
| Finish delivering a change set that includes 50 changes | 7,066 |
| Create a baseline | 4,266 |
About this test:
- Number of simulated users: 500
- Test environment 2
- Standard performance workload
- RM server CPU: 23%
- JTS server CPU: .4%
- Oracle CPU: 9.8%
- Oracle disk busy: 53%
- Oracle reads per second: 268
- Oracle MEMORY_TARGET: 48g
- Number of requirements: 9,447,009
- Number of versions: 58,106,678
- Number of contributions in a global configuration: 2500
- jazz.net work item: 500817: Oracle 10m (SoftLayer)
Test results for a 10 million artifact repository (DB2)
This section summarizes the results of a 500 user test against a DB2 configuration with 10 million artifacts, using a global configuration with 1250 contributions. This configuration is the maximum recommended size for DB2 in 7.0. General observations- CPU usage on the DNG server is moderate
- Disk usage on the DB2 server is low
- CPU usage on the JTS server is negligible
- Please refer to the DB2 and DNG tuning sections - some configuration parameters need to be adjusted to achieve this level of performance.
| Operation | Time (ms) |
| Add links columns to a module view | 5526 |
| Insert an artifact into a module | 2844 |
| Show module history | 5466 |
| Click on "Discard a change set" to discard 10 changes | 4640 |
| Click on "Discard a change set" to discard 50 changes | 5136 |
| Select "OK" in the Create Links dialog | 2110 |
| Open a random module | 1615 |
| Open a module (1500 artifacts) | 1608 |
| Select "OK" in the Upload File dialog | 2761 |
| Open a module (500 artifacts) | 1429 |
| Open a module (10,000 artifacts) | 3162 |
| Hover over a link in a module view | 2024 |
| Select "Done" after editing an artifact | 2394 |
| Select "Create" in the Create Change set dialog | 1528 |
| Select a random artifact in a module | 1423 |
| Hover over an artifact in a module view | 1538 |
| Save a comment | 1709 |
| Select the "Create->Upload Artofact…" menu | 1325 |
| Select the target folder for an upload | 1322 |
| Open the configuration menu | 1084 |
The more complex operations (creating streams or baselines, delivering change sets, or creating reports from modules) can take longer - response times for the complex operations are listed below.
| Operation | Time (ms) |
| Create a Word document from a module | 79887 |
| Create a stream | 19272 |
| Select "Deliver Change Set" for a change set with 10 links | 14920 |
| Select "Deliver Change Set" for a change set with 10 changes | 11240 |
| Select "Deliver Change Set" for a change set with 50 changes | 11007 |
| Finish delivering a change set that includes 10 links | 9312 |
| Copy/paste for multiple artifacts in a module | 9603 |
| Finish delivering a change set that includes 50 changes | 8503 |
| Finish delivering a change set that includes 10 changes | 8510 |
| Create a baseline | 4021 |
About this test:
- Test environment 4
- Standard performance workload
- Number of contributions in a global configuration: 1250
- % disk busy on the DB2 server: 20%
- DNG server CPU usage: 64%. Note that CPU usage is higher in this test environment because the DNG server has only 16 processors. The other test environments use 32 processors.
- Repository size: 10 million artifacts (see data shape details)
- Additional details on jazz.net: 10m DB2: additional runs with tuning
Results from testing 20 million artifacts on Oracle
This section summarizes the results of a 500 user test against a configuration with 20 million artifacts. Common browse and edit operations complete in under 1 second; the exceptions are listed below. General observations:- JTS CPU usage is negligible
- Oracle CPU usage is low, while disk utilization is moderate (63%)
- RM CPU usage is moderate (under 25%)
| Operation | Time (ms) |
| Add link columns to a view | 2920 |
| Discard a changeset containing 50 changes | 2581 |
| Hover over a link in the "Link to" column of a view | 2432 |
| Open a module (10,000 artifacts) | 2151 |
| Show module history | 2045 |
| Upload a 4 MB file | 1579 |
| Insert an artifact into a module view | 1570 |
| Discard a changeset containing 10 changes | 1458 |
| Hover over an artifact | 1410 |
| Select "OK" to create a change set | 1236 |
| Select "OK" to create a link | 1197 |
| Select the "Artifact Links" tab in an artifact | 1092 |
| Open a module (200 artifacts) | 1019 |
Some of the more complex operations (creating streams or baselines, delivering change sets, or creating reports from modules) can take longer - response times for the complex operations are listed below.
| Operation | Time (ms) |
| Create a Word document from a module | 34006 |
| Create a stream | 20187 |
| Select "Deliver" for a change set that includes 10 links | 15393 |
| Select "Deliver" for a change set that includes 10 changes | 11112 |
| Select "Deliver" for a change set that includes 50 changes | 11104 |
| Finish delivering a change set that includes 10 links | 8281 |
| Paste multiple artifacts into a module | 7812 |
| Finish delivering a change set that includes 50 changes | 7323 |
| Finish delivering a change set that includes 10 changes | 7315 |
| Create a baseline | 4560 |
About this test:
- Number of simulated users: 500
- Test environment 2
- Standard performance workload
- RM server CPU: 22%
- JTS server CPU: .4%
- Oracle CPU: 6.7%
- Oracle disk busy: 63%
- Oracle reads per second: 327
- Oracle MEMORY_TARGET: 48g
- Number of requirements: 18,756,265
- Number of versions: 118,928,959
- Number of contributions in a global configuration: 2500
- jazz.net work item: 500766: Oracle 20m tests (SoftLayer)
Database memory requirements
Oracle memory vs. repository size
We ran a series of tests to determine how much Oracle memory was required for different repository sizes. Here's a summary of what we found.- Larger deployments require a larger Oracle buffer cache. A good rule of thumb is to set the buffer cache size to be 5-10% of the size of the RM tablespace.
- Performance is better with large buffer caches, but there is a point of diminishing returns. Beyond that point, the amount of improvement is small.
- When the buffer cache is too small, page response times degrade significantly. Disk utilization on the database server can reach 100%.
- A deployment with 2 million artifacts required a buffer cache of 5G; a deployment with 20 million artifacts required a buffer cache of 25G. There is a linear relationship between tablespace size and optimal buffer cache size.
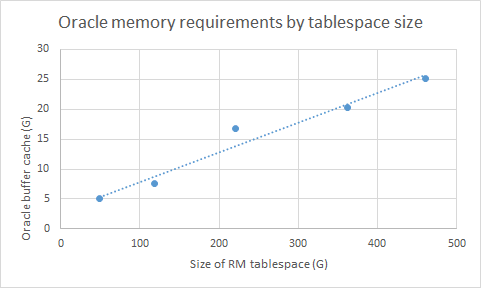
| Artifacts (millions) | RM tablespace (G) | Buffer cache (G) | % of tablespace size |
|---|---|---|---|
| 2 | 49 | 5 | 10.2 |
| 5 | 118 | 7.5 | 6.4 |
| 10 | 221 | 16.7 | 7.6 |
| 15 | 362 | 20.3 | 5.6 |
| 20 | 460 | 25.2 | 5.6 |
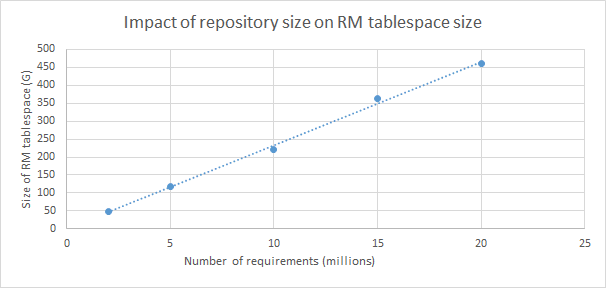
The following graph shows the relationship between the number of requirements and the size of the RM tablespace for our specific datashape.
Methodology
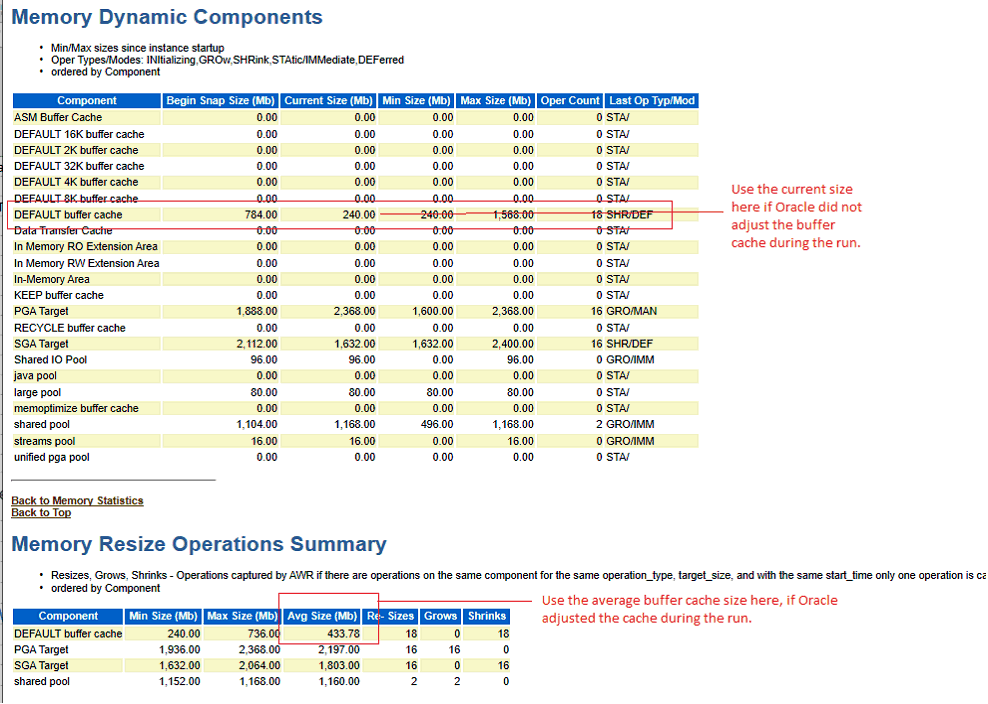
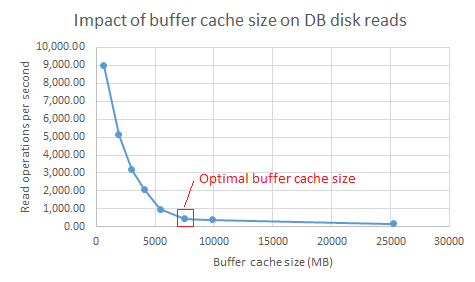
There is a certain amount of judgement involved in determining the optimal buffer cache size. This section will describe the test and analysis methodology. These tests were conducted on test environment 1 and test environment 2. The results were the same for both test environments. We ran the standard 500 user workload for several different settings of the Oracle MEMORY_TARGET parameter (Oracle's automatic memory management was enabled). We collected operating system metrics during the test, and also captured an AWR report for a 1 hour period (at peak load). For each run, we extracted the number of Read IO requests per second and the average buffer cache size from the AWR report (see screenshots below).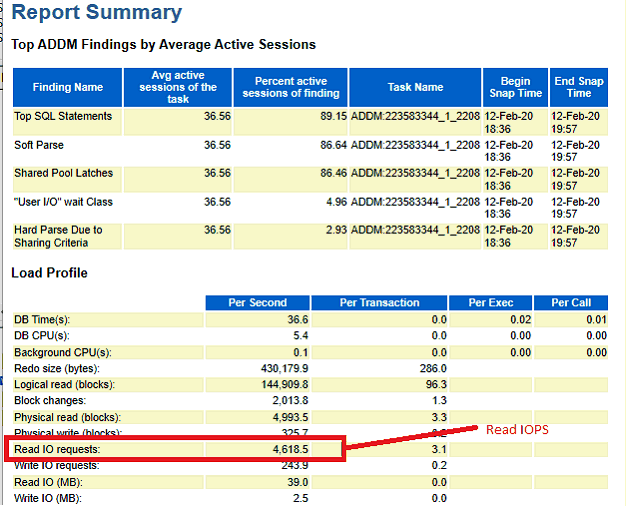
 We then graphed the buffer cache and read I/O values.
We also looked at response times and disk utilization. We used the following set of guidelines to determine the optimal buffer cache size:
 - Disk utilization of under 75%
- No significant degradation of response times
- 500 read operations per second or less
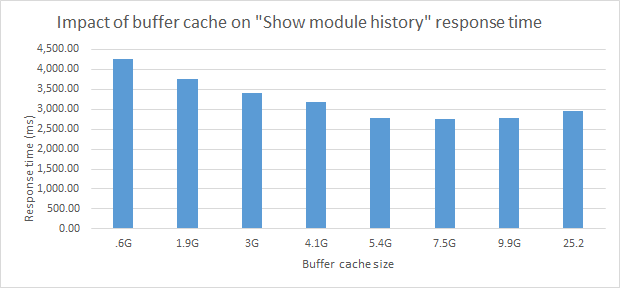
 Here's an example of how response times vary as the buffer cache is increased. For this use case, the point of diminishing returns is 5.4G (compared with 7.5G in the I/O graph). In cases like this where the I/O and response time graphs gave different results, we used the larger of the values to be conservative.
Additional information
The Oracle Database Performance Tuning guide discusses buffer cache tuning. For more details on the test runs, please refer to the following work items on jazz.net:- 499578: 2m Oracle SL - tests to vary Oracle memory
- 499876: 5m Oracle SL - tests to vary Oracle memory
- 500488: 10m Oracle RTP - tests to vary Oracle memory
- 500487: 15m Oracle SL - tests to vary Oracle memory
- 497119: 20m Oracle SL - test runs to vary Oracle memory
DB2 memory vs. repository size
We ran a series of tests to determine how much DB2 memory was required for different repository sizes. Here's a summary of what we found.- Larger deployments require a larger bufferpool. A good rule of thumb is to set the bufferpool to be 10% of the size of the RM database.
- Performance is better with large bufferpool, but there is a point of diminishing returns. Beyond that point, the amount of improvement is small.
- When the bufferpool is too small, page response times degrade significantly. Disk utilization on the database server can reach 100%.
- A deployment with 2 million artifacts required a bufferpool of 4G; a deployment with 10 million artifacts required a bufferpool of 14G. There is a linear relationship between tablespace size and optimal bufferpool size.
- The bufferpool size is not dependent on the number of contributions in a global configuration.
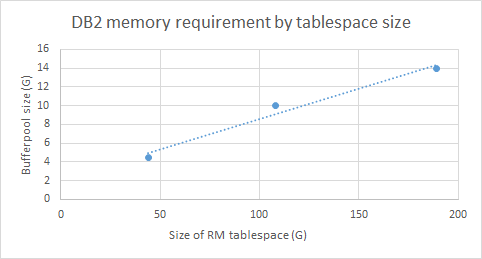 These tests were conducted on test environment 4.
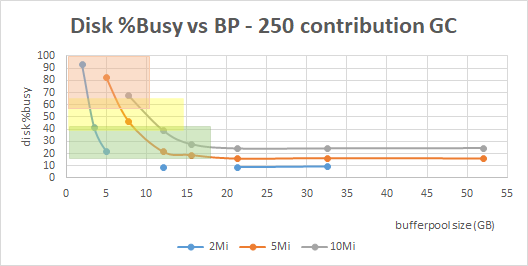
To find the optimal bufferpool size, we ran the standard 500 user workload for several different bufferpool settings, and collecting disk utilization data for each run. We graphed the disk busy % against bufferpool size, and found the point in the curve where it starts to flatten out. The bufferpool size at that point is the optimal size.
The results for different repository sizes (using a global configuration with 250 contributions) is shown below. The "red zone" is where we see degraded page performance. In the yellow zone, the page performance is not impacted but disk utilization is high. Bufferpools in the yellow zone may not sustain peak loads. The green zone is recommended for optimal performance (4G for 2 million, 10G for 5 million, and 14G for 10 million).
 For more details on the test runs that were used to construct these charts, please refer to the following work item on jazz.net: DNG 10Mi Small and Medium GCs - DB2 performance vs Database_Memory, bufferpool, and disk caching.
Impact of global configuration size
As a general rule, response times increase as the number of contributions to a global configuration (GC) increases. This increase is small on Oracle, but is more significant on DB2. Based on the tests described below, we are recommending that you limit your global configurations to 250 contributions or less on DB2.Impact of global configuration size on Oracle
Response times increase as the number of contributions to a global configuration (GC) increases, but this increase in response time is often small - 1 second or less. Additionally, the CPU utilization on the DNG server increases as GC size increases. You can see this trend in the chart below for the common browse and edit operations, for tests in a repository with 10 million artifacts. This chart compares response times for operations executed in global configurations that contain 250, 1250, and 2500 contributions. This has been filtered to show only those operations that degraded by more than one second when comparing the 250 and 2500 GCs. But the pattern is consistent across most operations.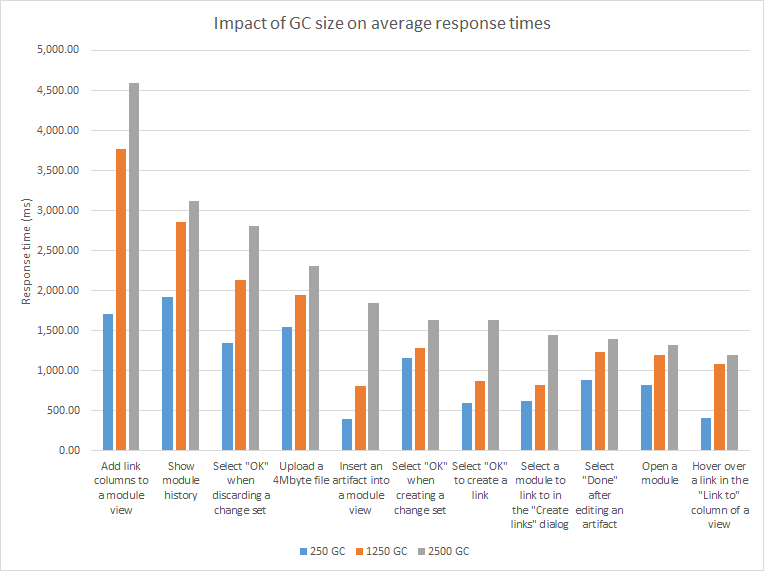 Opening views that include link columns are impacted the most. This is because the SQL queries to look up links must join across all of the streams that are part of the global configuration.
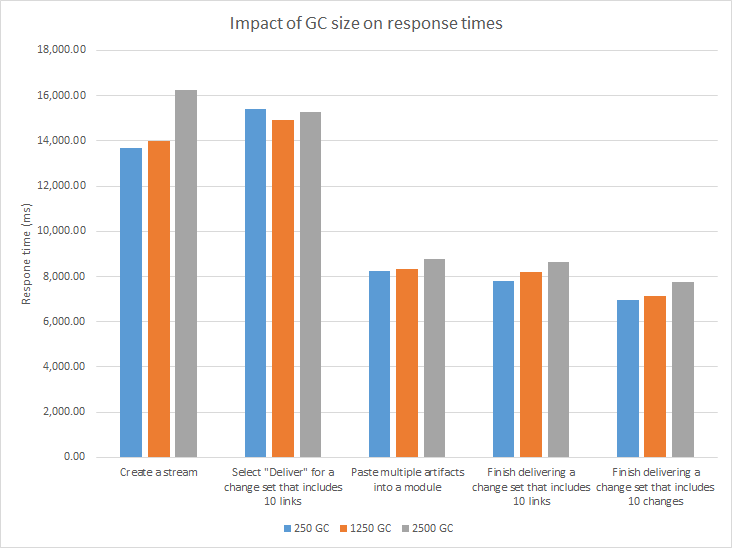
The more complex operations (creating streams or baselines, delivering change sets, or creating reports from modules) are less sensitive to GC size (see chart below).
 CPU utilization for the 3 GC sizes is shown below. More CPU is used on the DNG server for larger GCs.
 About this test:
 - Test environment 3
- Standard performance workload
- Repository size: 10 million artifacts (see data shape details)
- Additional details on jazz.net: 499620: Oracle 10 million repository tests
Impact of global configuration size on DB2
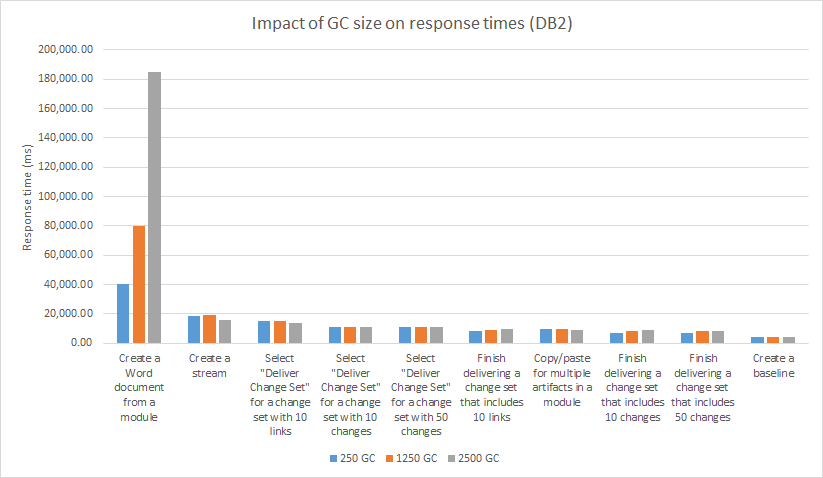
When using DB2, the number of contributions in a global configuration has a large impact on response times. A few of the use cases degrade by 2-3 seconds when comparing GCs with 250 contributions to GCs with 1250 contributions. There can be an additional degradation of 1 second when comparing GCs with 1250 contributions to those with 2500 contributions. CPU usage on the RM server increases as the GC size increases. Note that the DNG server and the DB2 server needed to be tuned to get these results. The configuration cache size should be increased for the DNG server, and auto runstats should be disabled on the DB2 server. We recommend keeping the number of GC contributions under 1250 when using DB2. And you should be aware that there are a few use cases that will be slow at 1250 and above (views with link columns, inserting an artifact into a module). Here is a comparison for common browse and edit operations. The chart includes operations that exceed 1 second; this is about 30% of the measured operations. For the operations that are under 1 second, the pattern is similar, but the degradation is smaller (250ms - 500ms).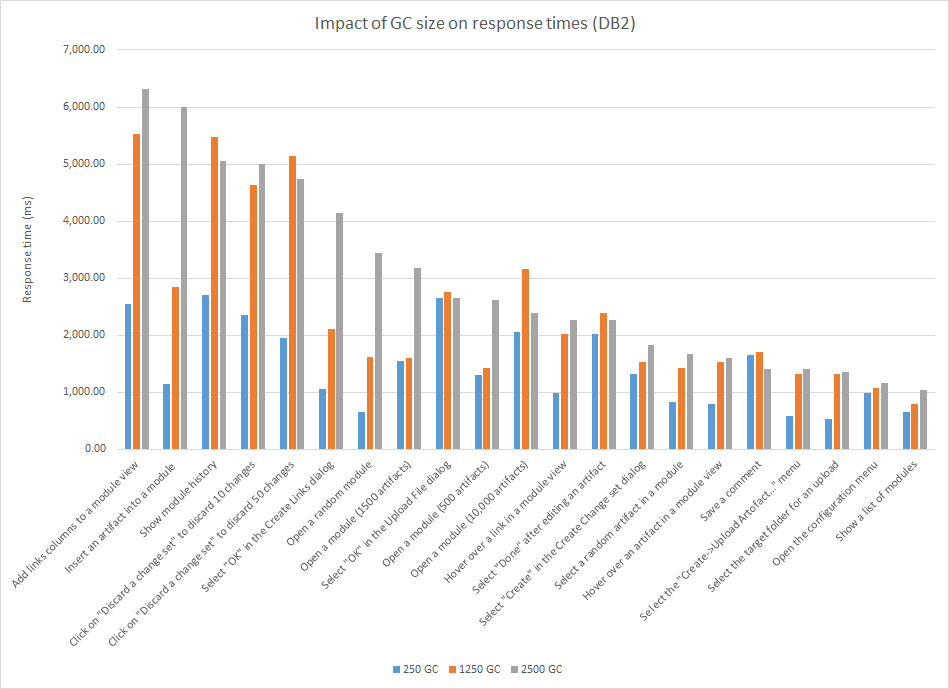 The more complex operations (creating streams or baselines, delivering change sets, or creating reports from modules) are less sensitive to GC size (see chart below). The one exception is creating a Word document from a module, which increases by 40 seconds when executed in a GC with 1250 contributions (and takes 180 seconds when executed in a GC with 2500 contributions).
 The CPU usage on the DNG server increased from 53% (250 contribution GC) to 64% (1250 contribution GC). The DB2 server load did not increase.
About these tests:
 - Test environment 4
- Standard performance workload
- Repository size: 10 million artifacts (see data shape details)
- Additional details on jazz.net: 10m DB2: additional runs with tuning
Impact of total artifact count
This section looks at how the number of artifacts impacts response times for our standard 500 user workload.Impact of total artifact count on Oracle
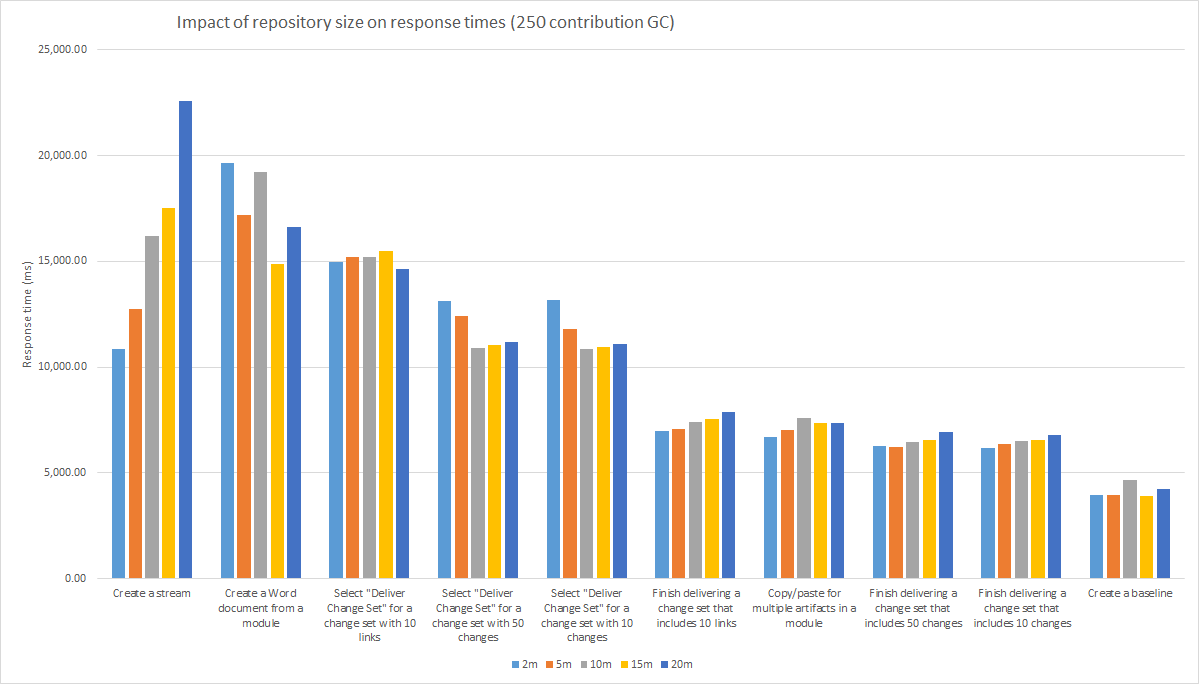
As the number of artifacts grows, you must increase the size of the Oracle buffer cache, as described in an earlier section. For a system with sufficient memory, there is a slight increase in response times across most use cases as the repository grows, but performance is not that sensitive to repository size. The majority of the operations remain under 1 second even for a repository with 20 million artifacts, and the difference in times between a 2 million and a 20 million artifact repository is typically less than 1 second. The following chart compares the response times of common browse and edit operations across different repository sizes. These operations use a GC with 250 contributions. The results have been filtered to include only those operations that take more than 1 second.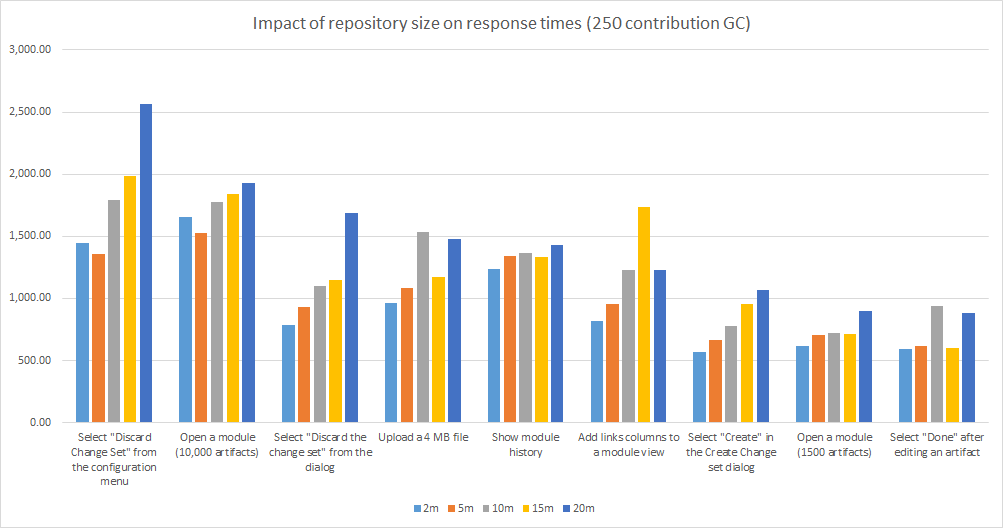 The more complex operations (creating streams or baselines, delivering change sets, or creating reports from modules) are not very sensitive to the repository size (see chart below). The exception is stream creation, which does get slower as the number of artifacts increases.
 About these tests:
 - Test environment 2
- Standard performance workload
- Repository size: from 2 to 20 million artifacts (see data shape details)
- Additional details on jazz.net: 501030: Oracle 2m tests (SoftLayer)
- Number of contributions in a global configuration: 250
Impact of total artifact count on DB2
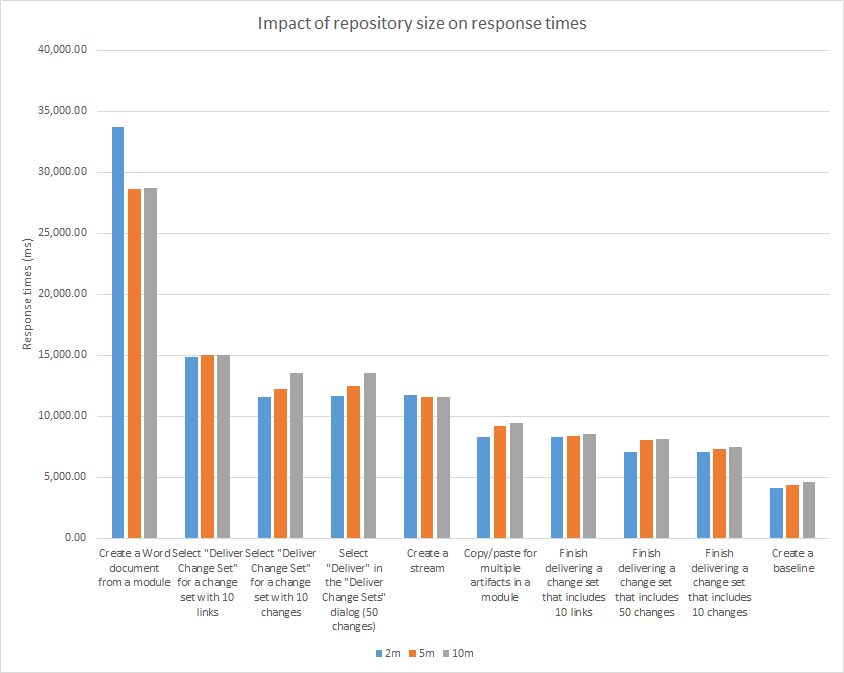
As the number of artifacts grows, you must increase the size of the DB2 buffer pool for RM (as described in an earlier section). For a system with sufficient memory, there is a slight increase in response times across most use cases as the repository grows, but performance is not that sensitive to repository size. The majority of the operations remain under 1 second for a repository with 10 million artifacts, and the difference in times between a 2 million and a 10 million artifact repository is typically less than 500 milliseconds. In fact, the standard deviation is high enough that we can't conclude with certainty that there is a statistically significant degradation. The following chart compares the response times of common browse and edit operations across different repository sizes. These operations use a GC with 250 contributions. The results have been filtered to include only those operations that take more than 1 second.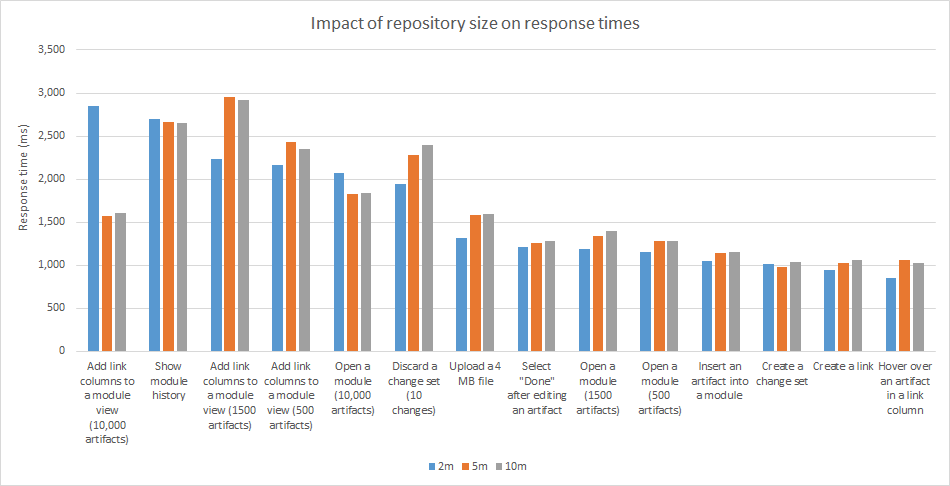 The more complex operations are not very sensitive to repository size. The exception is the operations involved in delivering a large change set; these increased by 15% between the 2m and the 10m repository.
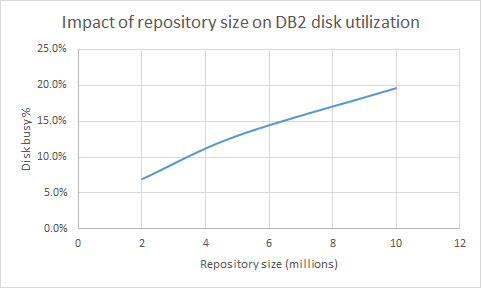
 There is a slight increase in CPU usage on the RM server as the repository size grows (51% at 2m and 53% at 10m). Disk utilization on the DB2 server increases moderately when moving from 2 million to 10 million:
 About these tests:
 - Test environment 4
- Standard performance workload
- Repository size: 10 million artifacts (see data shape details)
- Additional details on jazz.net: Test/Benchmark DNG7RC5: DB2 on softlayer systems - 2Mi Small GC baseline, and Summary & comparisons of 10Mi vs 5Mi vs 2Mi rundata with fixed transactions
Impact of user load
User load impact: 20 million artifacts, 2500 contribution GC
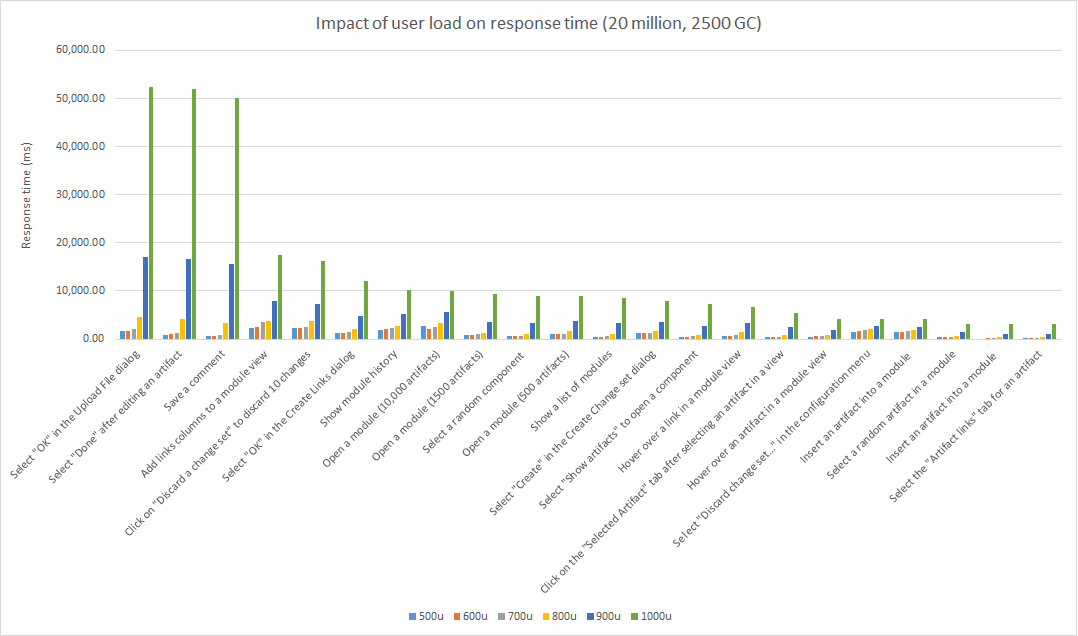
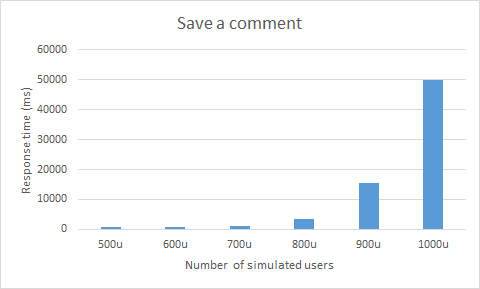
This section looks at what happens when the user load is increased from 500 users to 1000 users. The test was executed in a Oracle repository with 20 million artifacts, using a global configuration with 2500 contributions. The user load started at 500, and increased to 1000 in increments of 100. Each stage runs for 1 hour. Summary of results:- Response times are stable up to (and including) 700 users. At 800 users, response times start to degrade - so 700 users is the limit for this test.
- 7.0.1 update: Response times are stable up to 1000 users in 7.0.1.
- CPU usage on the DNG server increases as user load increases, but CPU was not a bottleneck.
- Disk usage on the Oracle server is close to 90%, but this is not a bottleneck.
- Response times increase at 800 users due to a bottleneck in the DOORS Next server code.
 Here's a chart for just one use case (saving a comment).
 About this test:
 - Number of simulated users: 500-1000
- Test environment 2
- Standard performance workload
- Oracle MEMORY_TARGET: 48g
- Number of requirements: 18,756,265
- Number of versions: 118,928,959
- Number of contributions in a global configuration: 2500
- jazz.net work item: Run at higher user loads (20m Oracle)
User load impact: 10 million artifacts, 1250 contribution GC
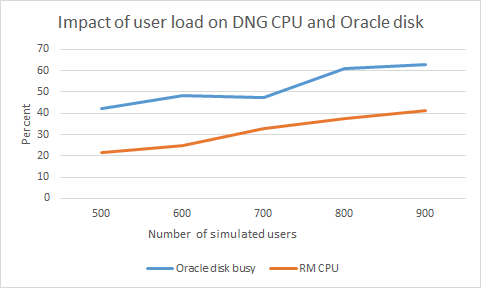
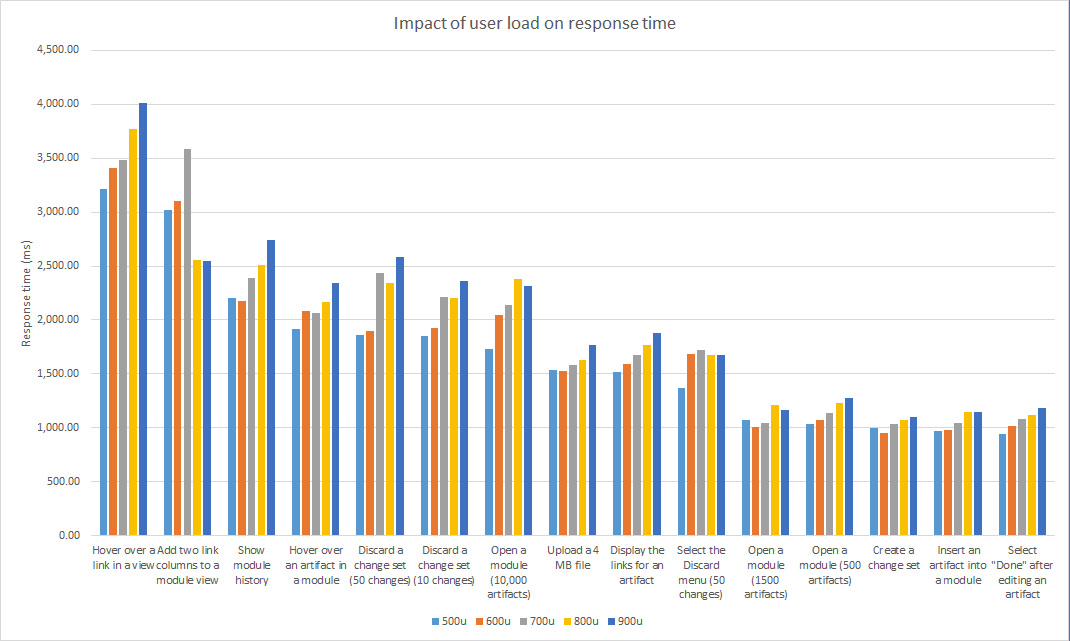
This section looks at what happens when the user load is increased from 500 users to 900 users. The test was executed in a Oracle repository with 10 million artifacts, using a global configuration with 1250 contributions. The user load started at 500, and increased to 900 in increments of 100. Each stage runs for 1 hour. Summary of results:- There is a slight increase in response time when comparing 900 users to 500 users, but the increase is small (.5 seconds or less). The system could handle 900 users without an issue.
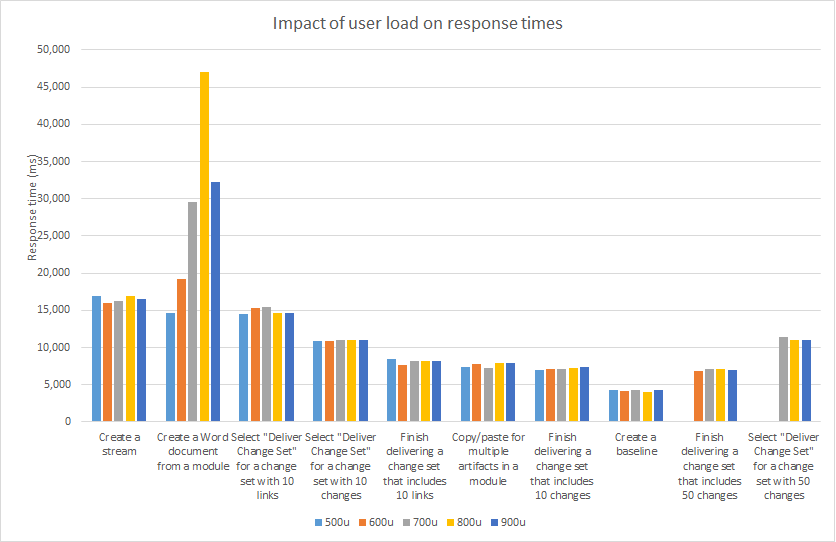
- There is one scenario that slows down significantly as user load increases: Creating a Word document from a module. This is 30 seconds slower at 900 users.
- Disk usage on the Oracle server increases as user load increases
- CPU usage on the DNG server increases as user load increases
 Here are the response times for common browse and edit operations for each user stage.
 Here are the response times for the more complex transactions (creating streams or baselines, delivering change sets, or creating reports from modules). The "Create Word document from module" scenario is the only one that is strongly affected by the user load.
 About this test:
 - Number of simulated users: 500-900
- Test environment 2
- Standard performance workload
- Oracle MEMORY_TARGET: 48g
- Number of requirements: 9,447,009
- Number of versions: 58,106,678
- Number of contributions in a global configuration: 1250
- jazz.net work item: Run at higher user loads (10m Oracle)
Impact of project area size
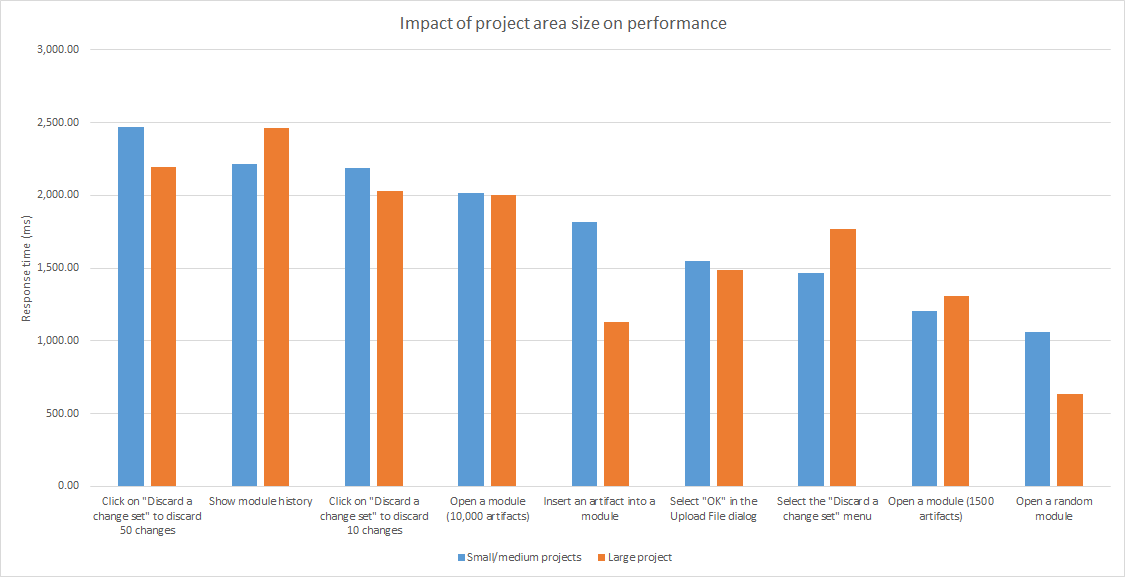
This section looks at the performance impact of the overall size of the project area. We compared response times for the standard 500 user workload in two different cases:- Selecting random components in the small (200,000 artifacts) and medium (1 million artifacts) projects
- Selecting random components in the large (3.8 million artifacts) project.
 About this test:
- Test environment 2
- Standard performance workload
- Repository size: 10 million artifacts (see data shape details)
- Additional details on jazz.net: Impact of project area size (10m Oracle)
- Number of contributions in a global configuration: 2500, with two different global configurations. One GC only opens components in small and medium projects, and the other only opens components in the large project.
Tested hardware and software configurations
Environment 1
| Role | Server | Number of machines | Machine type | Processor | Total processors | Memory | Storage | Network interface | OS and version |
|---|---|---|---|---|---|---|---|---|---|
| Proxy Server | IBM HTTP Server and WebSphere Plugin | 1 | IBM System x3550 M3 | 2 x Intel Xeon X5667 3.07 GHz (quad-core) | 8 | 16 GB | RAID 5 – 279GB SAS Disk x 4 | Gigabit Ethernet | Red Hat Enterprise Linux Server 7 (Maipo) |
| RM server | Embedded WebSphere Liberty | 1 | IBM System x3550 M4 | 2 x Intel Xeon E5-2640 2.5GHz (six-core) | 24 | 32 GB | RAID 5 – 279GB SAS Disk x 4 | Gigabit Ethernet | Red Hat Enterprise Linux Server 7 (Maipo) |
| Jazz Team Server and Global Configuration Server | Embedded WebSphere Liberty | 1 | IBM System x3550 M4 | 2 x Intel Xeon E5-2640 2.5GHz (six-core) | 24 | 32 GB | RAID 5 – 279GB SAS Disk x 4 | Gigabit Ethernet | Red Hat Enterprise Linux Server 7 (Maipo) |
| Database | Oracle 19c | 1 | IBM System SR650 | 2 x Xeon Silver 4114 10C 2.2GHz (ten-core) | 40 | 64 GB | RAID 10 – 900GB SAS Disk x 16 | Gigabit Ethernet | Red Hat Enterprise Linux Server 7 (Maipo) |
Storage details are below. See Disk benchmarking for more details on I/O benchmarking.
| RAID controller | Lenovo RAID 930-16i 4GB flash |
| RAID mode | RAID10 |
| RAM (G) | 64 |
| Total disks | 14 |
| Spans | 7 |
| Disks per span | 2 |
| Drive speed (Gbps) | 12 |
| Strip size (Kbyte) | 256 |
| Logical sector size (bytes) | 512 |
| Caching mode | Write-back |
| Disk type | 900G Lenovo ST900MP0146 |
| Spin rate (rpm) | 15000 |
| Calibrate_io - IOPS | 6896 |
| Calibrate_io - Mbps | 449 |
| SLOB IOPS | 22581 |
| Sysbench random r/w | |
| * IOPS | 989 |
| * Read MiB/s | 4.1 |
| * Write MiB/s | 2.7 |
| Sysbench sequential read | |
| * IOPS | 15280 |
| * Read MiB/s | 239 |
Additional system settings:
- -Xmx20G -Xms20G -Xmn5G -Xcompressedrefs -Xgc:preferredHeapBase=0x100000000 -XX:MaxDirectMemorySize=1G
- -Dcom.ibm.rdm.configcache.expiration=5040
- -Dcom.ibm.rdm.configcache.size=5000
- In rm/admin and gc/admin:
- Maximum number of contributions per composite: 5000
- JDBC connection pool: 400
- RDB Mediator pool: 400
- Maximum outgoing HTTP connections per destination: 400
- Maximum outgoing HTTP connections total: 500
- In rm/admin:
- View query threadpool size override: 500
Environment 2
| Role | Server | Number of machines | Machine type | Total processors | Memory | Storage | Network interface | OS and version |
|---|---|---|---|---|---|---|---|---|
| Proxy Server | IBM HTTP Server and WebSphere Plugin | 1 | Virtual machine - 4 2Ghz CPUs | 4 | 16 GB | Virtual | Gigabit Ethernet | Redhat EL 7.0-64 |
| RM server | Embedded WebSphere Liberty | 1 | Virtual machine - 16 2Ghz CPUs) | 32 | 32 GB | Virtual | Gigabit Ethernet | Redhat EL 7.0-64 |
| Jazz Team Server and Global Configuration Server | Embedded WebSphere Liberty | 1 | Virtual machine - 16 2Ghz CPUs) | 32 | 32 GB | Virtual | Gigabit Ethernet | Redhat EL 7.0-64 |
| Database | Oracle 19c | 1 | 2x 2.6GHz Intel Xeon-Broadwell (E5-2690-V4) | 56 | 128 GB | RAID 10 – 600G Seagate ST3600057SS x 32 | Gigabit Ethernet | Redhat EL 7.6-64 |
Storage details are below. See Disk benchmarking for more details on I/O benchmarking.
| RAID controller | AVAGO MegaRAID SAS 9361-8i |
| RAID mode | RAID10 |
| RAM (G) | 128 |
| Total disks | 32 |
| Spans | 8 |
| Disks per span | 4 |
| Drive speed (Gbps) | 6 |
| Strip size (Kbyte) | 64 |
| Logical sector size (bytes) | 512 |
| Physical sector size (bytes) | 512 |
| Caching mode | Write-back |
| Disk type | 600G Seagate ST3600057SS |
| Spin rate (rpm) | 15000 |
| Calibrate_io - IOPS | 14087 |
| Calibrate_io - Mbps | 1452 |
| SLOB IOPS | 16119 |
| Sysbench random r/w | |
| * IOPS | 1064 |
| * Read MiB/s | 4.4 |
| * Write MiB/s | 2.9 |
| Sysbench sequential read | |
| * IOPS | 30431 |
| * Read MiB/s | 475 |
Additional system settings:
- -Xmx20G -Xms20G -Xmn5G -Xcompressedrefs -Xgc:preferredHeapBase=0x100000000 -XX:MaxDirectMemorySize=1G
- -Dcom.ibm.rdm.configcache.expiration=5040
- -Dcom.ibm.rdm.configcache.size=5000
- In rm/admin and gc/admin:
- Maximum number of contributions per composite: 5000
- JDBC connection pool: 400
- RDB Mediator pool: 400
- Maximum outgoing HTTP connections per destination: 400
- Maximum outgoing HTTP connections total: 500
- In rm/admin:
- View query threadpool size override: 500
Environment 3
| Role | Server | Number of machines | Machine type | Processor | Total processors | Memory | Storage | Network interface | OS and version |
|---|---|---|---|---|---|---|---|---|---|
| Proxy Server | IBM HTTP Server and WebSphere Plugin | 1 | IBM System x3550 M3 | 2 x Intel Xeon X5667 3.07 GHz (quad-core) | 8 | 16 GB | RAID 5 – 279GB SAS Disk x 4 | Gigabit Ethernet | Red Hat Enterprise Linux Server 7 (Maipo) |
| RM server | Embedded WebSphere Liberty | 1 | IBM System x3550 M4 | 2 x Intel Xeon E5-2640 2.5GHz (six-core) | 24 | 32 GB | RAID 5 – 279GB SAS Disk x 4 | Gigabit Ethernet | Red Hat Enterprise Linux Server 7 (Maipo) |
| Jazz Team Server and Global Configuration Server | Embedded WebSphere Liberty | 1 | IBM System x3550 M4 | 2 x Intel Xeon E5-2640 2.5GHz (six-core) | 24 | 32 GB | RAID 5 – 279GB SAS Disk x 4 | Gigabit Ethernet | Red Hat Enterprise Linux Server 7 (Maipo) |
| Database | Oracle 19c | 1 | IBM System SR650 | 2 x Xeon Silver 4114 10C 2.2GHz (ten-core) | 40 | 64 GB | RAID 10 – 900GB SAS Disk x 16 | Gigabit Ethernet | Red Hat Enterprise Linux Server 7 (Maipo) |
Storage details are below. See Disk benchmarking for more details on I/O benchmarking.
| RAID controller | Lenovo RAID 930-16i 4GB flash |
| RAID mode | RAID10 |
| RAM (G) | 64 |
| Total disks | 14 |
| Spans | 7 |
| Disks per span | 2 |
| Drive speed (Gbps) | 12 |
| Strip size (Kbyte) | 256 |
| Logical sector size (bytes) | 512 |
| Physical sector size (bytes) | 4096 |
| Caching mode | Write-back |
| Disk type | 900G Lenovo ST900MP0146 |
| Spin rate (rpm) | 15000 |
| Calibrate_io - IOPS | 15452 |
| Calibrate_io - Mbps | 829 |
| SLOB IOPS | 24768 |
| Sysbench random r/w | |
| * IOPS | 969 |
| * Read MiB/s | 4.9 |
| * Write MiB/s | 2.7 |
| Sysbench sequential read | |
| * IOPS | 16828 |
| * Read MiB/s | 263 |
Additional system settings:
- -Xmx24g -Xmn4000m -Xcompressedrefs -Xgc:preferredHeapBase=0x100000000 -XX:MaxDirectMemorySize=1G
- -Dcom.ibm.rdm.configcache.expiration=5040
- -Dcom.ibm.rdm.configcache.size=2000
Environment 4
| Role | Server | Number of machines | Machine type | Total processors | Memory | Storage | Network interface | OS and version |
|---|---|---|---|---|---|---|---|---|
| Proxy Server | IBM HTTP Server and WebSphere Plugin | 1 | Virtual machine - 4 2Ghz CPUs | 4 | 16 GB | Virtual | Gigabit Ethernet | Redhat EL 7.0-64 |
| RM server | Embedded WebSphere Liberty | 1 | Virtual machine - 16 2Ghz CPUs) | 16 | 32 GB | Virtual | Gigabit Ethernet | Redhat EL 7.0-64 |
| Jazz Team Server and Global Configuration Server | Embedded WebSphere Liberty | 1 | Virtual machine - 16 2Ghz CPUs) | 16 | 32 GB | Virtual | Gigabit Ethernet | Redhat EL 7.0-64 |
| Database | DB2 11.1 | 1 | 2x 2.6GHz Intel Xeon-Broadwell (E5-2690-V4) | 56 | 128 GB | RAID 10 – 600G Seagate ST3600057SS x 32 | Gigabit Ethernet | Redhat EL 7.6-64 |
Storage details are below. See Disk benchmarking for more details on I/O benchmarking.
| RAID controller | AVAGO MegaRAID SAS 9361-8i |
| RAID mode | RAID10 |
| RAM (G) | 128 |
| Total disks | 32 |
| Spans | 8 |
| Disks per span | 4 |
| Drive speed (Gbps) | 6 |
| Strip size (Kbyte) | 64 |
| Logical sector size (bytes) | 512 |
| Physical sector size (bytes) | 512 |
| Caching mode | Write-back |
| Disk type | 600G Seagate ST3600057SS |
| Spin rate (rpm) | 15000 |
| Sysbench random r/w | |
| * IOPS | 1064 |
| * Read MiB/s | 4.4 |
| * Write MiB/s | 2.9 |
| Sysbench sequential read | |
| * IOPS | 30431 |
| * Read MiB/s | 475 |
We used the following configuration settings for the IBM HTTP Server:
| ThreadLimit | 100 |
| ServerLimit | 100 |
| StartServers | 2 |
| MaxClients | 2500 |
| MinSpareThreads | 250 |
| MaxSpareThreads | 2500 |
| ThreadsPerChild | 100 |
| MaxRequestsPerChild | 0 |
| Plugin: ServerIOTimeout | 9000 |
The JVM settings were:
- JTS: -Xmx16G -Xms16G -Xmn4G
- RM: -Xmx24G -Xms24G -Xmn6G
- JDBC connection pool: 400
- RDB Mediator pool: 400
Performance workloads
IBM® Rational® Performance Tester was used to simulate user activities. A Rational Performance Tester script was created for each use case. The scripts are organized by pages; each page represents a user action. Users were distributed into many user groups and each user group repeatedly runs one use case. The tests simulate 500 users, ramping up the users at the rate of 1 every 2 seconds. There is a settle period of 15 minutes, and then the tests collect data for 2 hours. The tests use an average think time of 30 seconds (this is the delay between the execution of operations). For 500 users, this results in an overall load of 15-20 logical operations per second (which is roughly 200 HTTP requests per second). This table shows the use cases and the number of users who were repeatedly running each script:| Use case | Description | % Of Users | Number of users |
|---|---|---|---|
| Scroll Module | Open a module and scroll through the contents | 16% | 80 users |
| Hover and edit | Hover over an artifact and then change its title | 9% | 45 users |
| Upload file | Create a new artifact by uploading a 4MB file | 4% | 20 users |
| Add a comment | Open an artifact in a module and add a comment | 4% | 20 users |
| Copy/Paste 25 | Perform bulk copy, paste and delete of 25 artifacts | 4% | 20 users |
| Create stream | Open a component and create a new stream | n/a | 1 user |
| Create baseline | Open a component and create a new stream | 2% | 10 users |
| Deliver Small Changeset in Module | Create 1 new artifact, 3 artifact edits, and 6 comments in a module and deliver changeset | 16% | 80 users |
| Discard Small Changeset in Module | Create 1 new artifact, 3 artifact edits, and 6 comments in a module and discard changeset | 9% | 45 users |
| Deliver Large Changeset in Module | Create 5 new artifact, 15 artifact edits, and 30 comments in a module and deliver changeset | 4% | 20 users |
| Discard Large Changeset in Module | Create 5 new artifact, 15 artifact edits, and 30 comments in a module and discard changeset | 4% | 20 users |
| Display Module History | Display the revisions and audit history of a module | 4% | 20 users |
| Create Microsoft Word Document | Create a Microsoft Word document from a module | 2% | 10 users |
| View DNG Cross Component Links | View query with links spanning multiple DNG components in the current GC configuration | 9% | 45 users |
| Hover Over Cross Component Link | Hover over a cross component link | 4% | 29 users |
| Link DNG Cross Component Artifacts | Create a new artifact link to a different component in the current GC configuration | 9% | 45 users |
Each of these use cases starts by logging in and navigating to the Global Configuration application and selecting a random GC of the appropriate size. Next, the tests expand the nodes in the GC hierarchy and select a random stream. Next, the tests open the list of modules and select a random module. After this point, the tests execute the operations for the given use case.
Rate of execution
When the workload reaches its peak of 500 users, it executes 16 operations per second (which is 163 HTTP transactions per second). The breakdown by use case (executions per hour) is shown in the table below.| Operation | Per hour |
| Browse components (GC) | 229 |
| Open dashboard (GC) | 228 |
| Expand 2nd level GC | 224 |
| Expand 3rd level GC | 220 |
| Expand 4th level GC | 220 |
| Open a component in the GC app | 227 |
| Open a GC stream | 226 |
| Open a random leaf node in a GC | 216 |
| Search for a global configuration | 228 |
| Initialization after login | 229 |
| Login to GC app | 230 |
| Login - Jazz Authorization Server | 230 |
| Select a random artifact | 3152 |
| Add links columns to a module view | 2149 |
| Select "Create" in the Create Change set dialog | 437 |
| Select "Create change set…" in the configuration menu | 439 |
| Open the configuration menu | 62 |
| Collapse a section in a module | 727 |
| Copy/paste for multiple artifacts in a module | 364 |
| Prepare for a paste of multiple artifacts | 364 |
| Create a baseline | 62 |
| Select "OK" in the Create Links dialog | 586 |
| Finish delivering a change set that includes 10 links | 66 |
| Open the configuration menu | 68 |
| Select a random artifact in a module | 598 |
| Select a random component | 590 |
| Select "Deliver Change Set" for a change set with 10 links | 68 |
| Select the "Artifact links" tab for an artifact | 600 |
| Select the "Links" icon | 603 |
| Open a random module | 587 |
| Show a list of modules | 589 |
| Open the "Artifact Comments" tab | 375 |
| Save a comment | 375 |
| Select a random artifact in a module | 375 |
| Create a stream | 2 |
| Open the configuration menu | 2 |
| Create a Word document from a module | 273 |
| Select "Done" after editing an artifact | 835 |
| Select "Edit" to modify an artifact | 840 |
| Hover over an artifact in a module view | 835 |
| Hover over a link in a module view | 528 |
| Finish delivering a change set that includes 50 changes | 10 |
| Open the configuration menu | 10 |
| Select "Deliver Change Set" for a change set with 50 changes | 10 |
| Insert an artifact into a module | 50 |
| Click away from an artifact in a view, to save it | 237 |
| Open the "Artifact Comments" tab | 377 |
| Save a comment | 374 |
| Click on the "Selected Artifact" tab after selecting an artifact in a view | 379 |
| Click on "Edit" to edit an artifact | 234 |
| Insert an artifact into a module | 50 |
| Click on "Discard a change set" to discard 50 changes | 10 |
| Click on "Discard a change set" to discard 10 changes | 150 |
| Open a module | 2739 |
| Open a module (10,000 artifacts) | 11 |
| Internal - find module size | 833 |
| Open a module (1500 artifacts) | 303 |
| Open a module (500 artifacts) | 4122 |
| Scroll through the pages in a module | 4015 |
| Select "Discard change set…" in the configuration menu | 160 |
| Select the "Artifacts" tab | 62 |
| Show module history | 549 |
| Show a list of modules | 6668 |
| Finish delivering a change set that includes 10 changes | 224 |
| Open the configuration menu | 224 |
| Select "Deliver Change Set" for a change set with 10 changes | 224 |
| Insert an artifact into a module | 398 |
| Click away from an artifact in a view, to save it | 1289 |
| Open the "Artifact Comments" tab | 2621 |
| Save a comment | 2627 |
| Click on the "Selected Artifact" tab after selecting an artifact in a view | 2619 |
| Click on "Edit" to edit an artifact | 1287 |
| Insert an artifact into a module | 396 |
| Login to RM app | 230 |
| Select a file to be uploaded | 376 |
| Select "Requirement" as the artifact type to be uploaded | 378 |
| Select the target folder for an upload | 378 |
| Select the "Create->Upload Artofact…" menu | 379 |
| Select "Show artifacts" to open a component | 378 |
| Select "OK" in the Upload File dialog | 379 |
Scenario details
This section provides more detail on the automation scenarios, to provide you with more context when you are interpreting the performance results.Initial operations: selecting and opening a module
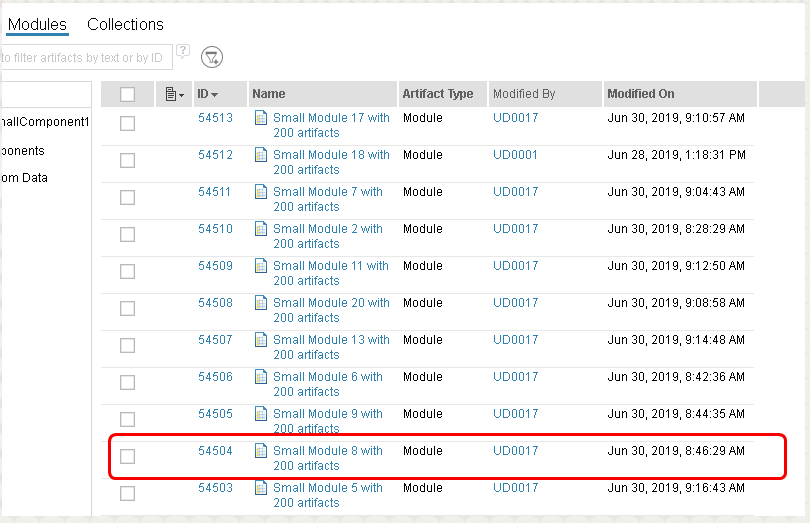
Most scenarios start by navigating into a global configuration and selecting a DNG contribution. Then, we display a list of modules.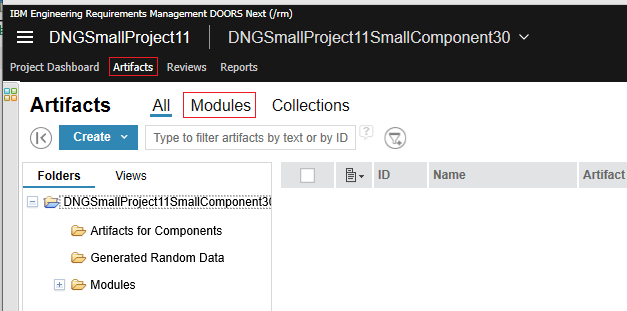 Next, we select a random module to open. Test modules come in three sizes:
 - 500 artifacts
- 1500 artifacts
- 10000 artifacts
Adding link columns to a view
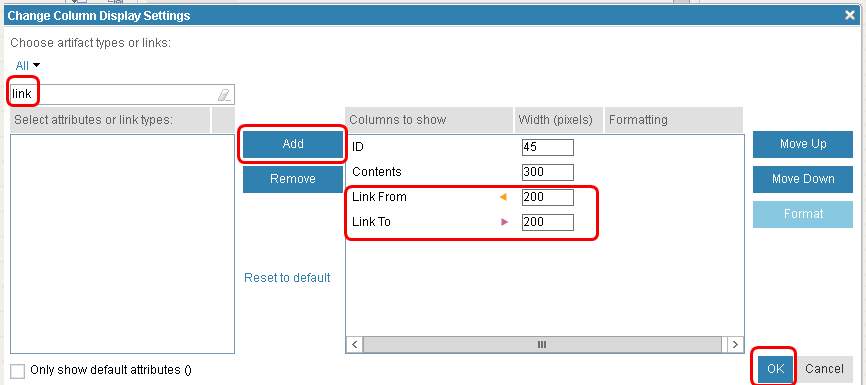
When we simulate adding link columns to a view, we start by opening a module. We bring up the "Change Column Display Settings" dialog and select the "Link From" and "Link To" link types. Then, we select "OK".
 We measure the time for the view to refresh and display links in the two link columns (see below):

Creating links
The "create links" scenario creates a change set, and then adds 10 links to random artifacts in a module. Finally, the changes are delivered. Here are the details for the steps. The initial operations are described here. Once a module is opened, the next step is to select an artifact: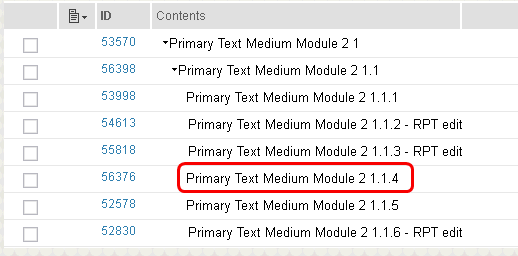 Then, select the "links" tab in the right-hand navigator:
 Then, select the "Add links to Artifact" icon, and select the "Link To" link type:
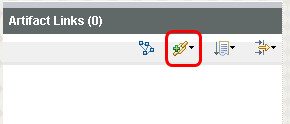 This brings up the "Create Links" dialog. Here, we select a target component:
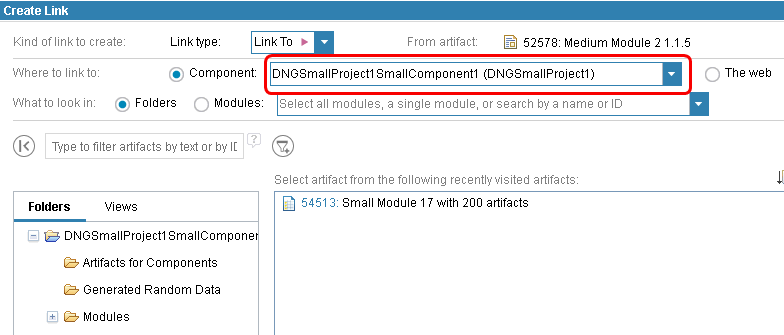 Then, we select a random module in the selected component. That displays a list of artifacts in the target module.
 Then, we select a random artifact and select "OK" to create the link.
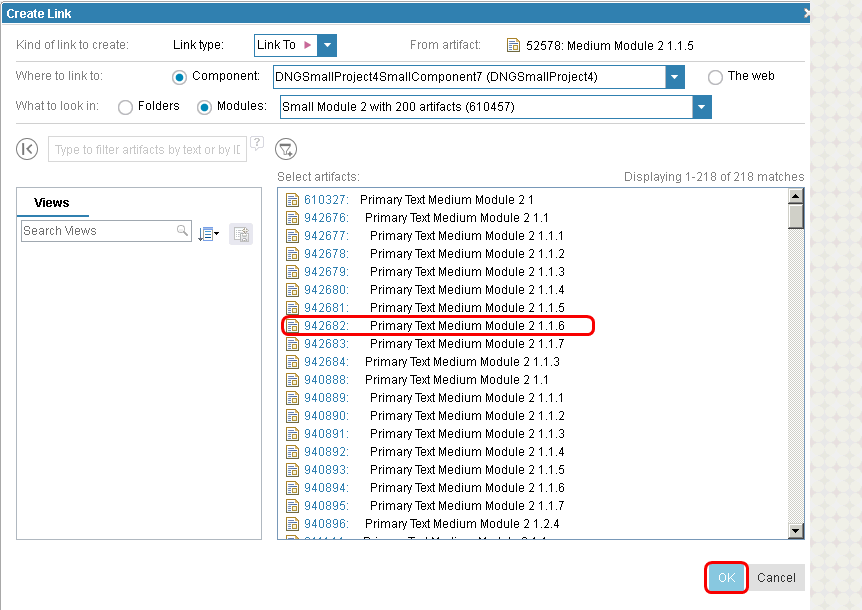 The above sequence is repeated 10 times to create 10 links. Then, we deliver the change set.
Creating and delivering change sets
The simulations for creating or editing artifacts all operate within a change set. This section describes the change set-specific parts of the scenario in more detail. To create a change set, select the configuration menu and then select "Create change set". Enter a name and select "Create". We measure the time required for both the changet set to be created and for the UI to refresh. So, change set creation times include the time required to reload a module in the context of the new change set. To deliver a change set, we start by selecting "Deliver Change Set..." from the configuration menu. We measure the time required for the "Deliver Change Set" dialog to appear.
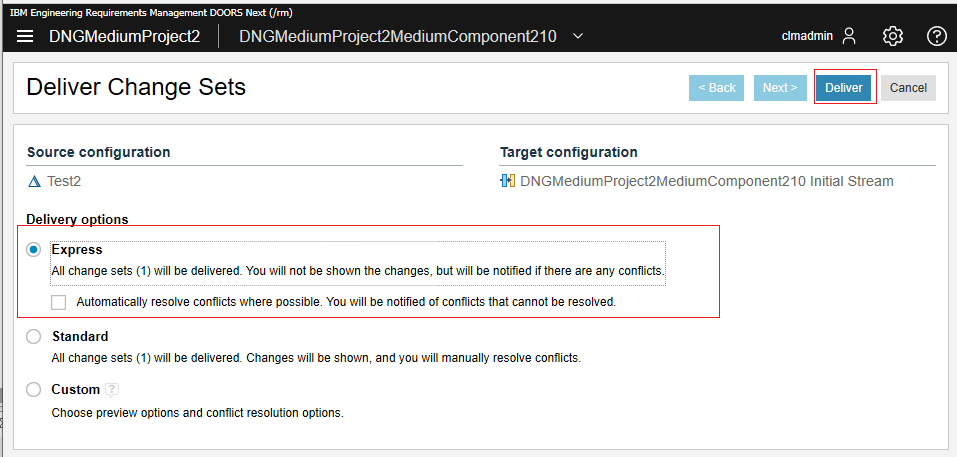
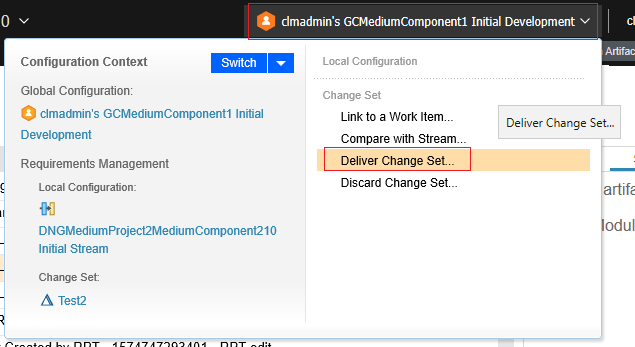 Finally, we select the "Express" delivery option and then "Deliver". We measure the time required for the deliver to complete (including the refresh of the UI).
Hovering over artifacts and links
The basic Hover scenario opens a module and hovers over an artifact. We measure the time needed for the artifact to finish rendering into the popup window.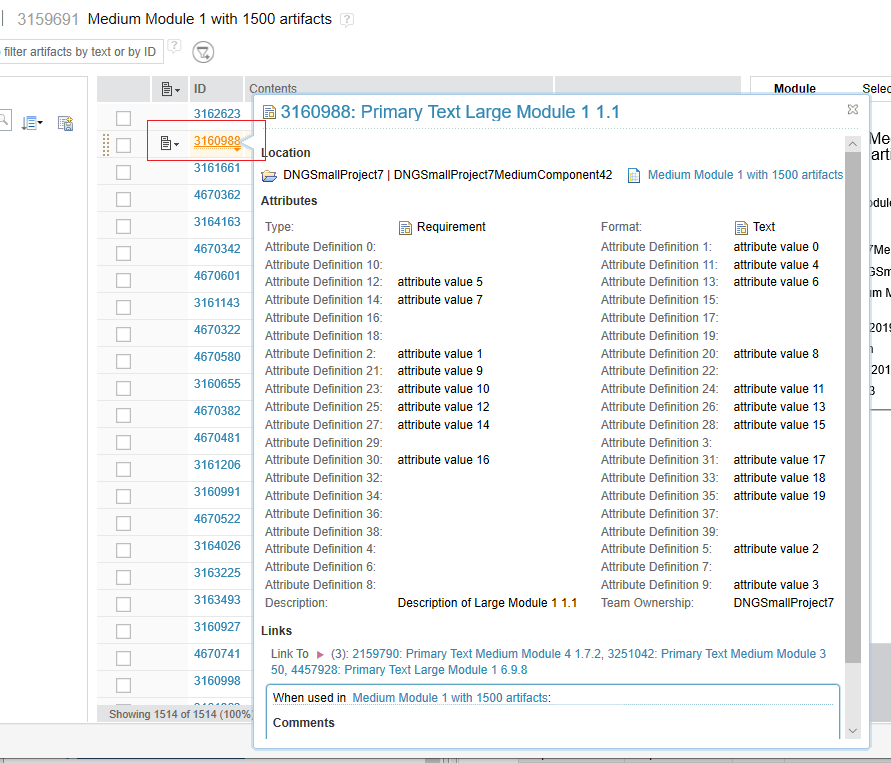 Then, the module title is modified and the module is saved.
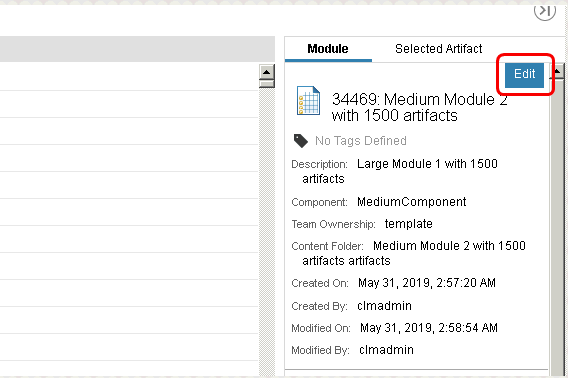
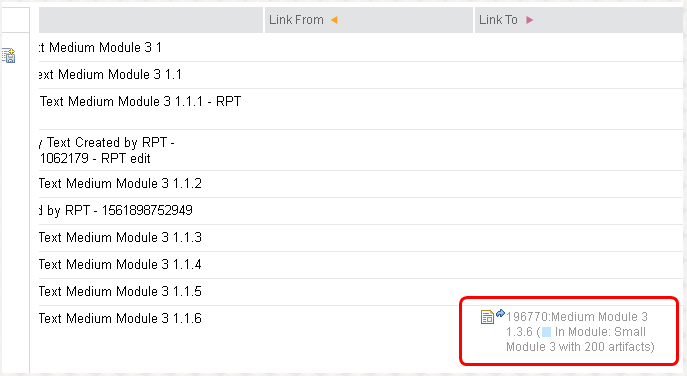
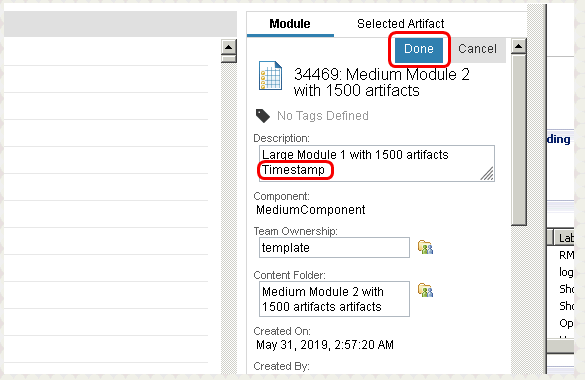 The "Hover over link" scenario first opens a module and adds "Linked to" and "Linked From" columns to the view, as described here. Then, we hover over a link in one of the columns. We measure the time required for the popup to completely render.
Artifact creation and editing
There are two scenarios that focus on making and delivering changes. The only difference between the two scenarios is the number of changes. In the "Large deliver" scenario, we add 5 artifacts, edit 15 artifacts, and make 30 comments (for a total of 50 changes). In the "Small deliver" scenario, we add 1 artifact, edit 3 artifacts, and make 6 comments (for a total of 10 changes). The scenarios start out by opening a module and creating a change set. To add an artifact, we bring up the artifact menu by clicking to the left of the artifact in the view, and then we select "Insert New Artifact" -> "After". We then click away from the artifact to save it.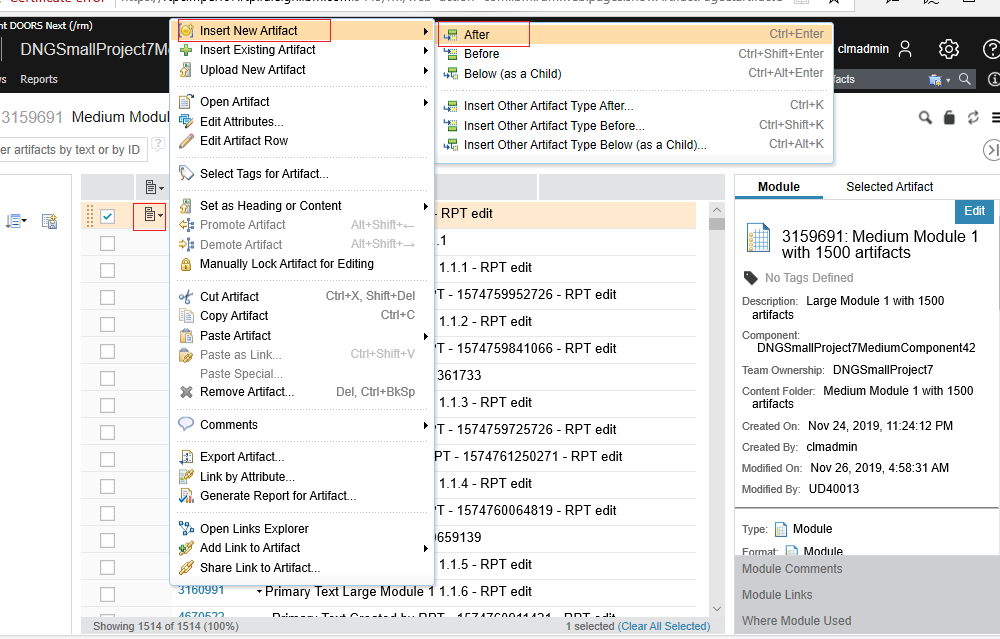 To edit the artifact, we change the title in-line in the view and click away from the artifact to save it.
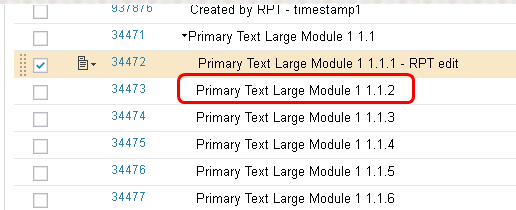
To add a comment, click on an artifact in the module and then click on the "Selected Artifact" tab.
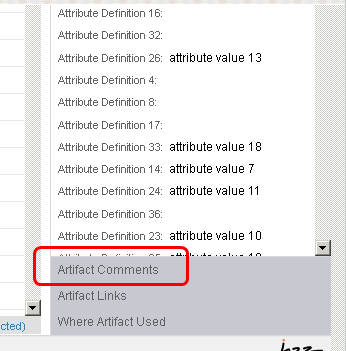
 Click on "Artifact comments" in the right-hand navigator.
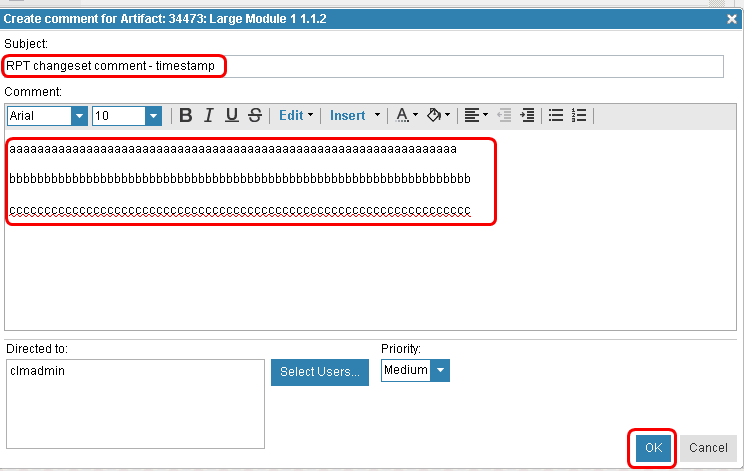
 Then, add a comment and select "OK" in the create comment dialog.
 After making the required number of changes, we then deliver the change set.
We also have variations of these two scenarios where we just discard the change set rather than delivering it.
Module history
The Module History scenario starts by opening a random component, and then opening a module in that compoment. Then, we bring up the action menu and select "Open History".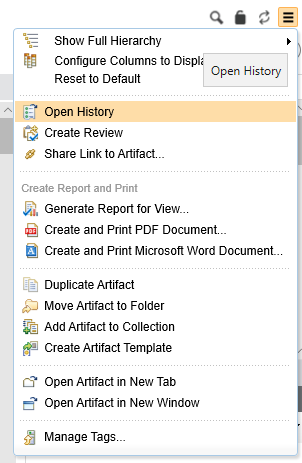 The scenario measures the time required for the following screen to display.

Copy/paste multiple artifacts
This scenario does a bulk copy/paste within a module. Our modules are organized into a hiearchy of requirements, and in this scenario, we start by collapsing two of the "level 2" sections.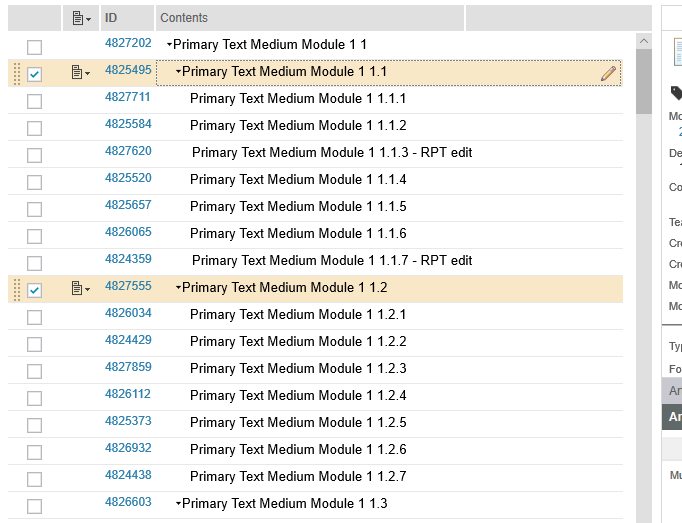 We then select the 2 collapsed sections and do a Copy. This copies the selected artifact and its children (for a total of 16 artifacts). Finally, we select the first collapsed artifact, click on the context menu, and select "Paste 16 artifacts->Before".
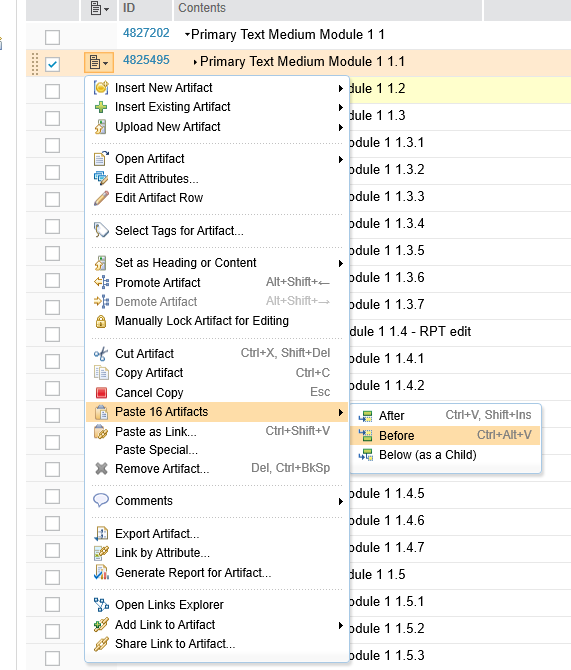 We measure the time it takes for the paste to complete (e.g. "Pasting artifacts..." goes away). But note that this is an asynchronous operation that does not block the UI. You can still do other things while the paste is in progress.

Create a stream or a baseline
The Create Stream scenario starts by picking a random component and selecting "Show Modules". After the list of modules displays, we select the "Create Stream..." menu from the configuration picker, enter a stream name, and select "Create". We use the option "Switch to the new stream". We measure the time required for the stream to be created and for the UI to refresh in the context of the new stream.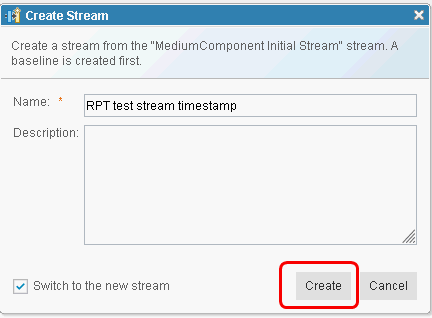 For creating a baseline, we start by picking a random component and then selecting "Show Artifacts". Then, from the configuration picker, we select "Create Baseline...". We measure the time required for the baseline to be created and for the UI to refresh.

Create a Microsoft Word document from a module
This scenario creates a Microsoft Word document from a module. We start by picking a random component, and then selecting "Show Modules". Then, we open a random module. Next, select "Create and Print Microsoft Word Document..." from the action menu: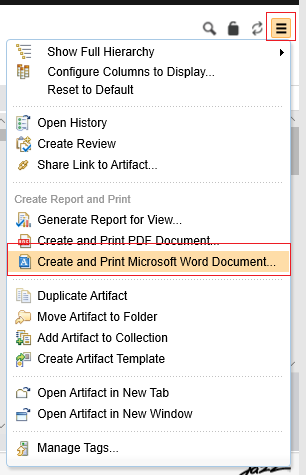 The scenario uses options to include comments and titles but not attributes. Select "OK" to start creating the Word document.
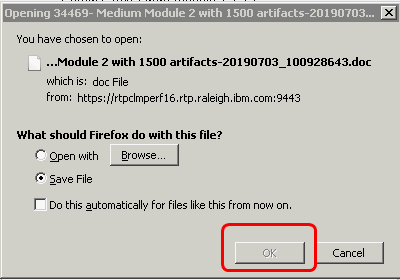
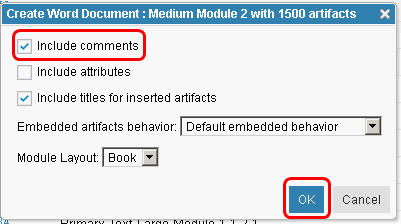 We measure the time from when you select "OK" in the previous screen to when the document creation finishes and you are prompted to open it.
Scroll through the artifacts in a module
This scenario picks a random component and then selects "Show Modules". We then pick a random module from the list and open it. Then, we scroll through several pages. We measure the time required for each scroll operation.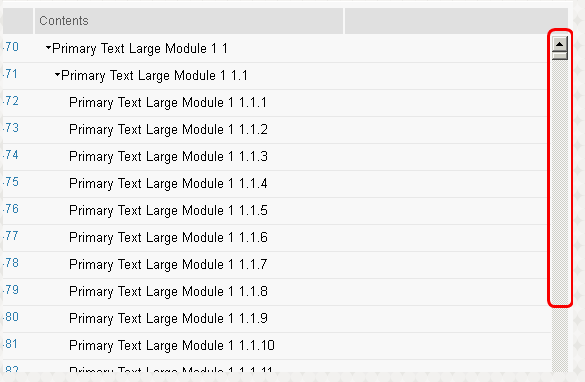
Upload a 4MB file
This scenario uploads a 4MB file into a new artifact. We start by picking a random component and then selecting "Show Artifacts".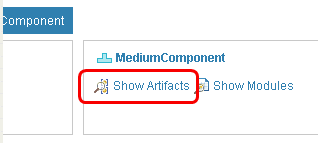 Then, we select "Create->Upload Artifact..."
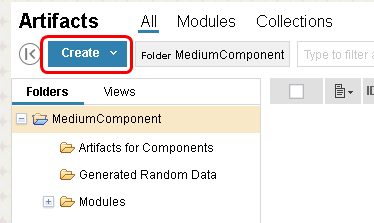 We select the file to upload (DNG_4MB_FileForUpload.doc), select "Requirement" as the artifact type, and select the folder called "Generated Random Data" as the location for the uploaded document.
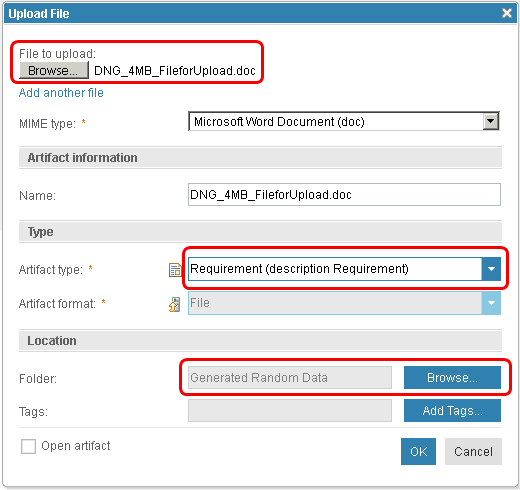 We measure the time from selecting "OK" to the time when the "Upload File" dialog closes.
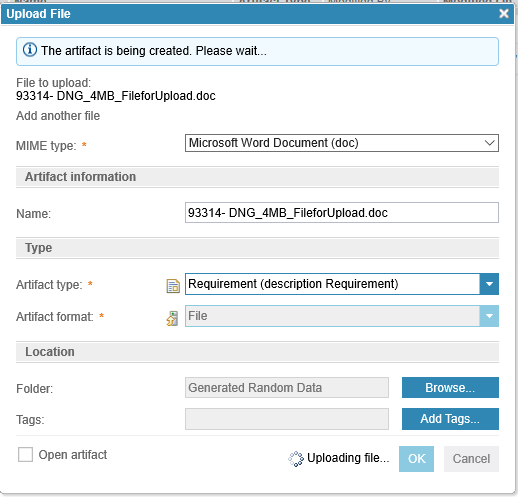
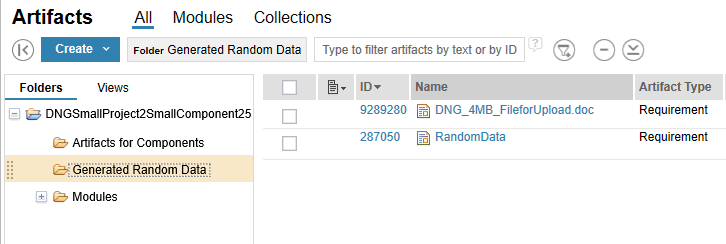 This is what the document looks like after uploading:
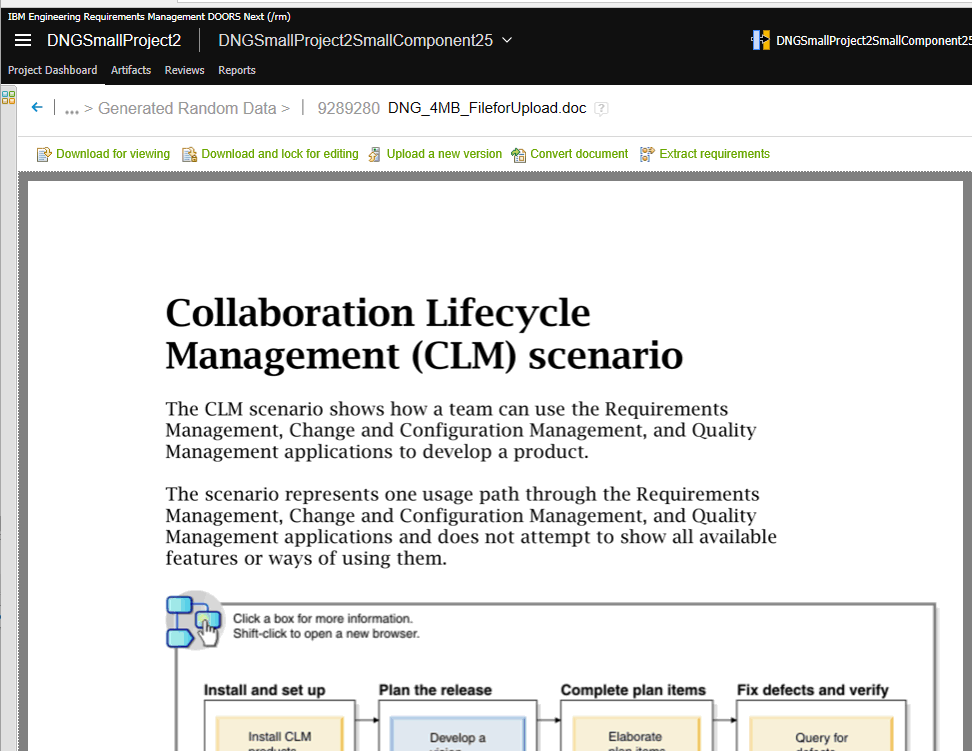
Add a comment to an artifact
This scenario picks a random module in a component, and opens an artifact in that module. Then, it adds a comment to the artifact. This scenario does not execute within a change set.Data shapes
The data shape for 7.0 is made up of a large number of standard-sized components, spread across 3 standard project area sizes. When we want to increase the size of repository, we just add more of the standard projects. In addition, the test environment is enabled for configuration management, and all operations are executed within the context of a global configuration. We have 3 standard sizes for global configurations (small, medium and large).Artifact counts
We have 3 different standard module sizes:- Small (200 artifacts)
- Medium (1500 artifacts)
- Large (10,000 artifacts)
| Artifact type | Small component | Medium component | Large component |
|---|---|---|---|
| Number of large modules | 0 | 0 | 1 |
| Number of medium modules | 0 | 3 | 0 |
| Number of small modules | 20 | 0 | 0 |
| Total module artifacts | 4200 | 4500 | 10000 |
| Non-module artifacts | 100 | 100 | 100 |
We use these standard components to create 3 standard size projects (small, medium, and large). The number of artifacts for these standard projects is summarized below.
| Artifact type | Small project | Medium project | Large project |
|---|---|---|---|
| Large components | 1 | 5 | 20 |
| Medium components | 6 | 30 | 120 |
| Small components | 36 | 180 | 720 |
| Total components | 43 | 215 | 860 |
| Module artifacts | 181,000 | 905,000 | 3,620,000 |
| Non-module artifacts | 4,300 | 21,500 | 86,000 |
| Total artifacts | 185,300 | 926,500 | 3,706,000 |
| Large modules (10,000 artifacts) | 1 | 5 | 20 |
| Medium modules (1,500 artifacts) | 18 | 90 | 360 |
| Small modules (200 artifacts) | 720 | 3,600 | 14,400 |
Finally, we combine these standard projects to create repositories of varying sizes. Here is the summary of our test repositories up to 20,000,000 total artifacts.
| Server Data | 1m | 2m | 5m | 10m | 15m | 20m |
| Large Projects | 0 | 0 | 0 | 1 | 1 | 1 |
| Medium Projects | 0 | 1 | 2 | 2 | 6 | 10 |
| Small Projects | 5 | 5 | 15 | 19 | 23 | 27 |
| Total Projects | 5 | 6 | 17 | 22 | 30 | 38 |
| Module Artifacts | 905,000 | 1,810,000 | 4,525,000 | 8,869,000 | 13,213,000 | 17,557,000 |
| Non-Module Artifacts | 21,500 | 43,000 | 107,500 | 210,700 | 313,900 | 417,100 |
| Comments | 33,000 | 66,000 | 165,000 | 292,366 | 448,366 | 634,366 |
| RM Links | 10,000 | 21,541 | 74,346 | 178,076 | 187,851 | 279,104 |
| Large modules (10,000 artifacts) | 5 | 10 | 25 | 49 | 73 | 97 |
| Medium modules (1,500 artifacts) | 90 | 180 | 450 | 882 | 1,314 | 1,746 |
| Small modules (200 artifacts) | 3,600 | 7,200 | 18,000 | 35,280 | 52,560 | 69,840 |
| Large Components | 5 | 10 | 25 | 49 | 73 | 97 |
| Medium Components | 30 | 60 | 150 | 294 | 438 | 582 |
| Small Components | 180 | 360 | 900 | 1,764 | 2,628 | 3,492 |
| Total Components | 215 | 430 | 1,075 | 2,107 | 3,139 | 4,171 |
| GC Components | 51 | 102 | 256 | 511 | 767 | 1,023 |
| Total GC Baselines | 2,557 | 5,115 | 12,788 | 25,575 | 38,363 | 51,150 |
| Total DNG Local Baselines | 25,000 | 50,000 | 125,000 | 250,000 | 375,000 | 500,000 |
| Total Artifacts | 1,023,782 | 1,934,201 | 4,835,488 | 9,447,009 | 14,947,224 | 18,756,265 |
| Total Versions | 6,142,698 | 12,321,207 | 30,844,163 | 58,106,678 | 87,434,252 | 118,928,959 |
Global configurations
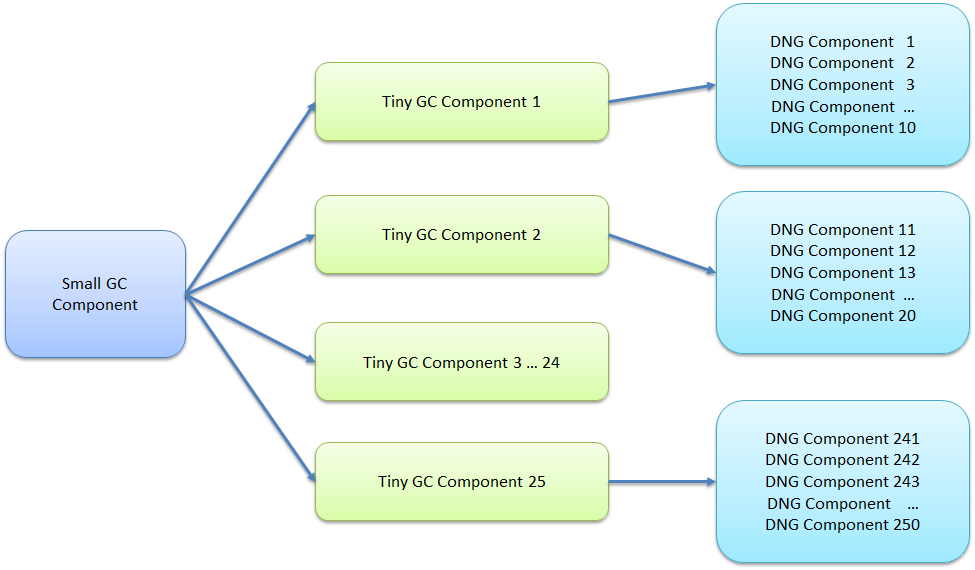
We created global configurations (GCs) and added the DNG components as contributions. We used 4 standard sizes:- A tiny GC with 10 contributions
- A small GC with 250 contributions, consisting of 25 tiny GCs
- A medium GC with 1250 contributions, consistent of 6 small GCs
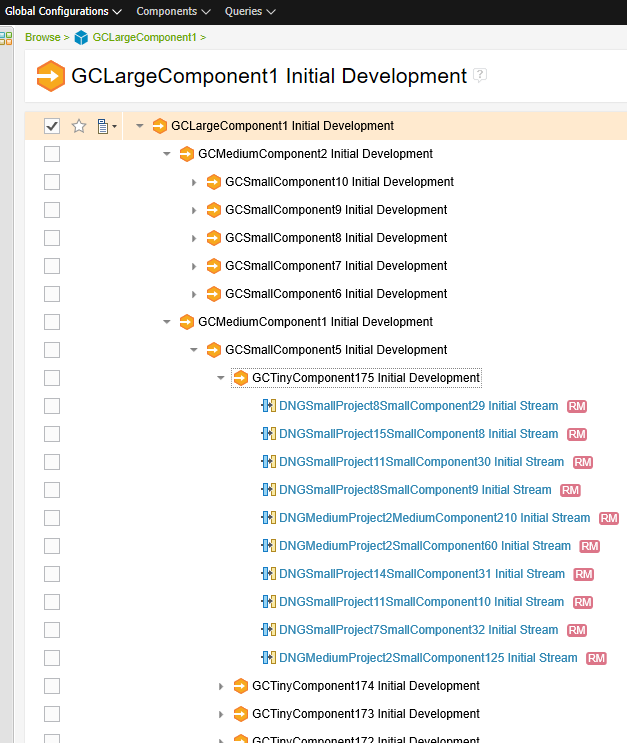
- A large GC with 2500 contributions, consistent of 2 medium GCs
 The large GC looks like this:
Oracle tuning
This section addresses Oracle configuration parameters used during the performance testing. The most critical tuning parameter is the amount of memory available to Oracle. This is discussed in detail in the database memory requirements section. The Oracle optimizer has several features that attempt to adjust execution plans if the optimizer finds that its cardinality estimates are inaccurate. With ELM applications, however, variation in counts is normal. For example, modules have different numbers of artifacts, view queries return different matches, and the sizes of global configurations varies. This can lead to SQL plan instability, where the optimizer is frequently doing hard parses to try and find better plans. These hard parses are expensive, and can lead to view timeouts. We recommend disabling Oracle's adaptive features. They don't typically improve on the initial execution plans, and the cost of the hard parses is too high to incur repeatedly. The performance tests described in this article were executing using these settings:- optimizer_adaptive_plans = false
- optimizer_adaptive_reporting_only = false
- optimizer_adaptive_statistics = false
- _optimizer_use_feedback= false
- We used a redo log size of 6G. This keeps the rate of log switching low (1-2 per hour). See "log switches (derived)" in the AWR
- parallel_degree_policy is set to "manual". We do not want Oracle to use parallel execution plans so we need to override the default of "auto" and set to manual. Parallel execution can cause performance issues with some ELM SQL.
- filesystemio_options is set to "setall". This allows Oracle to use asynchronous I/O, and avoids double-caching via the Linux page cache.
- processes = 4480
- open_cursors = 10000
- session_cached_cursors = 1000
- memory_target = 48000M
- memory_max_target = 48000M
- sga_max_size=0
- sga_target=0
- pga_aggregate_limit=0
- pga_aggregate_target=0
DB2 tuning
This section addresses DB2 configuration parameters used during the performance testing. We used the following settings for the transaction logs:| Log file size (4KB) | (LOGFILSIZ) = 65536 |
| Number of primary log files | (LOGPRIMARY) = 80 |
| Number of secondary log files | (LOGSECOND) = 100 |
We used the following memory settings for the RM database:
| Package cache size (4KB) | 32,184 |
| Sort heap thres for shared sorts (4KB) | 214,615 |
| Sort list heap (4KB) | 39,868 |
We also made these changes:
- make db heap size automatic: db2 update db cfg using DBHEAP 8192 automatic
- make application heap size automatic: db2 update db cfg using APPLHEAPSZ 10000 automatic
- Buffer pool size: 52G
- RM Database_memory: 62G
- db2 update db cfg using AUTO_TBL_MAINT OFF
- db2 update db cfg using AUTO_RUNSTATS OFF
- db2 update db cfg using AUTO_STMT_STATS OFF
| Schema | Table | Column |
| REPOSITORY | ITEM_STATES | ITEM_VALUE |
| REPOSITORY | CONTENT_STORAGE | CONTENT_BYTES |
For ITEM_VALUE, we used an inline length of 1200 bytes; for content_bytes, we used an inline length of 4096 bytes.
ALTER TABLE REPOSITORY.ITEM_STATES ALTER COLUMN item_value SET INLINE LENGTH 1200;
reorg TABLE REPOSITORY.ITEM_STATES LONGLOBDATA;

ALTER TABLE REPOSITORY.CONTENT_STORAGE ALTER COLUMN content_bytes SET INLINE LENGTH 4096;
reorg TABLE REPOSITORY.CONTENT_STORAGE LONGLOBDATA
Finally, we recommend to apply the latest fixpack for DB2 v11.1, or set the following performance registry variable to the DB2 instance as DB2 administrator:
db2set DB2COMPOPT=OJSJ, restart the DB2 instance to take effect. This is not required for DB2 v11.5. Note: Transaction log settings impact runstats and other ELM operations. The value of the logfilsiz should be increased if the database has a large number of update, delete, or insert transactions running against it which will cause the log file to become full very quickly.
DOORS Next server tuning - application
Server settings are listed in the sections describing the test environments, but a few of the settings are worth additional discussion. The first setting controls the size of the configuration caches. This is a JVM system setting (-Dcom.ibm.rdm.configcache.size=600) - the default is 600. You should set this value to be the number of components that are going to be used by people over the course of the day. In our test workloads, we open components randomly using a global configuration, so we set com.ibm.rdm.configcache.size to be greater than the number of contributions in our largest global configuration (2500). If the cache is undersized, response times can be 5-10 seconds slower for some use cases at high user loads, as shown in the chart below. Be aware that more memory is used as the cache size grows. Each global configuration (including personal GCs) can require an additional 50M of memory, especially in those scenarios involving links. If your JVM heap size is 24G or less, be cautious when increasing the cache size above 1000 (check your verbose GC logs for signs of trouble). You may need a maximum heap size of 32G or larger to support cache sizes of 2500 or more.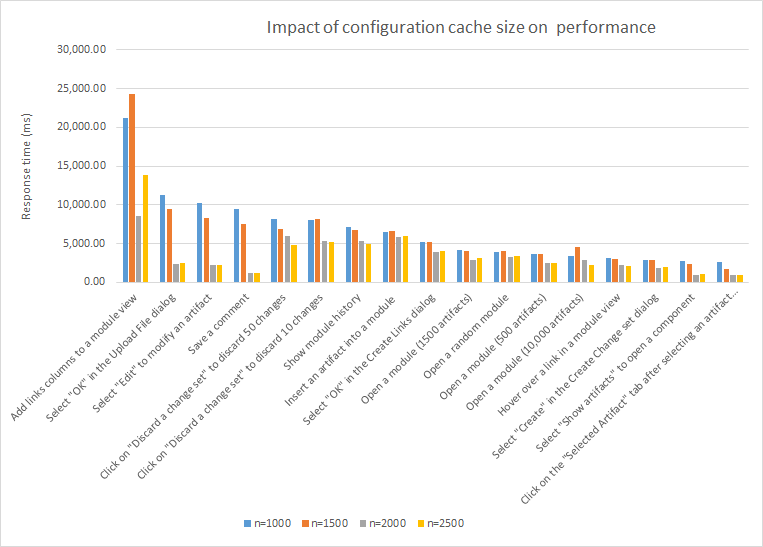 We also increased the cache expiration time: -Dcom.ibm.rdm.configcache.expiration=5040. By default, values expire from DNG caches after 10 minutes. We didn't see a large performance impact from this parameter, since values are not immediately ejected when they expire. But a longer expiration period (1 day or more) seems reasonable.
Tuning the configuration cache for IBM Engineering Requirements Management DOORS Next V7.X describes how to query for your active configurations in order to calculate the optimal configuration cache size.
By default, the number of contributions in a global configuration is limited to 1000. We support larger global configurations on Oracle, so be sure to increase the setting. This can be found in the rm/admin Advanced Properties UI (see below). When you set this to a value greater than 1000, you'll see a warning message - you can ignore it.
 If you expect to have hundreds of active DNG users, you should consider raising the following values (all are Advanced Properties in rm/admin)
 - View query threadpool size override
- JDBC connection pool
- RDB Mediator pool
- Maximum outgoing HTTP connections per destination
- Maximum outgoing HTTP connections total
If there are a significant number of Dervies Architeture Elements, or AM project associations, then also monitor the connection pools listed above and increase if you see any Queue Lengths in the Counters page. See: ELM - HTTP-Connections-For-Server-To-Server-Calls for further information on monitoring thread usage in real time.
DOORS Next server tuning - operating system
As your system demands grow, you will need to increase the operating system kernel settings accordingly. The Interactive Installation Guide describes the minimum set of values. Failure to adequately monitor the system resources and the demand can lead to out of memory warnings from the web server layer, or out of threads at the Java Virtual Machine level. Where we have encountered native out of memory issues within WebSphere, we have increased the following settings in the Linux /etc/security/limits.conf file. Note, if running a Linux service, use appropriate systemd files as articulated in How to set limits for services in RHEL and systemd.- * - nofile 131072
- * - nproc 131072
- * - kernel.threads-max
- * - kernel.pid_max
- * - vm.max_map_count
Summary of revisions
3/11/2020:- Added section summarizing data shape and workload changes
- In progress - additional workload documentation and sanitizing of page names
- Added DB2 memory section
- Completed first pass through workload documentation
- Added section describing a staged run to 900 users
- Edit pass
- Added section Impact of total artifact count on DB2
- Added section Impact of GC size on DB2
- Added section Test results for a 10 million artifact repository (DB2)
- Added section describing DB2 configuration settings used in the tests
- Minor edits
- Added section DNG server tuning
- Updated the section on GC size and DB2 to reflect improvements from tuning.
- Updated the DB2 tuning section to recommend disabling automatic runstats.
- Updated 10 million DB2 results to reflect improvements from tuning. Increased the supported GC size to 1250 contributions for DB2.
- Fixed transaction names in tables and charts. "Finish and deliver" transactions were incorrectly labeled as "Select and deliver".
- Included a summary of the rate of execution for various use cases
- Updated user load tests to reflect 7.0.1 improvements (tested up to 1000 users)
- Added discussion on the memory impact of increasing DNG cache sizes
- Added kernel settings considerations when scaling
Related topics:
External links:
Contributions are governed by our Terms of Use. Please read the following disclaimer.
Dashboards and work items are no longer publicly available, so some links may be invalid. We now provide similar information through other means. Learn more here.

