Must-gather information for diagnosing long-running SQL statements on Oracle
Authors: VaughnRokosz Build basis: None. Applies to DOORS Next 7.x and ETM and EWM 6.x, 7.x
There are two complementary pieces of information to collect from customers when diagnosing long-running SQL statements on Oracle:
The list of monitored SQL statements appears. This shows the time taken by each SQL statement, the user that executed the statement, as well as other information. If you are having performance problems with a particular application, then look for SQL statements executed by the database user associated with that application. Select the SQL statement of interest to display the execution details:
 To generate reports to share with IBM, select the disk icon and then choose the "Save as Report" option. This will capture the information for the statement in HTML format. Upload the HTML file to IBM. Then, choose the "Save as active report" option and save the resulting html file. Then, upload that file to IBM.
Find the slow SQL statement in which you are interested from the list, and click on it.
Then, select Save to save the monitor details to an HTML file. Before uploading the file to IBM, open it in a browser and confirm that the save worked correctly.
Open the HTML file in a browser to verify that it generated correctly, then upload it to IBM. You should see something similar to this:
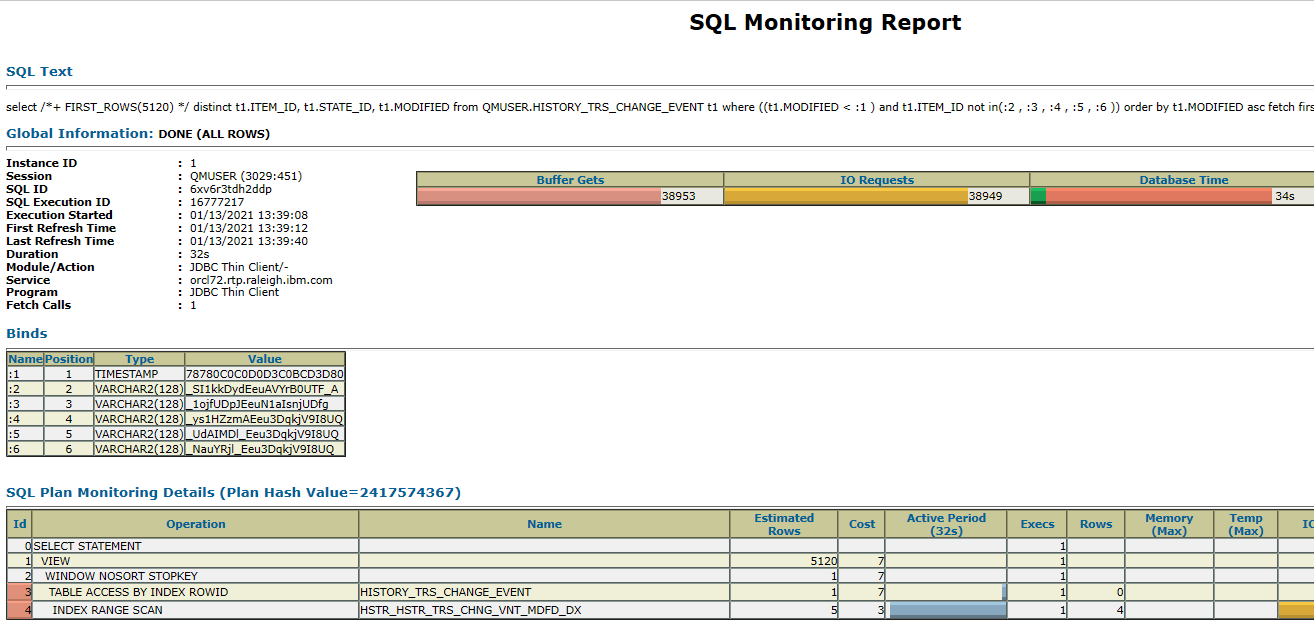
This is better than nothing, but it is harder to use than the output from SQL Developer. Note that the execution plan does not include collapsible sections, so it is much harder to navigate than what SQL Developer can generate. You have to rely on indentation, which is difficult for more complex execution plans. So, this is an option of last resort. The other drawback of this approach is that we may not get data for the instance of the statement that is slow. That might happen in there are some slow instances and some fast instances. In this case, you will need to go through a two-step process to get the monitor output for the slow instance. The first step is the generate the complete monitor report, showing all of the SQL statements tracked by the monitor. To do that, use:
You should get a report that looks something like this:

You can also use the "Last Hour" view:

Select the SQL statement of interest to bring up the details, then select "Save Report" to save the details to an HTML file. Open the HTML file in a browser to verify that it generated successfully, then upload it to IBM.
- A SQL Monitor report for the long-running statement
- An execution plan (that includes predicate and column projection details)
SQL Monitor reports
Oracle will automatically monitor SQL statements that run in parallel, or that consume more than 5 seconds of CPU or I/O in a single execution. The monitor report provides several valuable bits of information, including:- The values of bind variables
- A high level execution plan
- Estimates and actuals for each row source in the execution plan
- Memory, CPU, and elapsed time estimates for the steps in the execution plan
Execution plans
An execution plan shows the detailed steps necessary to execute a SQL statement. The steps are expressed as a set of database operators that produce and consume rows. The execution plan (generated bySELECT * FROM TABLE(DBMS_XPLAN.display_cursor('sql_id', NULL, 'all +peeked_binds +outline')); provides additional context that aids in the interpretation of the monitor output, including: - The predicates and column projections used by each step in the execution plan
- The values of the bind variables at the time that the statement was hard-parsed
- Details for each child cursor, if there are multiple execution plans available for a statement
- A high-level list of things that influenced the optimizer when generating the plan:
- Adaptive features
- SQL plan directives
- SQL profiles or baselines
- Dynamic sampling
- Statistics feedback
Getting SQL Monitor reports
There are several different ways to generate monitor reports. The options vary across the different Oracle versions, but here is a high-level summary:- Use the Oracle SQL Developer client, and generate monitor reports from the "Real-time SQL Monitor" tool
- Use the SQL Monitor view provided with Oracle Enterprise Manager Cloud Control
- Use the SQL Monitor view provided with Oracle's EM Database Express
- Use sql*plus to generate monitor reports ( DBMS_SQLTUNE.report_sql_monitor_list and DBMS_SQLTUNE.report_sql_monitor)
Monitor reports from SQL Developer
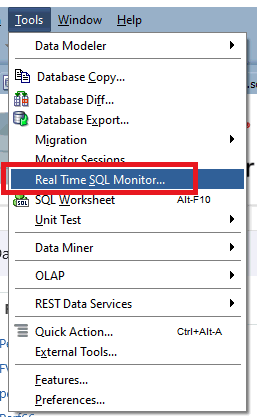
Oracle describes SQL Developer as "a graphical version of SQL*Plus that gives database developers a convenient way to performance basic tasks". You can download SQL Developer from Oracle, and then connect it to your Oracle servers. Use the latest available version (version 19 or later). Bring up the SQL monitor view by selecting the Tools->RealTime SQL Monitor... menu:
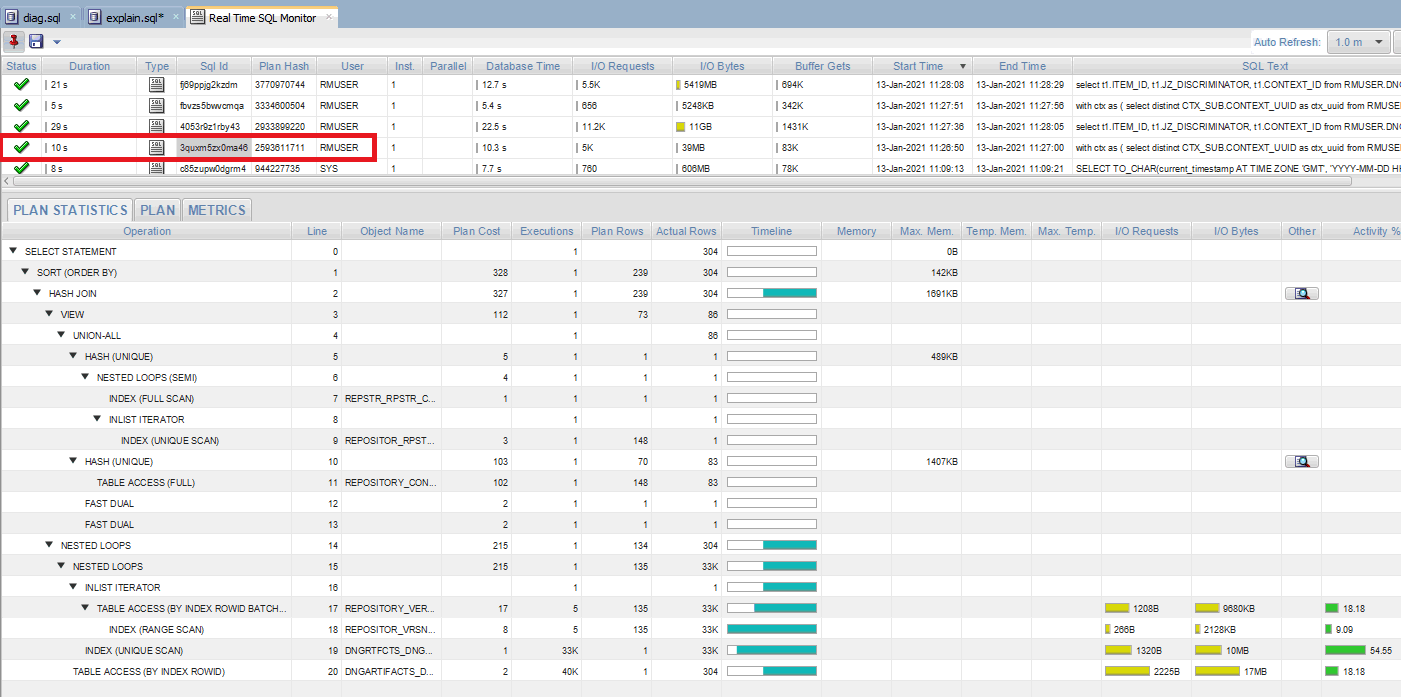
The list of monitored SQL statements appears. This shows the time taken by each SQL statement, the user that executed the statement, as well as other information. If you are having performance problems with a particular application, then look for SQL statements executed by the database user associated with that application. Select the SQL statement of interest to display the execution details:
 To generate reports to share with IBM, select the disk icon and then choose the "Save as Report" option. This will capture the information for the statement in HTML format. Upload the HTML file to IBM. Then, choose the "Save as active report" option and save the resulting html file. Then, upload that file to IBM.
Monitor reports from Oracle Enterprise Manager Cloud Control
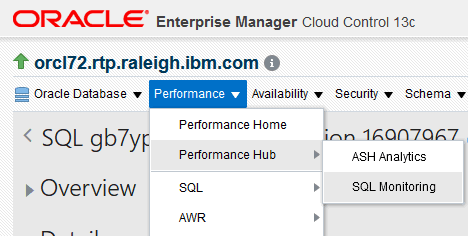
Oracle's Enterprise Manager Cloud Control is a centralized monitoring solution that can manage all of a customer's Oracle deployments. It has functionality that overlaps other monitoring tools such as New Relic, Logic Monitor and Dynatrace. But it also has monitoring capabilities for Oracle database servers. In fact, it now includes features that were formerly available in the EM Express tool that was part of the Oracle server install. With each release of Oracle, more functionality has been moved from EM Express into Cloud Control. Access the SQL monitor view by selecting Performance Hub->SQL Monitoring.
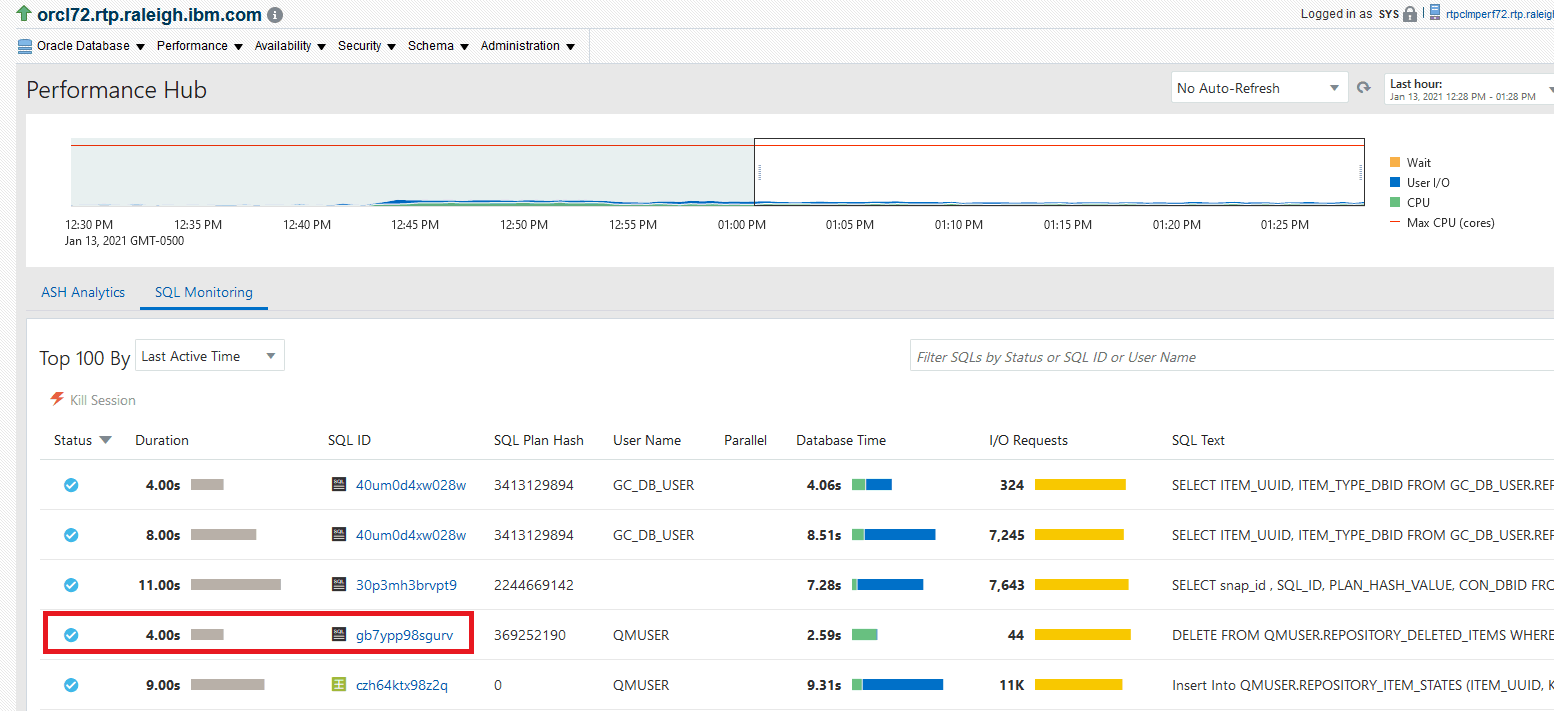
Find the slow SQL statement in which you are interested from the list, and click on it.

Then, select Save to save the monitor details to an HTML file. Before uploading the file to IBM, open it in a browser and confirm that the save worked correctly.
Generating monitor output from sql*plus
You can generate monitor reports from sql*plus, using the DBMS_SQLTUNE package. But there are several disadvantages to using that approach, so it is not recommended unless there is no other option. The output format is much harder to read, and it is therefore harder for the IBM support teams to use. It is harder to get information about one specific statement. You can easily get information about the last execution of a statement, but if that is not also the slow instance, then the output is not helpful to IBM. It takes more time to figure out how to generate a report for any older instances. If you have the SQL id for a statement of interest, you can generate the monitor output for the last execution of that statement by executing the following PL/SQL script. You would of course change the file name and SQL id to match your own system.SET LONG 1000000 SET LONGCHUNKSIZE 1000000 SET LINESIZE 1000 SET PAGESIZE 0 SET TRIM ON SET TRIMSPOOL ON SET ECHO OFF SET FEEDBACK OFF SPOOL /var/tmp/report_sql_monitor_forid.htm SELECT DBMS_SQLTUNE.report_sql_monitor( sql_id => '1v6xu3zn7uprm', type => 'HTML', report_level => 'ALL') AS report FROM dual; SPOOL OFF
Open the HTML file in a browser to verify that it generated correctly, then upload it to IBM. You should see something similar to this:

This is better than nothing, but it is harder to use than the output from SQL Developer. Note that the execution plan does not include collapsible sections, so it is much harder to navigate than what SQL Developer can generate. You have to rely on indentation, which is difficult for more complex execution plans. So, this is an option of last resort. The other drawback of this approach is that we may not get data for the instance of the statement that is slow. That might happen in there are some slow instances and some fast instances. In this case, you will need to go through a two-step process to get the monitor output for the slow instance. The first step is the generate the complete monitor report, showing all of the SQL statements tracked by the monitor. To do that, use:
  SET LONG 1000000
  SET LONGCHUNKSIZE 1000000
  SET LINESIZE 1000
  SET PAGESIZE 0
  SET TRIM ON
  SET TRIMSPOOL ON
  SET ECHO OFF
  SET FEEDBACK OFF

 SPOOL /var/tmp/report_sql_monitor_list.htm
 SELECT DBMS_SQLTUNE.report_sql_monitor_list(
       type         => 'HTML',
       report_level => 'ALL') AS report
 FROM dual;
 SPOOL OFF
You should get a report that looks something like this:

Using EM Express
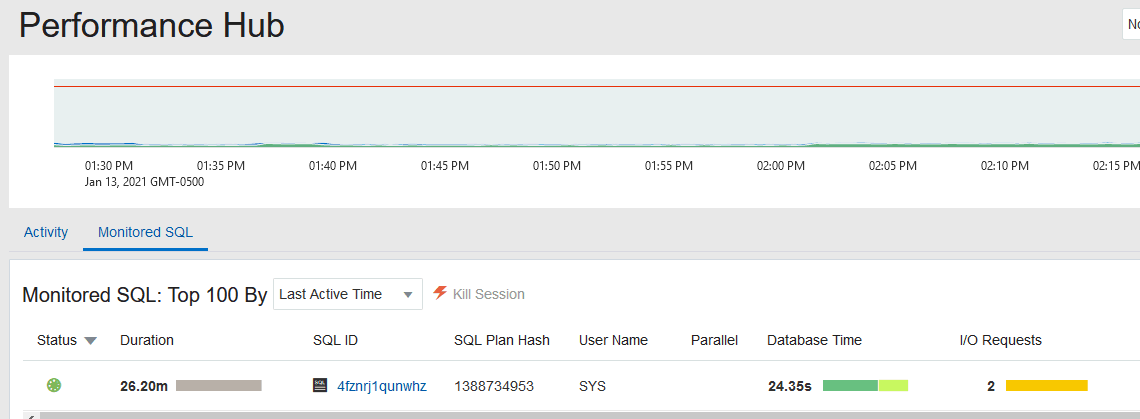
You can also access the Monitor view if you are running EM Express on your Oracle server. The way you get to the UI may vary based on your Oracle release, but in Oracle 19c, you can do that by selecting Performance->Performance hub. Then, select the "Monitored SQL" tab to bring up the list of monitored statements:
You can also use the "Last Hour" view:

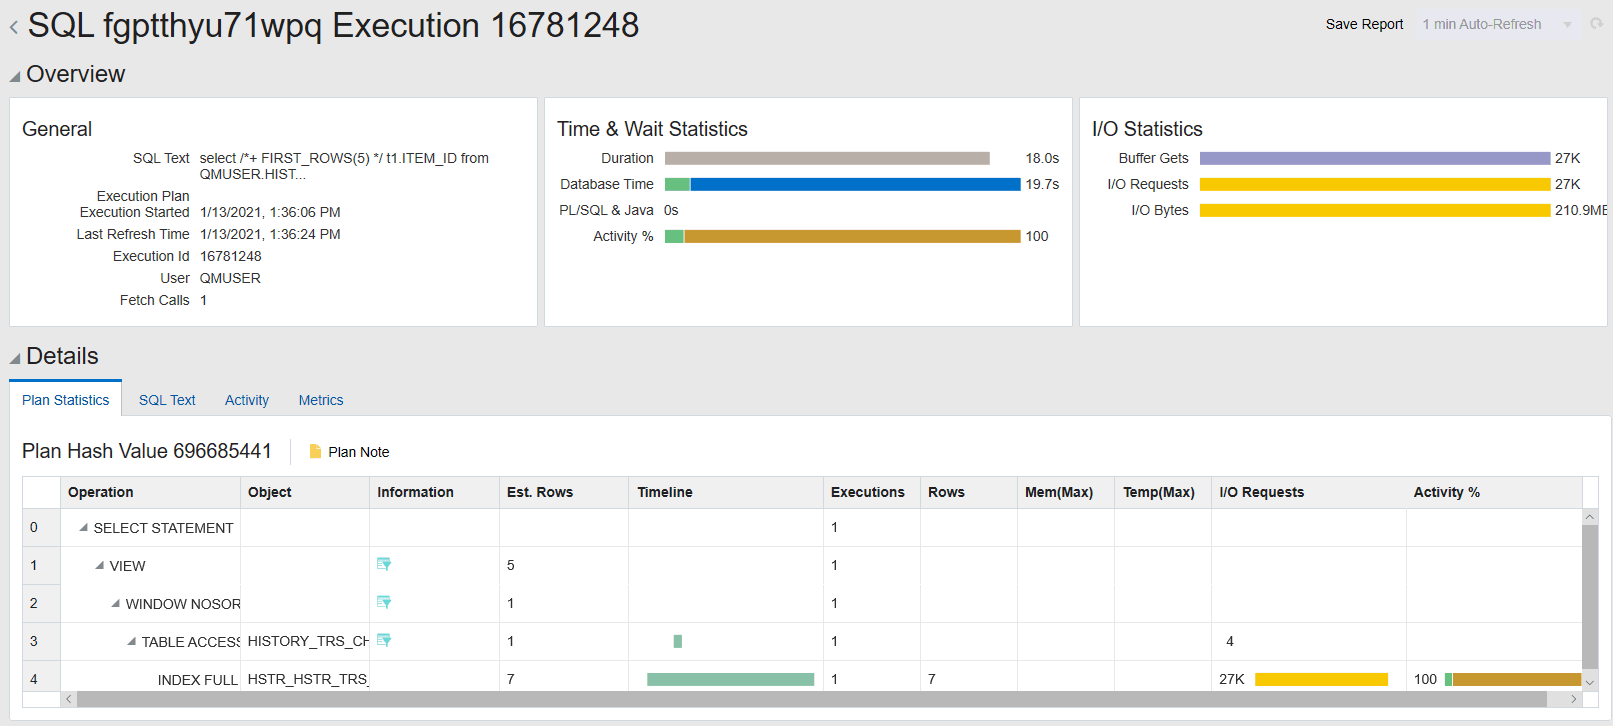
Select the SQL statement of interest to bring up the details, then select "Save Report" to save the details to an HTML file. Open the HTML file in a browser to verify that it generated successfully, then upload it to IBM.

Getting detailed execution plans
To get a detailed execution plan, execute the following command from sql*plus (or from a SQL Worksheet in SQL Developer). Remember to replace the sql_id parameter with the actual SQL id for the statement that is performing poorly.
SELECT * FROM TABLE(DBMS_XPLAN.display_cursor('sql_id', NULL, 'all +peeked_binds +outline'));
Save the result to a text file and upload it to IBM. Please do not transform this to a format other than plain text (like PDF or csv). Provide the output in plain text only.
Do not use dbms_xplan.display_awr to generate an execution plan from historical data. These execution plans do not include the predicate and column projection sections, so they are not useful to IBM support personnel.
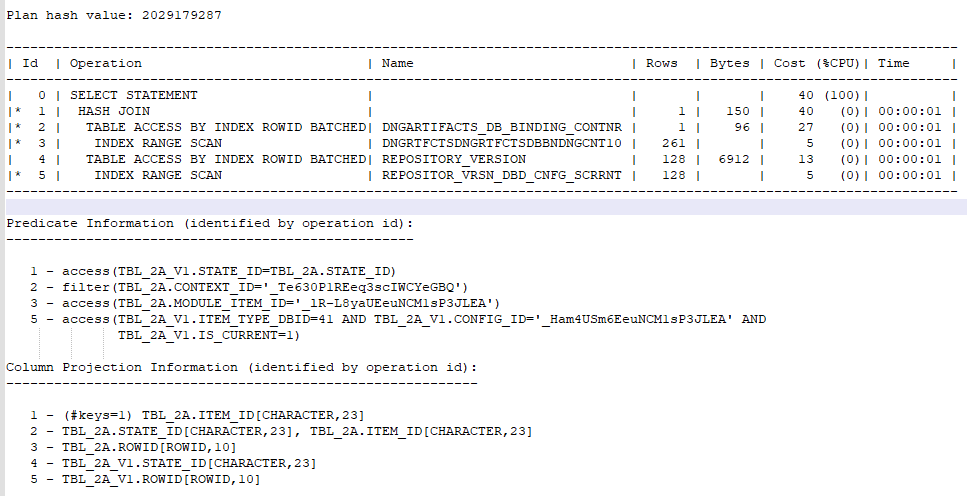
Here's a simple example of the kind of output we need to have. This includes the tabular form of the execution plan, plus the predicate information section and the column projection information section. The predicate information section tells us what predicates are being applied to each step in the plan, so we can tell what joins or filters are being applied. The column projection information tells us what columns are being produced by each row source in the plan.

References:
- The SQL Monitor
- Explain the explain plan
- Oracle EM Database Express
- SQL Developer download
- What is SQL Developer?
- dbms_xplan
Related topics: Performance sizing guides and datasheets, Disk benchmarking
External links:
Additional contributors: PaulEllis
| I | Attachment | Action | Size | Date | Who | Comment |
|---|---|---|---|---|---|---|
| |
EnterpriseHub.gif | manage | 14.4 K | 2021-03-10 - 17:00 | PaulEllis | |
| |
ExecutionPlan.gif | manage | 23.1 K | 2021-03-09 - 21:17 | PaulEllis | |
| |
LastHour.gif | manage | 28.1 K | 2021-03-10 - 17:03 | PaulEllis | |
| |
MonitoringList.gif | manage | 61.2 K | 2021-03-10 - 17:02 | PaulEllis | |
| |
MonitoringReport.gif | manage | 43.4 K | 2021-03-10 - 17:02 | PaulEllis | |
| |
Perfhub.gif | manage | 49.2 K | 2021-03-10 - 17:00 | PaulEllis | |
| |
RealTimeMonitorQuery.gif | manage | 65.1 K | 2021-03-09 - 21:15 | PaulEllis | |
| |
RealTimeSQLMonitor.gif | manage | 10.2 K | 2021-03-09 - 21:16 | PaulEllis | |
| |
SQLExecution.gif | manage | 49.2 K | 2021-03-10 - 17:03 | PaulEllis | |
| |
Top100.gif | manage | 19.7 K | 2021-03-10 - 17:02 | PaulEllis |
Contributions are governed by our Terms of Use. Please read the following disclaimer.
Dashboards and work items are no longer publicly available, so some links may be invalid. We now provide similar information through other means. Learn more here.

