How to PD the several minute delay in display of saved work item query
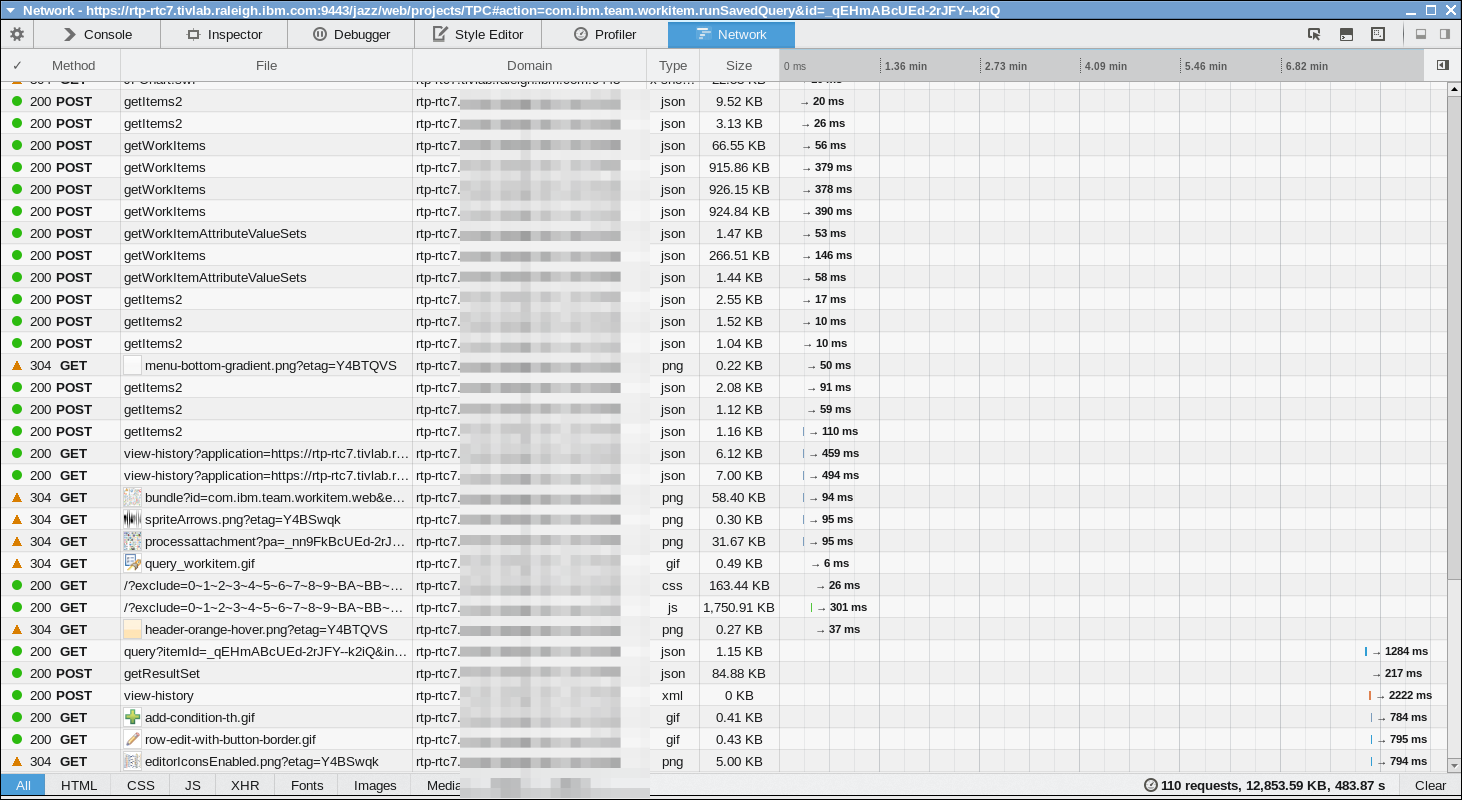
RTC 5.0.2 ifix003. On one of our repositories, one project exhibits very slow display of a saved query and I've captured the n/w transactions using Firefox web console:

During this gap, several "Unresponsive Script" warnings come about. I will say that there are entries in jazz log complaining about a Value Set and a work item not having an attribute configured. This condition has been present for months, if not years, but the display of saved queries was quite responsive.
After the pain of the initial display of a query in one's browser, other queries are displayed as expected. I've tried on RHEL 6.6 w Firefox 31 and Opera 12.14, Windows 7 and Internet Explorer.
I'm sure it's not Rose Mary Woods to blame.
2 answers
Comments
What is unclear, the Rose Mary Woods reference ? ;-) A certain project when a first attempt to open a saved query is done, 6-10 minutes go by with possible multiple "Unresponsive Script" warnings. The screen shot is the browser network activity captured with Firefox Web Console.
I suspect a bad Value Provider may be contributing, so what I plan to do is export the project config as a template and create project from it in a separate repo.
I have checked many of our very busy project areas ( across several repos, no others exhibit this behavior )
"How to PD the several minute gap in display of saved work item query" - no idea what that means.
The Text is a description and not a question.
Anyway, I'd suggest to contact support. They can ask for access or log data and also advise how to get that data. The forum can answer a lot of questions, but not debug performance issues.
Opened PMR.