Sizing and tuning guide for Rational DOORS Next Generation 5.0
Authors: BalakrishnaKollaBuild basis: Rational DOORS Next Generation (RDNG) 5.0
- Introduction
- Standard disclaimer
- Topology
- Tested hardware and software configurations
- Test data shape and volume
- Workload characterization
- Test goals
- Jazz Team Server hardware and JVM configuration (for repositories of all sizes)
- Database server hardware
- Proxy server hardware and configuration (for repositories of all sizes)
- RM server hardware configuration and tuning
- General configuration and tuning for all deployments
- Repository-specific configuration and tuning
- Summary
- Appendix A: Server performance benchmarks
- Using the CPU workload: sysbench --test=cpu --cpu-max-prime=20000 --num-threads=2 run
- Using the threads workload: sysbench --test=threads --thread-locks=1 --max-time=20s run
- Using the mutex workload: sysbench --test=mutex --num-threads=64 run
- Using the memory workload: sysbench --test=memory --num-threads=4 run
- Appendix B: Hard disk performance benchmarks
- Appendix C: Large project performance
- Appendix D: IBM Flash storage
Introduction
In IBM® Rational® DOORS® Next Generation (RDNG), administrators can configure ther hardware and software to support user load on repositories of varied sizes. The Requirements Management (RM) team, who develop Rational DOORS Next Generation, know that a one size fits all configuration cannot satisfy the large variation in scalability requirements. The team tested the performance of the RM server on various repository sizes with various hardware and software configurations in order to create guidance for hardware and server tuning. You can use that guidance to determine which sizing and tuning settings most closely match your scalability requirements. The guidance is based on the results of performance tests that the team ran on many hardware and software configurations. For details about the hardware to deploy and the server tuning settings for repositories, see the "RM server hardware configuration and tuning section."Standard disclaimer
The information in this document is distributed AS IS. The use of this information or the implementation of any of these techniques is a customer responsibility and depends on the customer's ability to evaluate and integrate them into the customer's operational environment. While each item may have been reviewed by IBM for accuracy in a specific situation, there is no guarantee that the same or similar results will be obtained elsewhere. Customers attempting to adapt these techniques to their own environments do so at their own risk. Any pointers in this publication to external Web sites are provided for convenience only and do not in any manner serve as an endorsement of these Web sites. Any performance data contained in this document was determined in a controlled environment, and therefore, the results that may be obtained in other operating environments may vary significantly. Users of this document should verify the applicable data for their specific environment. Performance is based on measurements and projections using standard IBM benchmarks in a controlled environment. The actual throughput or performance that any user will experience will vary depending upon many factors, including considerations such as the amount of multi-programming in the user's job stream, the I/O configuration, the storage configuration, and the workload processed. Therefore, no assurance can be given that an individual user will achieve results similar to those stated here. This testing was done as a way to compare and characterize the differences in performance between different versions of the product. The results shown here should thus be looked at as a comparison of the contrasting performance between different versions, and not as an absolute benchmark of performance.Topology
The topology that was used in our testing is based on the standard (E1) Enterprise - Distributed / Linux / DB2 topology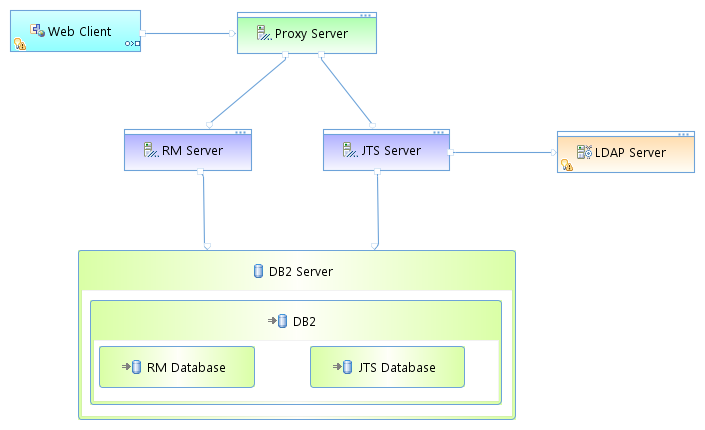 Key:
Key: - RM Server: Rational DOORS Next Generation Server
- JTS: Jazz Team Server
Tested hardware and software configurations
All of the hardware that was tested was 64 bit and supported hyperthreading. To determine the guidelines for repositories of varied sizes, the RM team used variations of physical memory, java heap and hard disk types. For details about hardware configurations and JVM settings for various repository sizes, see the "RM server hardware configuration and tuning" section. The following table shows the server hardware configurations that were used for all of the tests of all repository sizes.|
Function |
Number of machines |
Machine type |
Processor/machine |
Total processor cores/threads |
Memory/machine |
Network interface |
OS and version |
|
|
Proxy Server (IBM HTTP Server and WebSphere Plugin) |
1 |
IBM System x3550 M4 |
2 x Intel Xeon E5-2640 2.5 GHz (six-core) With Intel® Hyper-Threading Technology |
12/24 |
32 GB |
Gigabit Ethernet |
Red Hat Enterprise Linux Server release 6.3 (Santiago) |
|
|
Jazz Team Server WebSphere Application Server 8.5.5.1 |
1 |
IBM System x3550 M4 |
2 x Intel Xeon E5-2640 2.5 GHz (six-core) With Intel® Hyper-Threading Technology |
12/24 |
32 GB |
Gigabit Ethernet |
Red Hat Enterprise Linux Server release 6.3 (Santiago) |
|
|
RM server WebSphere Application Server 8.5.5.1 |
1 |
IBM System x3550 M4 |
2 x Intel Xeon E5-2640 2.5 GHz (six-core) With Intel® Hyper-Threading Technology |
12/24 |
Varied, depending on the repository size and hard disk type. 32 GB to 128 GB |
Gigabit Ethernet |
Red Hat Enterprise Linux Server release 6.3 (Santiago) |
|
|
Database server DB2 10.1.2 |
1 |
IBM System x3650 M4 |
2 x Intel Xeon E5-2640 2.5 GHz (six-core) With Intel® Hyper-Threading Technology |
12/24 |
32 GB |
Gigabit Ethernet |
Red Hat Enterprise Linux Server release 6.3 (Santiago) |
|
|
Network switches |
N/A |
Cisco 2960G-24TC-L |
N/A |
N/A |
|
Gigabit Ethernet |
24 Ethernet 10/100/1000 ports |
|
Test data shape and volume
The test data that was used for these sizing guide tests represents extremely large repositories compared to most environments that are currently deployed. The RM team chose three repository sizes to test the limits of the RM application.See Appendix C for a fourth data shape of 1M artifacts split into two equal projects.
You can choose the appropriate hardware and software configuration based on your scalability goals and requirements. The artifacts, modules, comments, links, and other elements were evenly distributed among the projects. Each project had data as shown in the following table.
|
Artifact type |
Number |
|
Large modules (10,000 artifacts) |
2 |
|
Medium modules (1500 artifacts) |
40 |
|
Small modules (500 artifacts) |
10 |
|
Folders |
119 |
|
Module artifacts |
85000 |
|
Non-module artifacts |
1181 |
|
Comments |
260582 |
|
Links |
304029 |
|
Collections |
14 |
|
Public tags |
300 |
|
Private tags |
50 |
|
Views |
200 |
|
Terms |
238 |
|
Artifact type |
500,000-artifact |
1-million-artifact |
2-million-artifact |
|
Projects |
6 |
12 |
24 |
|
Large modules (10,000 artifacts) |
12 |
24 |
48 |
|
Medium modules (1500 artifacts) |
240 |
480 |
960 |
|
Small modules (500 artifacts) |
60 |
120 |
240 |
|
Folders |
714 |
1428 |
2856 |
|
Module artifacts |
510,000 |
1,020,000 |
2,040,000 |
|
Non-module artifacts |
7086 |
14,172 |
28344 |
|
Comments |
1,563,492 |
3,126,984 |
6,253,968 |
|
Links |
1,824,174 |
3,648,348 |
7,296,696 |
|
Collections |
84 |
168 |
336 |
|
Public tags |
1800 |
3600 |
7200 |
|
Private tags |
300 |
600 |
1200 |
|
Views |
1200 |
2400 |
4800 |
|
Terms |
1428 |
2856 |
5712 |
|
Index size on disk |
39 GB |
79 GB |
157 GB |
Workload characterization
IBM® Rational® Performance Tester was used to simulate the workload. A Rational Performance Tester script was created for each use case. The scripts are organized by pages; each page represents a user action. Users were distributed into many user groups and each user group repeatedly runs one script (use case). The RM team used the user load stages in Rational Performance Tester to capture the performance for various user loads. The user stages that were used to simulate the load were as follows:- 100 Users
- 200 Users
- 300 Users
- 400 Users
- 425 Users
- 450 Users
- 475 Users
- 500 Users
|
Use case |
Description |
Number of users |
|---|---|---|
|
Copy/Paste/Move/Delete |
Open a module that contains 1500 artifacts, select 25 artifacts, move them by using the copy and paste functions, and then delete the copied artifacts. |
1% |
|
Create an artifact |
Create non-module artifacts. |
3% |
|
Create a collection |
Create collections that contain 10 artifacts. |
2% |
|
Create a module artifact end-to-end scenario |
Open a medium module that contains 1500 artifacts, create a module artifact, edit the new artifact, and delete the new artifact. |
12% |
|
Create a small module artifact end-to-end scenario |
Open a small module that contains 500 artifacts, create a module artifact, edit that new artifact, and delete the new artifact. |
3% |
|
Create a comment in a module artifact |
Open a medium module that contains 1500 artifacts, open an artifact that is in the module, expand the Comments section of the artifact, and create a comment. |
17% |
|
Create a module artifact link by dragging an artifact between modules |
Open a medium module that contains 1500 artifacts in a new browser tab and change the column settings to show links of the LinkTo type. Return to the other browser tab and open another module that contains 1500 artifacts. Drag one requirement to the module in the new tab and drop it on one of the cells in the LinkTo column. When you are prompted, create a link. |
6% |
|
Display module history |
Open a module that contains 1500 artifacts and show the module history and the module audit history. |
1% |
|
Hover over a module artifact and edit it |
Open a module that contains 1500 artifacts and hover over an artifact. When the rich hover is displayed, edit the artifact text. |
2% |
|
Hover over and open a collection |
Display all of the collections, hover over a collection, and then open it. |
1% |
|
Manage folders |
Click Show Artifacts to display folder tree and then create a folder. Move the new folder into another folder and then delete the folder that you just created. |
1% |
|
Open the RM admin page |
Open the rm/admin page. |
1% |
|
Open the project dashboard |
Open a dashboard that displays the default dashboard. |
4% |
|
Search by ID and string |
Open a project, select a folder, search for an artifact by its numeric ID, and click a search result to display an artifact. Search for artifacts by using a generic string search that produces about 50 results. |
9% |
|
Scroll 20 pages in a module |
Open a module that contains 1500 artifacts and then scroll through 20 pages. |
19% |
|
Switch the module view |
Open a module that contains 1500 artifacts and then change the view to add columns that display user-defined attributes. |
14% |
|
Upload a 4 MB file as a new artifact |
Upload a file and create an artifact. |
4% |
|
Review a module |
Open a module that contains 1500 artifacts and create a review of the module. This use case is unique and complex. |
1 user, irrespective of how many users are in the stage |
|
Import a ReqIF module that contains 1000 artifacts |
Upload a ReqIF file and import it to create a module that contains 1000 artifacts. |
1 user, irrespective of how many users are in the stage |
Throughput of tests
As explained in the workload characterization, the test load was aggressive and it simulated the load of very active users. After the users were logged in, they continuously ran the scripts, waiting for only 1 minute before running each page. During the tests, transaction throughput statistics were gathered. Those statistics were the basis for the high-level overview of server activity that is shown in the next table.|
Server activity |
100 users in 1 hour |
100 users in 8 hours |
400 users in 8 hours |
|
Number of artifacts created |
412 + 1000 = 1412 |
3296 + 8000 = 11296 |
3296 + 8000 = 21184 |
|
Number of artifacts opened |
505 |
4040 |
16160 |
|
Number of artifacts edited or deleted |
500 |
4000 |
16000 |
|
Display a list of modules |
600 |
4800 |
19200 |
|
Comments created |
204 |
1632 |
1632 |
|
Links created |
72 |
572 |
2288 |
|
Modules opened |
740 |
5920 |
23680 |
|
Search by ID and open the artifact |
131 |
1048 |
4192 |
|
Search by string |
135 |
1080 |
4320 |
|
Switch module view to filter by attribute |
274 |
2192 |
8768 |
|
Number of module pages scrolled |
1032 |
8256 |
33024 |
|
Review module |
1 per hour, irrespective of the number of users |
8 |
8 |
Test goals
The RM team ran many tests with varied hardware configurations on different repository sizes. The goal was to identify the hardware configuration that yields the best performance and scalability for a given repository. For each test, only the configuration of the RM server was changed. And the same hardware and software tuning were used for Jazz Team Server and the database server, irrespective of the repository size. For the results and the corresponding guidance, see the RM server hardware configuration and tuning section.Jazz Team Server hardware and JVM configuration (for repositories of all sizes)
As mentioned, this article provides guidance about the hardware and software configurations for the RM server. However, it is also important to know about the hardware and software configurations for Jazz Team Server. When Jazz Team Server was configured as described in this section, its resources were underutilized and the server was not on a critical path to slow down the server performance.Processor for Jazz Team Server
The team used IBM System x3550 M4 with 2 x Intel Xeon E5-2640 2.5 GHz (six-core). The total number of processor cores/machines was 24. For information about the performance benchmark of this server, see Appendix A.Physical memory for Jazz Team Server
For all of the large repositories that were tested, 32 GB of RAM was used.JVM heap and GC tuning
In general, the team used 50% of the available RAM as the JVM heap size and did not exceed the maximum heap size of 24 GB. Because the Jazz Team Server had 32 GB of RAM, the team used 16 GB for the maximum heap size. The JVM arguments that the team used to set the JVM heap sizes and the GC policy are as follows:-Xgcpolicy:gencon Xmx16g Xms16g Xmn4G -Xcompressedrefs -Xgc:preferredHeapBase=0x100000000
Database server hardware
The database server that was used for the testing was IBM DB2 enterprise version 10.1.2. The same hardware and database settings were used for all of the performance tests, irrespective of the repository size. In the teams observation, the database server is not on a critical path; however, in certain cases, having a higher end server will improve performance.Processor
The team used IBM System x3550 M4 with 2 x Intel Xeon E5-2640 2.5 GHz (six-core). The total number of processor cores/machines was 24. In the tests, one server was used for both the Jazz Team Server and RM databases. For the benchmark test results of the server performance, see Appendix A.Physical memory
For repositories of all sizes, the database server used 32 GB of RAM.Performance of RM server using various database vendors
As mentioned, the team used the DB2 server with same hardware configuration for repositories of all sizes. In tests that internal teams completed, those teams observed that the RM sever yields the same performance, irrespective of the database vendor. Follow the database tuning guidance that the corresponding database vendor recommends, and make sure that you have enough hard disk space to support large-scale deployments.Hard disk capacity and configuration
The database servers should use the RAID 10 configuration with the RAID controller configured with "write back cache." In general, the database server does not slow the performance of the RM server. However, because large amounts of data are saved in the database, use a high capacity and high performing hard disk (10K RPM or better). For the hard disk performance benchmarks for the hard disks that were used on the DB2 server, see Appendix B.|
Repository |
Combined hard disk usage of the Jazz Team Server and RM databases |
Hard disk size |
|
Up to 500,000 artifacts |
~100 GB |
300 GB |
|
Up to1 million artifacts |
~150 GB |
400 GB |
|
Up to 2 million artifacts |
~300 GB |
700 GB |
Proxy server hardware and configuration (for repositories of all sizes)
The team used the same server hardware to test repositories of all sizes. In general, the proxy server does not slow the performance of the RM server.Processor
The team used IBM System x3550 M4 with 2 x Intel Xeon E5-2640 2.5 GHz (six-core). The total number of processor cores/machines was 24 for Jazz Team Server. For the performance benchmarks of the server, see Appendix A.Physical memory
For all of the large repositories that were tested, 32 GB of RAM was used.IHS tuning
For the IHS systems that were used during the tests, in the server pool regulation section (worker.c) of httpd.conf file, these parameters were configured:| ThreadLimit | 25 |
| ServerLimit | 100 |
| StartServers | 2 |
| MaxClients | 2500 |
| SpareThreads | 25 |
| MaxSpareThreads | 500 |
| ThreadsPerChild | 25 |
| MaxRequestsPerChild | 0 |
RM server hardware configuration and tuning
The goal of the RM team was to test the performance of the RM server with various hardware and software configurations and keep the configurations of Jazz Team Server and the DB2 server constant irrespective of the RM repository size. The information in this section is applicable to the RM server only, but the hardware specifications of Jazz Team Server and the DB2 server are mentioned for reference. Based on the test results, the team created two categories of guidance. The first category applies to general server tuning for repositories of all sizes. The only guidance that varies based on the repository size is the guidance about the RM server. Otherwise, the guidance applies to repositories of all sizes.General configuration and tuning for all deployments
Follow this tuning guidance for all deployments, irrespective of the repository shape and size.Available TCP/IP ports
The default number of TCP/IP ports that are available on AIX and Linux operating systems is too low and must be increased. Windows operating systems have a higher default limit, but that limit might still be too low for large concurrent user loads. Use the following instructions to increase the port range.- On AIX and Linux systems, set the limit as follows: ulimit -n 65000
- On Windows 2003 Server, follow these steps:
- Open the registry.
- Navigate to HKEY_LOCAL_MACHINE/SYSTEM/CurrentControlSet/Services/Tcpip/Parameters and create a dWord named MaxUserPort. Set its value to 65000.
- Restart the computer.
- On Windows 2008 Server, follow the instructions in this Microsoft support article to change the dynamic port range. For the start port setting, use 2000. Set the number of ports to 63535.
Thread pool size
The WebSphere Application Server thread pool size must be increased from the default of 50 to 0.75 times the expected user load. For example, if you have 400 concurrent users, the thread pool maximum is 300.Database optimization
To ensure optimal database performance, ensure that the database is fully optimized. With both DB2 and Oracle, you can run statistics to allow the databases to analyze the shape of a schema and optimize the contents. Databases generally manage statistics automatically; for example, in a scheduled overnight operation. However, to ensure that the database is fully optimized, you can manually run the statistics as follows. DB2DB2 REORGCHK UPDATE STATISTICS ON TABLE ALLTo reduce the startup time of large deployments, adjust the buffer pool size on the DB2 database. Use 300000 pages (16 K page size). Oracle
EXEC DBMS_STATS.gather_schema_stats(' JAZZDBUSER' );
More suggestions
In a 3-server topology, where Jazz Team Server and the RM server are on separate hardware, adjust two settings in the fronting.properties file for loads higher than 200 concurrent users.- Ensure that com.ibm.rdm.fronting.server.connection.route.max equals the number of users, which in this test was 500.
- Ensure that com.ibm.rdm.fronting.server.connection.max is twice the value of number of users, which in this test was 1000.
Repository-specific configuration and tuning
Repositories with up to 200,000 artifacts: RM server hardware and JVM tuning
The team tested the RM server on fairly large deployments (500,000 to 2 million artifacts). To support the large repositories, higher end servers and a high availability of RAM on the servers are required. But for small-scale deployments (up to 200,000 RM artifacts), the hardware and JVM heap configurations that are described in this section are suitable.Processor
As mentioned earlier, the team tested the large-scale deployments by using IBM System x3550 M4 with 2 x Intel Xeon E5-2640 2.5 GHz (six-core) with a total number of 24 processor cores/machines. For small-scale deployments of repositories with up to 200,000 RM artifacts, the same processor performance is not required. However, use a higher end server that closely matches the performance of these servers used for testing larger repositories. See Appendix A, for the performance benchmarks of the server used for testing the larger repositories.Physical memory
For repositories that contain up to 200,000 RM artifacts, use 16 GB of RAM.JVM heap and GC tuning
Set the maximum heap size to 8 GB. To set the GC policy and arguments and the max and init heap sizes, use the following JVM parameters (specified in generic JVM arguments).-Xgcpolicy:gencon Xmx8g Xms8g Xmn2700M -Xcompressedrefs -Xgc:preferredHeapBase=0x100000000
Repositories with up to 500,000 artifacts: RM server hardware and JVM tuning
Performance test results for the 500,000-artifact repository
As shown in the following chart, the 500,000-artifact repository was tested with three variations in the hardware. The goal was to find the amount of RAM that is required on the RM server to yield the maximum number of users supported. Tests were completed with same servers but with varied sizes of available RAM on the RM sever. In addition, the heap was adjusted to not exceed 50% of the RAM and not to exceed 24 GB of the maximum heap size.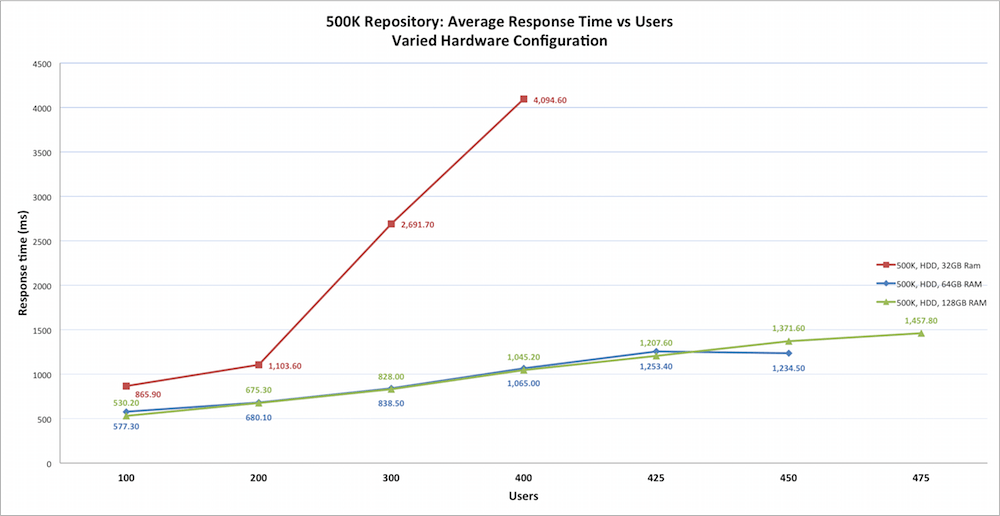 The following table shows the various hardware configurations with RAM and heap sizes and the maximum number of concurrent users that are supported in each hardware configuration.
|
RM server hardware and JVM configuration |
Graph |
Jazz Team Server |
DB2 server |
Number of users supported |
|
32 GB RAM with 16 GB JVM heap |
|
32 GB RAM with 16 GB JVM heap |
32 GB RAM |
200 |
|
64 GB RAM with 24 GB JVM heap |
|
32 GB RAM with 16 GB JVM heap |
32 GB RAM |
450 |
|
128 GB RAM with 24 GB JVM heap |
|
32 GB RAM with 16 GB JVM heap |
32 GB RAM |
475 |
RM server hardware and JVM tuning guidance for the 500,000-artifact repository
The following guidance is based on the test results.Processor
Use a server that yields performance that is as close as possible to the performance of the server that was used for testing. The team used IBM System x3550 M4 with 2 x Intel Xeon E5-2640 2.5 GHz (six-core). The total number of processor cores/machines was 24. For the performance benchmarks of the server, see Appendix A. You can use those performance benchmarks as reference and compare them with the performance of your server. Be sure to use a server that matches or exceeds the performance benchmarks in this article.Physical memory and hard disk
Use a high performing hard disk drive (HDD). For the specifications and performance benchmarks of the hard disks that were used during testing, see Appendix B. In your deployment, try to match the performance of those hard disks.- To support up to 200 users, have at least 32 GB of RAM.
- To support up to 450 users, have at least 64 GB of RAM.
- To support up to 475 users, have at least 128 GB of RAM.
JVM heap and GC tuning
For 32 GB of RAM, set the maximum heap size to 16 GB. For RAM configurations that are higher than 32 GB, set the maximum heap size to 24 GB. For testing purposes, the following JVM parameters (specified in generic JVM arguments) were used to set the GC policy and the max and init heap size arguments.- Server with 32 GB RAM
-Xgcpolicy:gencon Xmx16g Xms16g Xmn5700M -Xcompressedrefs -Xgc:preferredHeapBase=0x100000000
- Server with 64 GB or higher RAM
-Xgcpolicy:gencon Xmx24g Xms24g Xmn8G -Xcompressedrefs -Xgc:preferredHeapBase=0x100000000
Repositories with up to 1 million artifacts: RM server hardware and JVM tuning
Performance test results for the 1-million-artifact repository
As shown in the following chart, the RM server was tested with 1 million artifacts and six different variations in the hardware and JVM configurations of the server. The goal was to benchmark the RM server performance on an HDD, a SAN, and an SSD with varied RAM and heap sizes.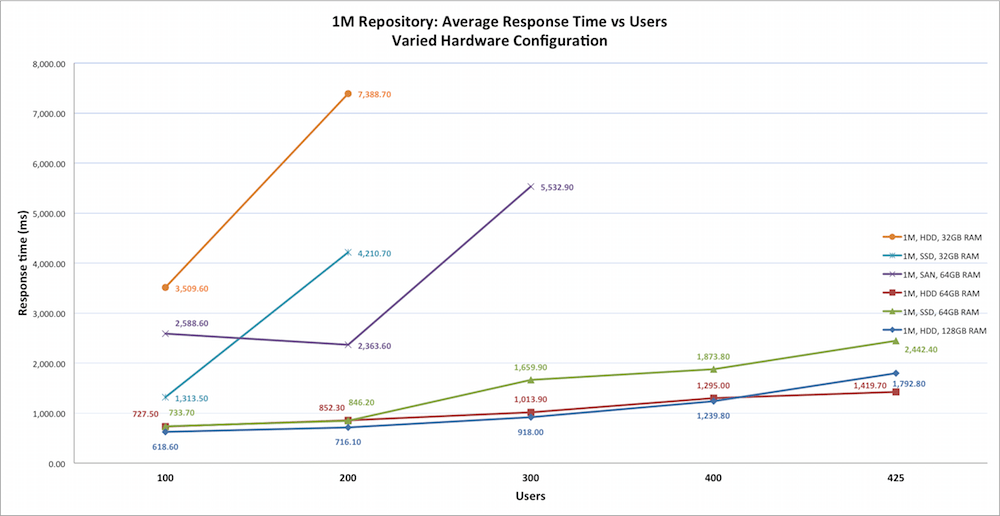 The following table outlines the different hardware and JVM heap configurations and the maximum number of users that are supported in each configuration.
|
RM server hardware and JVM configuration |
Graph |
Jazz Team Server |
DB2 server |
Number of users supported |
|
HDD 32 GB RAM with 16 GB JVM heap |
|
32 GB RAM with 16 GB JVM heap |
32 GB RAM |
50 |
|
SSD 32 GB RAM with 16 GB JVM heap |
|
32 GB RAM with 16 GB JVM heap |
32 GB RAM |
150 |
|
SAN 64 GB RAM with 24 GB JVM heap |
|
32 GB RAM with 16 GB JVM heap |
32 GB RAM |
200 |
|
HDD 64 GB RAM with 24 GB JVM heap |
|
32 GB RAM with 16 GB JVM heap |
32 GB RAM |
425 |
|
SSD 64 GB RAM with 24 GB JVM heap |
|
32 GB RAM with 16 GB JVM heap |
32 GB RAM |
425 |
|
HDD 128 GB RAM with 24 GB JVM heap |
|
32 GB RAM with 16 GB JVM heap |
32 GB RAM |
425 |
Observations on the test results
- An HDD with 32 GB RAM can hardly support 100 users. Although it can sustain the user load of up to 200 users, the performance is very poor and the users will experience long waits for page loads and timeouts for queries.
- Increasing RAM beyond 64 GB did not yield additional user scalability or improvement in performance.
- Using an SSD with 64 GB RAM did not yield additional user scalability compared to using an HDD with 64 GB of RAM.
- When testers used a SAN with 64 GB RAM, it did not match the response time or user scalability of 64 GB RAM with a regular HDD.
RM server hardware and JVM tuning guidance for the 1-million-artifact repository
The following guidance is based on the test results.Processor
Use a server that yields performance that is as close as possible to the performance of the server that was used for testing. For testing, the RM team used IBM System x3550 M4 with 2 x Intel Xeon E5-2640 2.5 GHz (six-core) with a total of 24 processor cores/machines. For the performance benchmarks of the server, see Appendix A. Be sure to use a server that matches or exceeds the performance benchmarks.Physical memory and hard disk
Use a high-performing hard disk drive (HDD) with high available RAM. For the specifications and performance benchmarks of the hard disks that were used during testing, see Appendix B.- Use an SSD with 32 GB of RAM to support up to 150 user load with reasonable response time.
- Use an HDD with 64 GB of RAM to support up to 425 user load with reasonable response time.
JVM heap and GC tuning
For 32 GB of RAM, set the maximum heap size to 16 GB. For RAM configurations that are higher than 32 GB, set the maximum heap size to and 24GB. For testing purposes, the following JVM parameters (specified in generic JVM arguments) were used to set the GC policy and the max and init heap size arguments.- Server with 32 GB RAM
-Xgcpolicy:gencon Xmx16g Xms16g Xmn5700M -Xcompressedrefs -Xgc:preferredHeapBase=0x100000000
- Server with 64 GB or higher RAM
-Xgcpolicy:gencon Xmx24g Xms24g Xmn8G -Xcompressedrefs -Xgc:preferredHeapBase=0x100000000
Repositories with up to 2 million artifacts
Performance test results for the 2-million-artifact repository
As shown in the following chart, the RM server was tested with 2 million artifacts and three variations in the hardware and JVM configurations of the server. The goal was to benchmark the RM server performance on an HDD, SSD, and a SAN with varied RAM and heap sizes.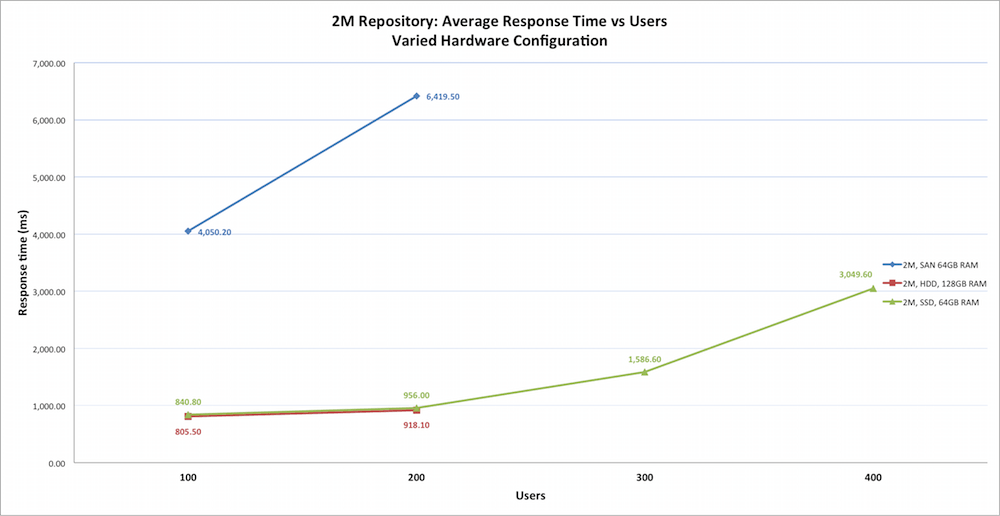 The following table outlines the different hardware and JVM heap configurations and the maximum number of users that are supported in each configuration.
|
RM server hardware and JVM configuration |
Graph |
Jazz Team Server |
DB2 server |
Number of users supported |
|
SAN 64 GB RAM with 24 GB JVM heap |
|
32 GB RAM with 16 GB JVM heap |
32 GB RAM |
<100 |
|
HDD 128 GB RAM with 24 GB JVM heap |
|
32 GB RAM with 16 GB JVM heap |
32 GB RAM |
200 |
|
SSD 64 GB RAM with 24 GB JVM heap |
|
32 GB RAM with 16 GB JVM heap |
32 GB RAM |
300 |
Observations on the test results
- An SSD with 64 GB RAM yielded the maximum user scalability with reasonable performance.
- An HDD with 128 GB RAM also yielded good performance until the user load reached 200.
RM server hardware and JVM tuning guidance for the 2-million-artifact repository
The following guidance is based on the test results.Processor
Use a server that yields performance that is as close as possible to the performance of the server that was used for testing. The RM team used IBM System x3550 M4 with 2 x Intel Xeon E5-2640 2.5 GHz (six-core) with 24 processor cores/machines. For the performance benchmarks of that server, see Appendix A. Use a server that matches or exceeds those performance benchmarks.Physical memory and hard disk
Use a solid state hard disk drive (SSD). Use the high performing hard disk. For the specifications and performance benchmarks of the hard disks that were used during testing, see Appendix B.- Use an HDD with 128 GB of RAM to support up to a 200 user load with reasonable response time.
- Use an SSD with 64 GB of RAM to support up to a 300 user load with reasonable response time.
JVM heap and GC tuning
Set the maximum heap size to 24 GB. For testing purposes, the following JVM parameters (specified in generic JVM arguments) were used to set the GC policy and the max and init heap size arguments.-Xgcpolicy:gencon Xmx24g Xms24g Xmn8G -Xcompressedrefs -Xgc:preferredHeapBase=0x100000000
Summary
The following hardware configuration for the RM server is based on the results of the performance tests on various hardware configurations and JVM tunings. This guidance is based on the assumption that the server hardware matches or exceeds the performance benchmarks that are specified in Appendix A and Appendix B.|
Repository size |
200 users |
400 users |
|
200,000 requirements |
16 GB RAM, HDD 8 GB JVM max heap size |
32 GB RAM, HDD 16 GB JVM max heap size |
|
500,000 requirements |
32 GB RAM, HDD 16 GB JVM max heap size |
64 GB RAM, HDD 24 GB JVM max heap size |
|
1 million requirements |
64 GB RAM, SAN 24 GB JVM max heap size |
64 GB RAM, HDD 24 GB JVM max heap size |
|
2 million requirements |
128 GB RAM, HDD 24 GB JVM max heap size |
64 GB RAM, SSD 24 GB JVM max heap size |
Appendix A: Server performance benchmarks
Various server performance benchmarks were captured by using Sysbench. The performance benchmarks were captured on the RM server.Using the CPU workload: sysbench --test=cpu --cpu-max-prime=20000 --num-threads=2 run
sysbench 0.4.12:  multi-threaded system evaluation benchmark

Running the test with following options:
Number of threads: 2

Doing CPU performance benchmark

Threads started!
Done.

Maximum prime number checked in CPU test: 20000

Test execution summary:
    total time:                          14.1921s
    total number of events:              10000
    total time taken by event execution: 28.3806
    per-request statistics:
         min:                                  2.81ms
         avg:                                  2.84ms
         max:                                  6.16ms
         approx.  95 percentile:               2.89ms

Threads fairness:
    events (avg/stddev):           5000.0000/5.00
    execution time (avg/stddev):   14.1903/0.00
Using the threads workload: sysbench --test=threads --thread-locks=1 --max-time=20s run
sysbench 0.4.12:  multi-threaded system evaluation benchmark

Running the test with following options:
Number of threads: 1

Doing thread subsystem performance test
Thread yields per test: 1000 Locks used: 1
Threads started!
Done.

Test execution summary:
    total time:                          2.4548s
    total number of events:              10000
    total time taken by event execution: 2.4534
    per-request statistics:
         min:                                  0.24ms
         avg:                                  0.25ms
         max:                                  0.64ms
         approx.  95 percentile:               0.25ms

Threads fairness:
    events (avg/stddev):           10000.0000/0.00
    execution time (avg/stddev):   2.4534/0.00
Using the mutex workload: sysbench --test=mutex --num-threads=64 run
sysbench 0.4.12:  multi-threaded system evaluation benchmark

Running the test with following options:
Number of threads: 64

Doing mutex performance test
Threads started!
Done.

Test execution summary:
    total time:                          1.8363s
    total number of events:              64
    total time taken by event execution: 113.1430
    per-request statistics:
         min:                               1526.83ms
         avg:                               1767.86ms
         max:                               1834.26ms
         approx.  95 percentile:            1831.69ms

Threads fairness:
    events (avg/stddev):           1.0000/0.00
    execution time (avg/stddev):   1.7679/0.07
Using the memory workload: sysbench --test=memory --num-threads=4 run
sysbench 0.4.12:  multi-threaded system evaluation benchmark

Running the test with following options:
Number of threads: 4

Doing memory operations speed test
Memory block size: 1K

Memory transfer size: 102400M

Memory operations type: write
Memory scope type: global
Threads started!
Done.

Operations performed: 104857600 (1513850.88 ops/sec)

102400.00 MB transferred (1478.37 MB/sec)


Test execution summary:
    total time:                          69.2655s
    total number of events:              104857600
    total time taken by event execution: 135.7675
    per-request statistics:
         min:                                  0.00ms
         avg:                                  0.00ms
         max:                                  0.72ms
         approx.  95 percentile:               0.00ms

Threads fairness:
    events (avg/stddev):           26214400.0000/2003181.97
    execution time (avg/stddev):   33.9419/0.65
Appendix B: Hard disk performance benchmarks
HDD performance of RM server measured using the fileio workload
sysbench --test=fileio --file-total-size=150G --file-test-mode=rndrw --max-time=300 --max-requests=0 run
sysbench 0.4.12:  multi-threaded system evaluation benchmark

Running the test with following options:
Number of threads: 1

Extra file open flags: 0
128 files, 1.1719Gb each
150Gb total file size
Block size 16Kb
Number of random requests for random IO: 0
Read/Write ratio for combined random IO test: 1.50
Periodic FSYNC enabled, calling fsync() each 100 requests.
Calling fsync() at the end of test, Enabled.
Using synchronous I/O mode
Doing random r/w test
Threads started!
Time limit exceeded, exiting...
Done.

Operations performed:  64501 Read, 43000 Write, 137600 Other = 245101 Total
Read 1007.8Mb  Written 671.88Mb  Total transferred 1.6403Gb  (5.5981Mb/sec)
  358.28 Requests/sec executed

Test execution summary:
    total time:                          300.0506s
    total number of events:              107501
    total time taken by event execution: 292.2219
    per-request statistics:
         min:                                  0.00ms
         avg:                                  2.72ms
         max:                                298.61ms
         approx.  95 percentile:               6.50ms

Threads fairness:
    events (avg/stddev):           107501.0000/0.00
    execution time (avg/stddev):   292.2219/0.00
SSD performance of RM server measured using the fileio workload
sysbench --test=fileio --file-total-size=150G --file-te      st-mode=rndrw --max-time=300 --max-requests=0 run
sysbench 0.4.12:  multi-threaded system evaluation benchmark

Running the test with following options:
Number of threads: 1

Extra file open flags: 0
128 files, 1.1719Gb each
150Gb total file size
Block size 16Kb
Number of random requests for random IO: 0
Read/Write ratio for combined random IO test: 1.50
Periodic FSYNC enabled, calling fsync() each 100 requests.
Calling fsync() at the end of test, Enabled.
Using synchronous I/O mode
Doing random r/w test
Threads started!
Time limit exceeded, exiting...
Done.

Operations performed:  922042 Read, 614694 Write, 1966976 Other = 3503712 Total
Read 14.069Gb  Written 9.3795Gb  Total transferred 23.449Gb  (80.038Mb/sec)
 5122.45 Requests/sec executed

Test execution summary:
    total time:                          300.0002s
    total number of events:              1536736
    total time taken by event execution: 171.4439
    per-request statistics:
         min:                                  0.00ms
         avg:                                  0.11ms
         max:                                  3.46ms
         approx.  95 percentile:               0.25ms

Threads fairness:
    events (avg/stddev):           1536736.0000/0.00
    execution time (avg/stddev):   171.4439/0.00
Appendix C: Large project performance
Test data shape and volume
The large project tests were conducted using a 1 million artifact repository devided into two equal projects, with the data in the shape of the following table:|
Artifact type |
Number |
|
Large modules (10,000 artifacts) |
12 |
|
Medium modules (1500 artifacts) |
240 |
|
Small modules (500 artifacts) |
60 |
|
Folders |
370 |
|
Module artifacts |
510,000 |
|
Non-module artifacts |
7,086 |
|
Comments |
1,563,492 |
|
Links |
1,824,174 |
|
Collections |
84 |
|
Public tags |
1800 |
|
Private tags |
300 |
|
Views |
1200 |
|
Terms |
1,428 |
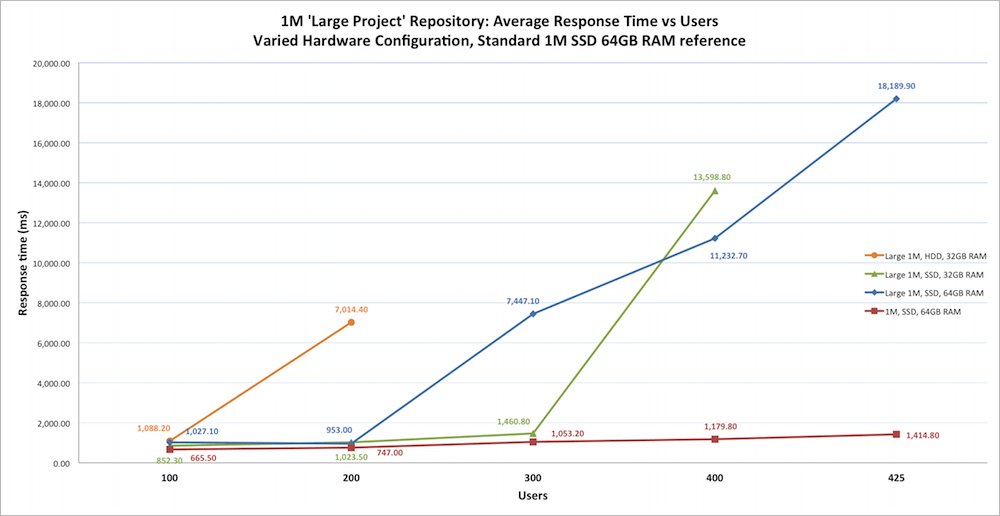
Performance test results for 1 million 'Large Projects'
As shown in the following chart, the RM server was tested with 1 million artifacts split between two identical 500,000 requirement projects. Three hardware configurations were used, with the goal to demonstrate the impact of having fewer and larger projects with the total artifact count being constant.Test results from 1 million artifacts across 12 projects on SSD and 64GB of RAM are included in this chart for a visual comparison.
 The following table outlines the different hardware and JVM heap configurations and the maximum number of users that are supported in each configuration.
|
RM server hardware and JVM configuration |
Graph |
Jazz Team Server |
DB2 server |
Number of users supported |
|
HDD 32 GB RAM with 16 GB JVM heap |
|
32 GB RAM with 16 GB JVM heap |
32 GB RAM |
100 |
|
SSD 32 GB RAM with 16 GB JVM heap |
|
32 GB RAM with 16 GB JVM heap |
32 GB RAM |
300 |
|
SSD 64 GB RAM with 24 GB JVM heap |
|
64 GB RAM with 24 GB JVM heap |
64 GB RAM |
300 |
|
'Standard' 1M SSD 64 GB RAM with 24 GB JVM heap |
|
64 GB RAM with 24 GB JVM heap |
64 GB RAM |
425 |
Observations on the test results
- All hardware configurations yield acceptable performance at 100 users.
- SSD-based hardware configurations can handle between 200 and 300 concurrent users with acceptable performance.
- An HDD with 32 GB RAM can support 100 users, but degrades beyond this user load. Although up to 200 users can be sustained, the performance is very poor and the users will experience long waits for page loads and timeouts for queries.
- Using an SSD with 64 GB RAM resulted in additional user scalability compared to using an SSD with 32 GB of RAM.
- This repository shape cannot sustain beyond 300 users while maintaining acceptable performance with any hardware configurations tested.
Appendix D: IBM Flash storage
The performance tests were conducted using a 2 million artifact repository deployed on IBM Flash Storage Solution.Performance test results for 2 million repository on Flash Storage Vs HDD
As shown in the following chart, the RDNG server was tested with 2 million artifacts using Flash Storage and HDD, with the goal to demonstrate the benefits of deploying the RDNG server on "IBM Flash Storage" when compared to regular HDD.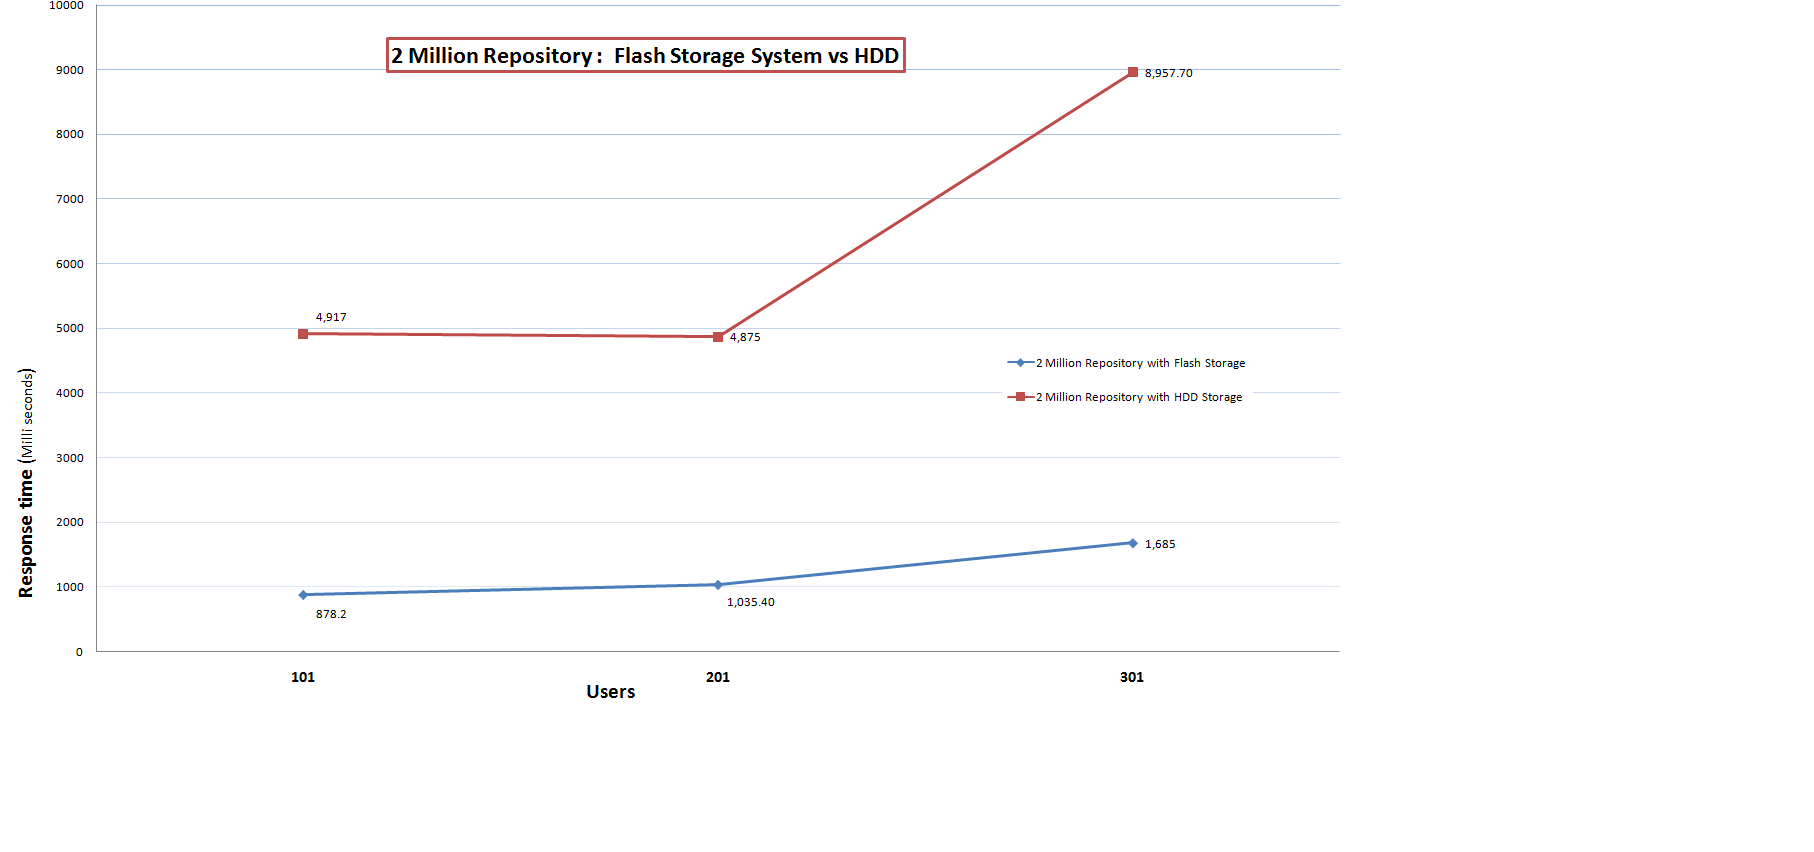
Observations on the test results
- When compared with HDD, Flash Storage Solution yielded up to 6 times better average response time, which results in a much better user experience as the wait time between the page loads will go down signifficantly with Flash Storage.
- Also the user scalability is atleast 3 times better with Flash Storage Solution when compared to the HDD. With HDD the server peaked its capacity at 100 user load and resulted in higher failure rates during and after 100 user load. Where as with the Flash Storage Solution the server was able to sustain the 300 user load with reasonable response time.
- Although there is a spike in average response time from 200 user load to 300 user load with flash storage, that ART is still within the limits and wouldn't cause signifficant delays in page loading.
Additional contributors: Devang Parikh, Knut Radloff, Erik Craig, Joe Stellrecht, Sentella Cystrunk, Gustaf Svensson, Laura W. Hinson
Questions and comments:
- What other performance information would you like to see here?
- Do you have performance scenarios to share?
- Do you have scenarios that are not addressed in documentation?
- Where are you having problems in performance?


| I | Attachment | Action | Size | Date | Who | Comment |
|---|---|---|---|---|---|---|
| |
1m.png | manage | 52.2 K | 2014-09-30 - 05:09 | UnknownUser | |
| |
1mlp.png | manage | 49.6 K | 2014-09-30 - 05:11 | UnknownUser | |
| |
2MFlashStorage.png | manage | 25.4 K | 2015-05-20 - 17:50 | UnknownUser | 2 Million Repository on Flash Storage vs HDD |
| |
2m.png | manage | 32.6 K | 2014-09-30 - 05:10 | UnknownUser | |
| |
500k.png | manage | 43.0 K | 2014-09-30 - 05:10 | UnknownUser |
Contributions are governed by our Terms of Use. Please read the following disclaimer.
Dashboards and work items are no longer publicly available, so some links may be invalid. We now provide similar information through other means. Learn more here.