This is the second in an occasional series of articles on how IBM does performance testing for the Jazz products. In Creating a performance simulation for Rational Team Concert using Rational Performance Tester - Part 1, I looked at how we build performance scripts, and provided a sample project which included the correlation rules we've built up over several years. In this article, I'll look at some of the common reasons performance tests can fail, and suggest ways of tuning your servers to avoid the common issues.
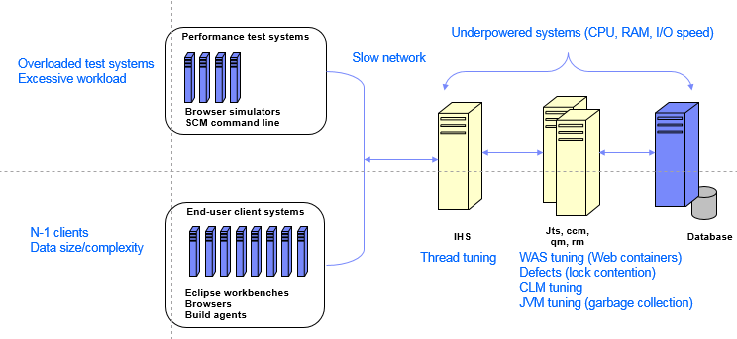 Sometimes the bottlenecks form because of tuning issues, or because of under-powered parts of the test infrastructure. When this happens, the system appears to hit a limit but this limit is artificially low. For example, the performance simulation tool requires hardware in order to run large numbers of users in parallel. The workload is usually spread across multiple machines, but if you don't have enough systems (or they aren't big enough), then the performance tool itself can become a bottleneck.
Another reason that bottlenecks may form is if the system is not tuned correctly to support a high degree of concurrent access. For Jazz deployments, there are three places which usually need to be adjusted before running a large number of users:
 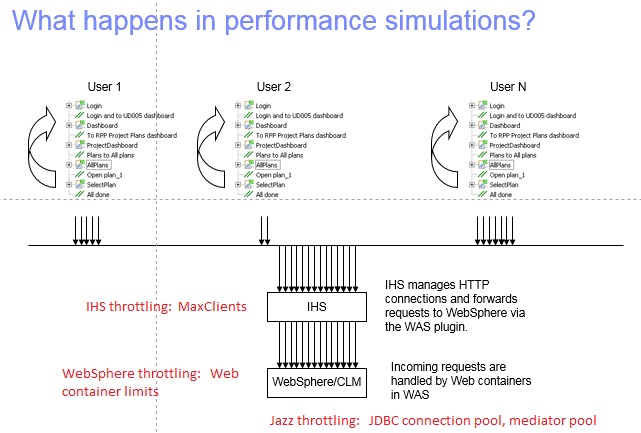 As the number of concurrent users goes up, you may run out of resources in one of more of these three places (the defaults are not particularly high). If that happens, you may see any of the following behaviors:
 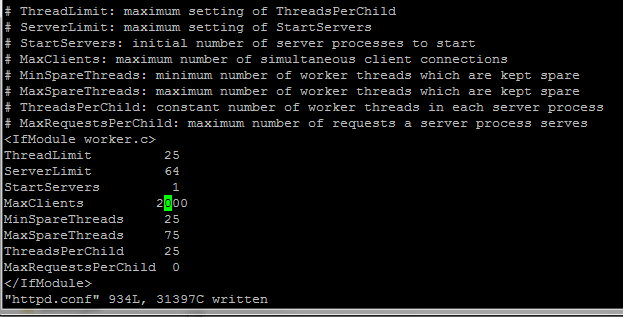 If the HTTP server runs out of threads, this is usually a side effect of an overloaded Jazz server. If the Jazz server is not processing transactions fast enough, the number of active threads in the application server will rise and this causes a rise in the number of active HTTP threads.
You can monitor the activity in the IBM HTTP Server by enabling the mod_mpmstats module. This will write thread usage information into the error_log file (see below). The useful parameters to watch are:
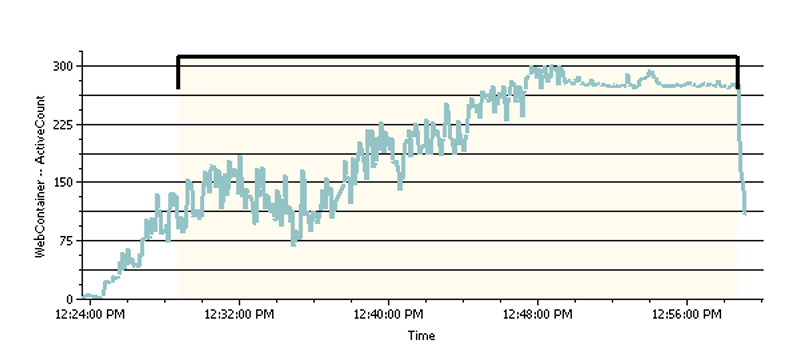
 If the system is not able to handle a given workload, the number of web containers used will increase, and eventually hit the limit. Once the limit is reached, the performance of the system will degrade sharply and the failure rate will increase. The web container usage under these containers will look more like this:
 Be sure that you have enough Web containers so that the server does not run out. This won't guarantee that performance will improve, but it will make it easier to understand where the system bottlenecks are. If you run out of Web containers, the system will fail in such a way as to make it difficult to understand what really happened.
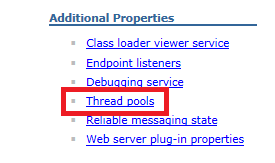
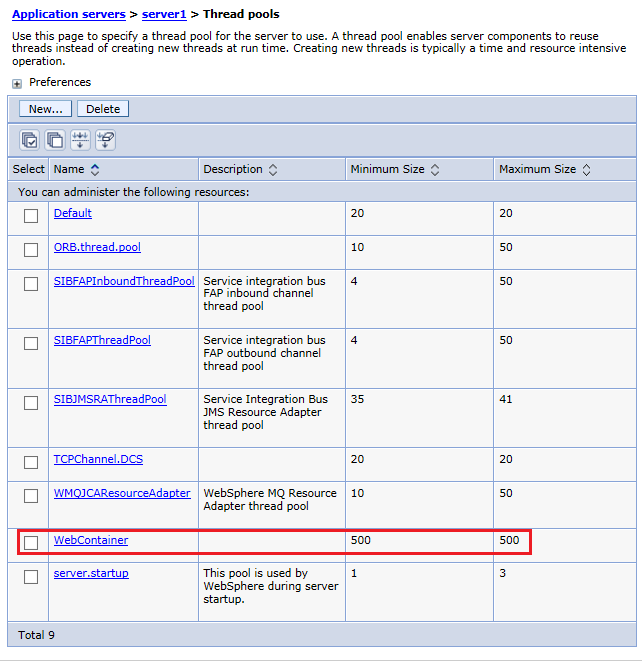
You can configure web container limits for Websphere in the "Thread pools" section of the Server configuration record, using the Websphere admin console. IBM's performance tests for Jazz productions commonly use values up to 500.
 You configure the pool sizes in the application's administration UI, in the Server -> Advanced Properties section. Configuration of the JDBC Connection pool happens here:
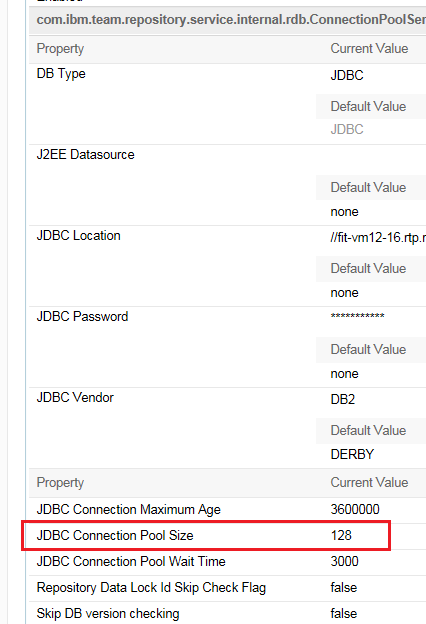 Configuration of the RDB mediator pool happens here:
 In our own performance testing, we often configure the size of both of these pools to be 500.
 Also adjust the Advanced Property setting of "Jazz Authentication token expiration time" if you're receiving HTTP 500 errors in the Jazz GUI.
What happens during performance testing?
The performance test process starts with the development of automation that can simulate the behavior of a population of users as they interact with a server. You then run the simulation, looking at how the system behaves as you increase the number of simulated users. You'll eventually reach a point some part of the system becomes a bottleneck, and where response times degrade to an unacceptable point; in some circumstances, a server may crash or hang under extreme load. The picture below highlights the most common places that can cause bottlenecks during a performance simulation: Sometimes the bottlenecks form because of tuning issues, or because of under-powered parts of the test infrastructure. When this happens, the system appears to hit a limit but this limit is artificially low. For example, the performance simulation tool requires hardware in order to run large numbers of users in parallel. The workload is usually spread across multiple machines, but if you don't have enough systems (or they aren't big enough), then the performance tool itself can become a bottleneck.
Another reason that bottlenecks may form is if the system is not tuned correctly to support a high degree of concurrent access. For Jazz deployments, there are three places which usually need to be adjusted before running a large number of users:
 - The number of threads in the reverse proxy/Web server
- The number of Web containers (for Websphere) or sessions (Tomcat)
- The JDBC and mediator pool values for the Jazz applications
 As the number of concurrent users goes up, you may run out of resources in one of more of these three places (the defaults are not particularly high). If that happens, you may see any of the following behaviors:
 - Connection timeouts
- Read timeouts
- A sudden sharp rise in response times
- Systems that become non-responsive or appear hung.
Tuning a Jazz system for heavy concurrent use
Tuning the reverse proxy/IBM HTTP Server
IBM's test configurations for Jazz products use an IBM HTTP server as a reverse proxy. We raise the value of MaxClients in httpd.conf (see below), often using 2500 as the setting (which allows 2500 active HTTP connections). If the HTTP server runs out of threads, this is usually a side effect of an overloaded Jazz server. If the Jazz server is not processing transactions fast enough, the number of active threads in the application server will rise and this causes a rise in the number of active HTTP threads.
You can monitor the activity in the IBM HTTP Server by enabling the mod_mpmstats module. This will write thread usage information into the error_log file (see below). The useful parameters to watch are:
 - bsy: number of busy threads
- wr: number of threads being processed by Websphere
- ka: number of idle threads being held open in the keep-alive state

Throttling in Websphere
If you are using the Websphere Application Server for your Jazz deployments, then you may need to increase the number of Web containers available. As a general rule, as the number of concurrent users goes up, the number of Web containers used at steady state will go up. There will be some fluctuation as the workload fluctuates, but if the system is keeping up, the Web container usage will be relatively stable (and should drop rapidly once the workload stops). You can use Rational Performance Tester to monitor web container usage; a normal usage pattern would be similar to this: If the system is not able to handle a given workload, the number of web containers used will increase, and eventually hit the limit. Once the limit is reached, the performance of the system will degrade sharply and the failure rate will increase. The web container usage under these containers will look more like this:
 Be sure that you have enough Web containers so that the server does not run out. This won't guarantee that performance will improve, but it will make it easier to understand where the system bottlenecks are. If you run out of Web containers, the system will fail in such a way as to make it difficult to understand what really happened.
You can configure web container limits for Websphere in the "Thread pools" section of the Server configuration record, using the Websphere admin console. IBM's performance tests for Jazz productions commonly use values up to 500.


Throttling in the Jazz applications
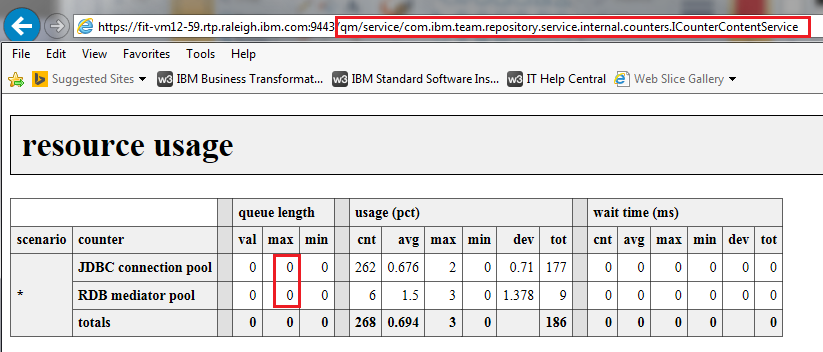
The next tuning parameters are in the Jazz applications themselves. There are two internal pools used by the Jazz products when they interact with the database server. The default size of these pools is 128. The code will request an object from the pool prior to issuing database requests, but if there are no free objects in the pool, then the code will wait until an object frees up. If the system is falling behind, you may see error messages written to the application logs, because the code will only wait for so long before timing out (default is to wait for 3 seconds). But it is also possible for a queue to form around access to these pools and not see errors in the logs. You can monitor the length of the queues by using the internal counters. These are available via a URL (see below). If you see a non-zero value for the max queue length of either the JDBC connection pool or the RDB mediator pool, you should increase the pool size. Note that there are separate settings for each Jazz application, so you should check and configure each application separately (impacted apps: Jazz Team Server, Rational Quality Manager, Rational Team Concert, DOORS Next Generation). You configure the pool sizes in the application's administration UI, in the Server -> Advanced Properties section. Configuration of the JDBC Connection pool happens here:
 Configuration of the RDB mediator pool happens here:
 In our own performance testing, we often configure the size of both of these pools to be 500.
Dashboard simulations
Dashboard simulations may fail under high levels of concurrency if the simulated dashboards run work item queries. The failure is usually an HTTP status 410, with an error message indicating that the query expired. You can work around this by increasing the query cache size (ccm/admin, Advanced Server properties, QueryService section). Set this value to be higher than the number of dashboard users you are simulating.Tuning systems for long runs
Another factor to consider when doing performance tests is the duration of the test. If a test runs long enough, authentication tokens may expire. If your test only logs in once, then you will eventually run into this if you run long enough. In a Web browser, this would not be a problem - the server would ask the Web browser to reauthenticate, and the browser would prompt the user to enter their credentials. However, Rational Performance Tester scripts are not flexible enough to respond to an authentication challenge. The best practice is to increase the authentication timeouts to be longer than your longest performance test. There are three different timeouts to configure:- The LTPA token timeout in Websphere (default expiration: 2 hours)
- The OAuth token timeout in Jazz (default expiration: 6 hours)
- Jazz Authentication token expiration time (default: 6 hours)
Authentication timeouts in Websphere
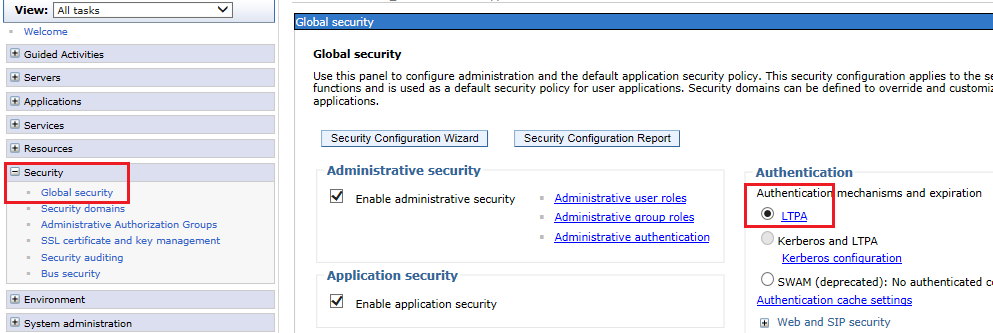
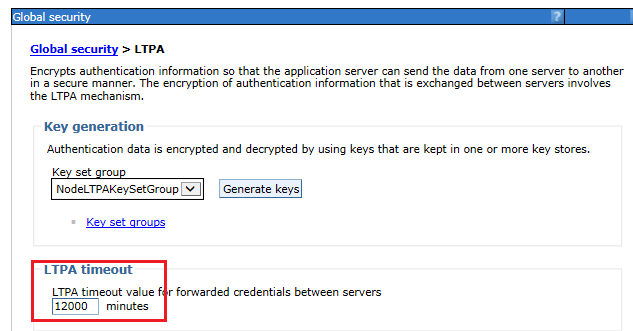
To configure the LTPA token timeout, go to the Websphere administration console (in the Global security section), and select LTPA. Specify a value (in minutes) that is longer than your longest test.

Authentication timeouts in the Jazz applications
To configure the OAuth token timeout in Jazz, go to the Server -> Advanced Properties UI, and update the "OAuth access token timeout": Also adjust the Advanced Property setting of "Jazz Authentication token expiration time" if you're receiving HTTP 500 errors in the Jazz GUI.
Authentication timeouts in Tomcat
To increase the session timeout in Tomcat, edit the ..server\tomcat\webapps\jts\WEB-INF\web.xml file. Specify a value (in minutes) that is longer than your longest test.<session-config> <session-timeout>360</session-timeout>
Authentication timeouts in WebSphere Liberty
To increase the session timeout in WebSphere Liberty, edit the ..server\liberty\servers\clm\server.xml file. Specify a value (in minutes) that is longer than your longest test.<httpSession invalidateOnUnauthorizedSessionRequestException="true" cookieSecure="true" invalidationTimeout="1800"/>Further details on the Liberty Configuration elements in the server.xml file
Conclusion
While the tuning parameters discussed here may improve system behavior in some cases, you will eventually hit a limit if you keeping increasing the load on the server. But if you've followed these guidelines, the limits you see should not be artificially low and the interpretation of your performance results should be a bit simpler.Related topics:
External links:
Contributions are governed by our Terms of Use. Please read the following disclaimer.
Dashboards and work items are no longer publicly available, so some links may be invalid. We now provide similar information through other means. Learn more here.

