Performance test results for Rational DOORS Next Generation 6.0.6 ifix3 with Components 
Authors: SkyeBischoff, VaughnRokoszBuild basis: IBM Rational DOORS Next Generation 6.0.6 ifix3
Page contents
- Introduction
- Performance Summary Comparing 6.0.6 iFix003 to 6.0.6 GA
- Summary of performance improvements in 6.0.6 ifix3
- Deployment Recommendations and Summary
- Appendix A: Topology
- Appendix B: Tested hardware and software configurations
- Appendix C: Test data shape and volume
- Appendix D: Workload characterization
- Appendix E: Application Server Tuning
- How hardware configurations impact scalability
- New system settings for 6.0.6 ifix3
- Java Virtual Memory Heap Tuning
- Java Garbage Collection Tuning
- Java Compressed References
- Java Argument Summary
- Jena Index and Memory caching
- Tuning the Configuration Management Cache
- Tuning cache pre-population
- Jena TDB Default File Access Mode
- Available TCP/IP ports
- Thread pool size
- More suggestions
- Appendix F: Database Server Tuning
- Appendix G: Proxy Server Configuration (for repositories of all sizes)
Introduction
The 6.0.6 iFix003 release of IBM® Rational® DOORS® Next Generation (DNG) includes a large number of performance improvements which increase the scalability of DNG deployments, especially those which have large numbers of components. With 6.0.6 iFix003 , most use cases will benefit from having artifacts organized into components. Performance in 6.0.6 iFix003 is much less sensitive to the total number of components (or the number of components per project area). This report discusses the performance results from our testing of 6.0.6 iFix003, and compares iFix003 performance to 6.0.6 GA. It also provides a high-level summary of the performance improvements and their impact.Overview of the results
Throughput has improved by up to 260% in 6.0.6 iFix003 when compared to 6.0.6 GA. Deployments which use hundreds or thousands of components (or hundreds of project areas) will see the most improvement. There is less improvement for deployments which use a small number of large project areas. But in general, you'll now get the best possible performance by organizing your artifacts into many small components. Under some circumstances, you may be able to exceed the limits on artifact counts discussed in Rational DOORS Next Generation: Organizing requirements for best performance. For example, the tests described in this document ran against a single project area with 2.3 million artifacts split across 500 components. This is substantially larger than the 200,000 artifact per project limit, but there are still some use cases where performance degrades in a large project area (such as full-text search queries against common keywords). Because of that, we recommend that you continue to limit your project areas to 200,000 artifacts and keep the total number of artifacts per server under 2 million. 6.0.6 iFix003 is much less sensitive to the total number of components than in prior releases. We have tested up to 500 components in a single project area, and up to 1000 total components. We also tested a deployment with multiple DNG servers, and found that 3 DNG servers can support 3 times the user load than a single server. The servers have little impact on each other, although we noted that the load on the database server increases. Deployments with multiple DNG servers should monitor database loads, and deploy additional database servers if the load becomes too high. Be aware that there are new options for tuning your DNG server. Please refer to the New System Settings section for more information. Some of the new performance features are not enabled by default, so review this section and update your JVM system properties accordingly.Standard disclaimer
The information in this document is distributed AS IS. The use of this information or the implementation of any of these techniques is a customer responsibility and depends on the customer's ability to evaluate and integrate them into the customer's operational environment. While each item may have been reviewed by IBM for accuracy in a specific situation, there is no guarantee the same or similar results will be obtained elsewhere. Customers attempting to adapt these techniques to their own environments do so at their own risk. Any pointers in this publication to external Web sites are provided for convenience only and do not in any manner serve as an endorsement of these Web sites. Any performance data contained in this document was determined in a controlled environment, and therefore, the results may be obtained in other operating environments may vary significantly. Users of this document should verify the applicable data for their specific environment. Performance is based on measurements and projections using standard IBM benchmarks in a controlled environment. The actual throughput or performance any user will experience will vary depending upon many factors, including considerations such as the number of other applications running in the customer environment, the I/O configuration, the storage configuration, and the workload processed. Therefore, no assurance can be given an individual user will achieve results similar to those stated here. This testing was done as a way to compare and characterize the differences in performance between different configurations of the 6.0.6 GA and 6.0.6 iFix003 products. The results shown here should thus be looked at as a comparison of the contrasting performance between different configurations, and not as an absolute benchmark of performance.Performance Summary Comparing 6.0.6 iFix003 to 6.0.6 GA
This section summarizes the results of our tests on 6.0.6 iFix003 and 6.0.6 GA. But first, here is a brief review of some of the terms we use in the charts below. Throughput is expressed as pages per second. A page is a logical operation, such as opening a module. Each page consists of one or more HTTP requests sent to the server from our simulated clients. Likewise, response times are for pages (not HTTP requests). Think time is the time that the simulation waits before sending a new page request to the server. We use a 30 second think time in these tests. That means, for example, that a simulated client would open the list of modules then wait 30 seconds before opening a module. We use this approach as a way to account for the inevitable pauses that occur when real people use systems. So even though a single user in a real deployment will not always wait 30 seconds between operations, the think time is a representation of the activity across the entire population of users. We use Rational Performance Tester (RPT) for our simulations.Results from single server tests
In 6.0.6 iFix003, a single server supports:- 350 users at a 30 second think time with 500 components (2.3 million artifacts)
- 400 users at a 30 second think time with 300 components (1.3 million artifacts)
Response time improvements
Full-text searching is much faster than in 6.0.6 GA because full-text queries are more efficient at scoping results to components in iFix003.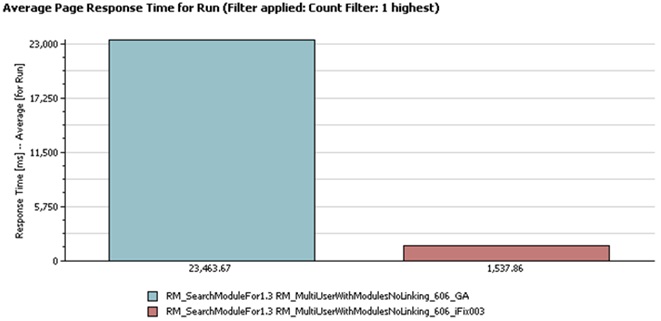 The scoping changes also improve the response time when opening a component or module for the first time.
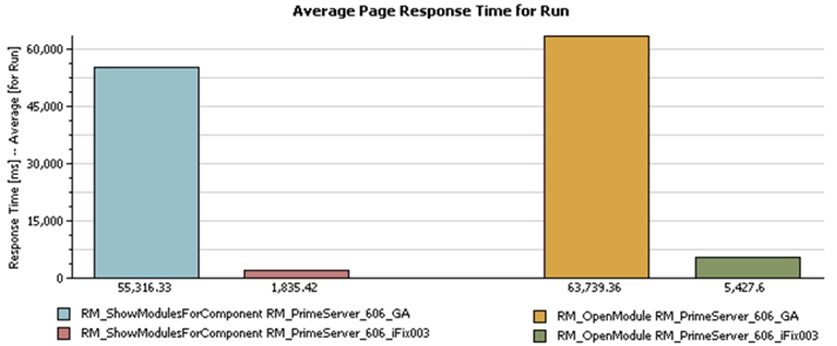 You'll see the most improvement for deployments which have organized artifacts into multiple small components. There will be little or no improvement for large project areas with only one component.
If you are using global configurations, the performance of the Quick Search bar when selecting the scope "All components in this configuration" will depend on the number of components in the global configuration. It will take more time to search across a broader scope.
If you are searching for common keywords in large projects, you may still see poor performance. Refer to the technote Full-text search might be slow and time out for wide searches in large projects for a configuration setting that may address this.
You'll see the most improvement for deployments which have organized artifacts into multiple small components. There will be little or no improvement for large project areas with only one component.
If you are using global configurations, the performance of the Quick Search bar when selecting the scope "All components in this configuration" will depend on the number of components in the global configuration. It will take more time to search across a broader scope.
If you are searching for common keywords in large projects, you may still see poor performance. Refer to the technote Full-text search might be slow and time out for wide searches in large projects for a configuration setting that may address this.
Detailed test results
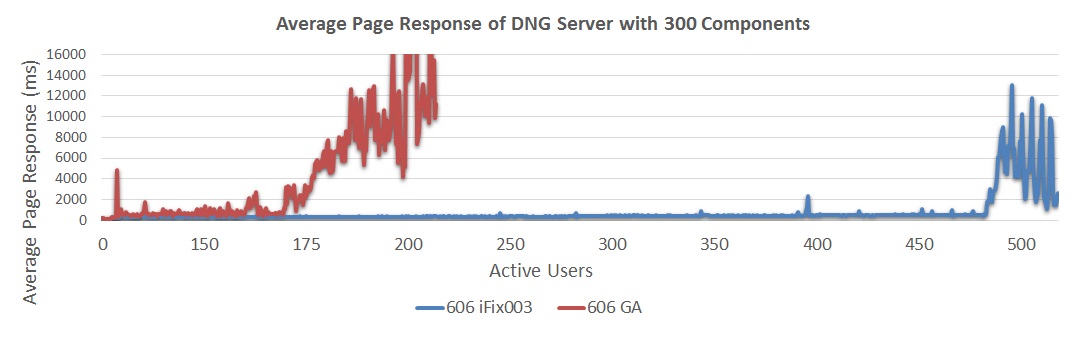
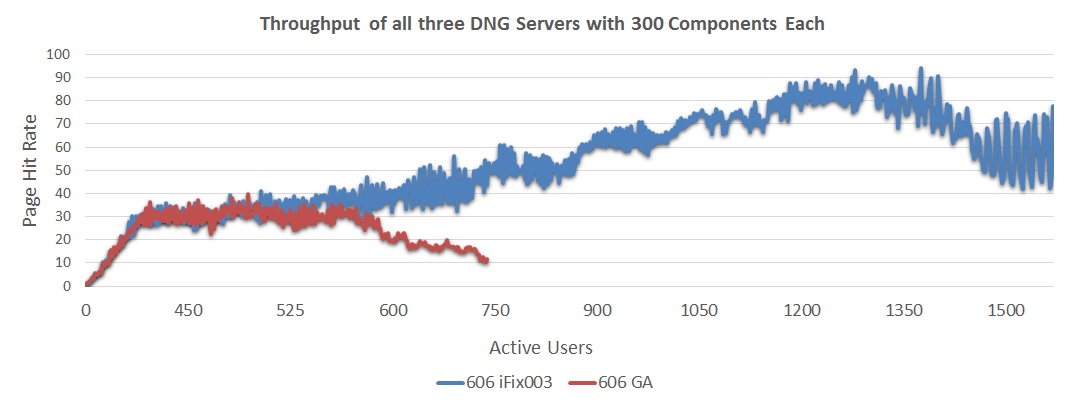
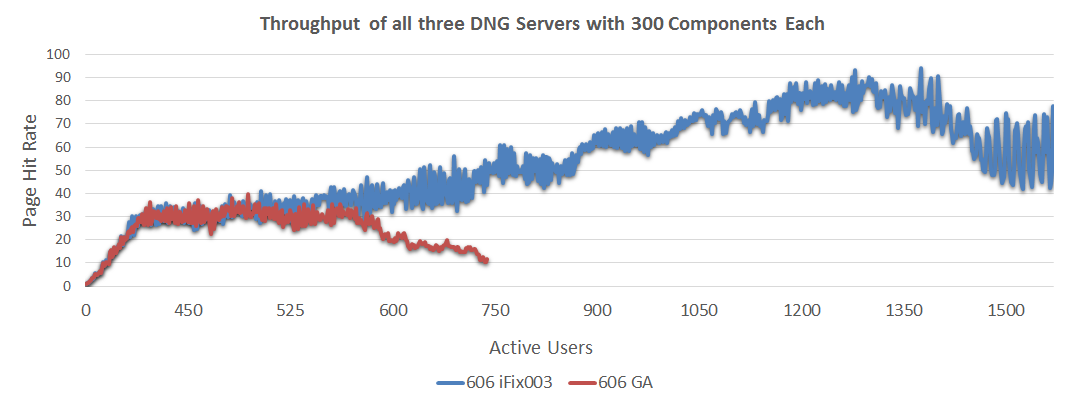
The following chart compares the throughput (as a function of user load) for 6.0.6 GA and 6.0.6 iFix003. 6.0.6 iFix003 improves throughput by 260% over 6.0.6 GA, and can support 450 simulated users before degrading (6.0.6 GA degrades at 150 users).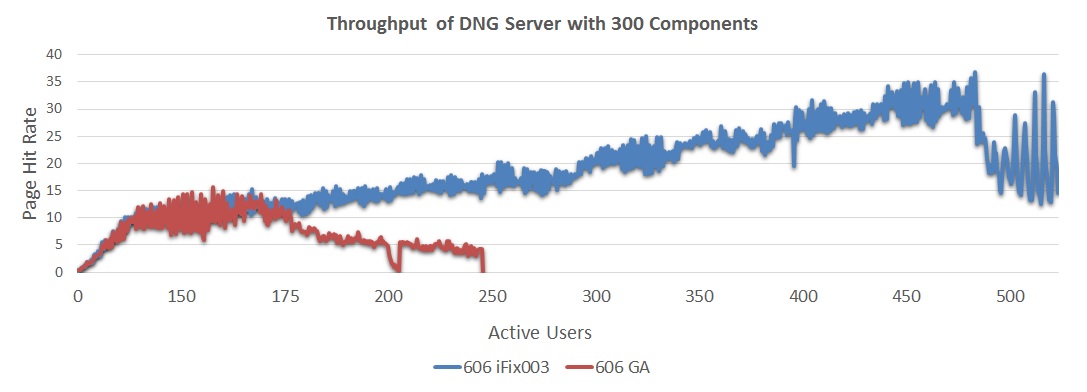 The next chart compares response times (as a function of user load) for 6.0.6 GA and 6.0.6 iFix003. In 6.0.6 iFix003, response times overall are better and are stable up to 450 users.
 - 6.0.6 GA showed response times of approximately 570 ms at 150 users
- 6.0.6 iFix003 showed response times of approximately 330 ms at 150 users
- 6.0.6 iFix003 showed stable response times up to about 450 users (whereas 6.0.6 GA response times degraded sharply between 150 and 175 users).
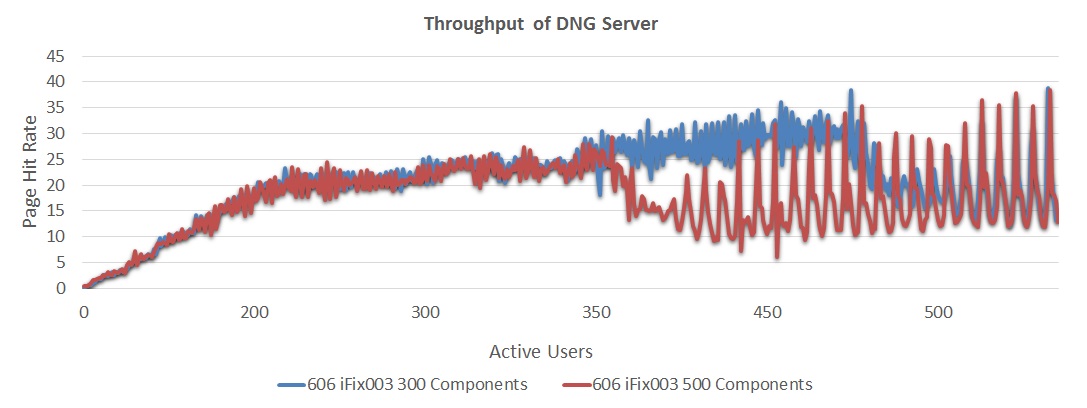
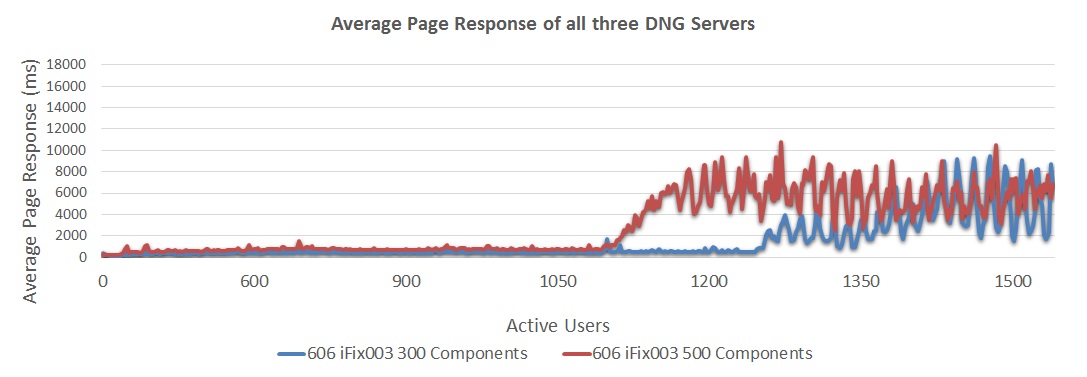
 The next chart compares the throughput achieved for configurations of 300 and 500 components in iFix003. Note that the 500 component configuration involves a single project area with a total of 2.3 million artifacts. The 300 component configuration involves a single project area with a total of 1.3 million artifacts.
 - 6.0.6 iFix003 with 300 components showed a maximum sustainable user load of 400 users
- 6.0.6 iFix003 with 500 components showed a maximum sustainable user load of 350 users
 The next chart compares response times for configurations of 300 and 500 components in iFix003.
 - 6.0.6 iFix003 300 components showed response times approximately 490 ms at 400 users
- 6.0.6 iFix003 500 components showed response times approximately 730 ms at 350 users

Results from 3 server tests
To support more than 2 million artifacts, you need to deploy multiple DNG servers. We therefore looked at the performance of a multi-server DNG system, with a total of 7 million artifacts (2.3 million per server). In these tests, the servers did not interfere with each other, so that a 3 server system can handle 3 times the load (and artifacts) of a 1 server system. However, the workload used in these tests did not include cross-server queries, so the main focus of the test was to determine if other shared parts of the deployment become bottlenecks as the number of DNG servers increases. Summary of results:- In 6.0.6 iFix003, 3 servers support:
- 1050 users at a 30 second think time with 500 components
- 1200 users at a 30 second think time with 300 components
- Resource usage indicates the IHS, GC, and Jazz servers only consume slightly more CPU/Memory as additional DNG servers are added
- Resource usage also indicates the DB2 database consumes moderately more CPU/Memory as additional DNG servers are added
- Database bottlenecking can be mitigated by hosting DNG databases on separate database servers
- 6.0.6 GA showed a maximum sustainable user load of 450 users
- 6.0.6 iFix003 showed a maximum sustainable user load of 1200 users
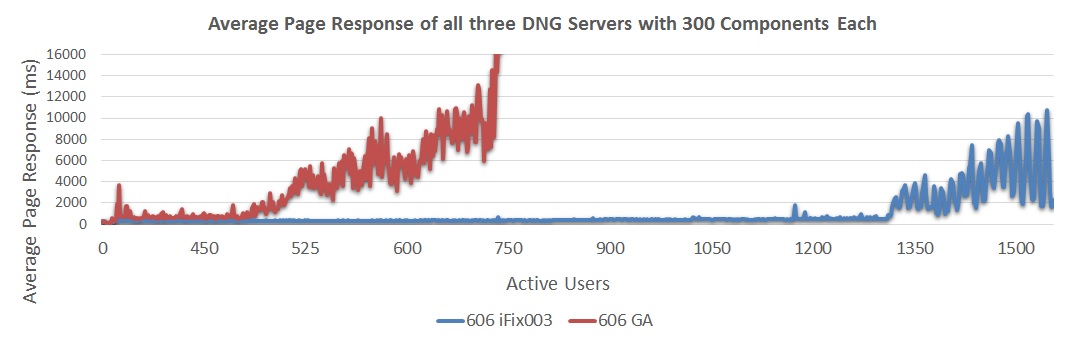
 The next chart compares response times for a 3-server deployment for 6.0.6 GA and 6.0.6 iFix003.
 - 6.0.6 GA showed response times approximately 570 ms at 450 users
- 6.0.6 iFix003 showed response times approximately 330 ms at 450 users
- 6.0.6 iFix003 showed response times increasing up to approximately 490 ms at 1200 users
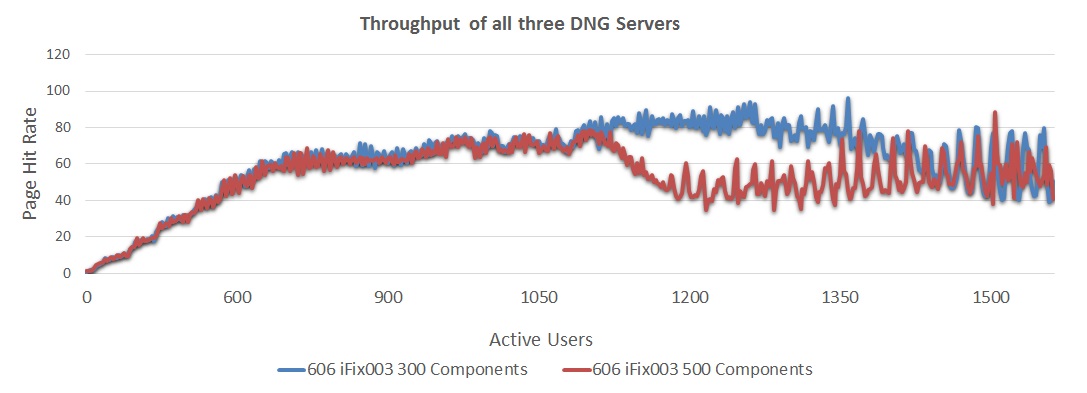
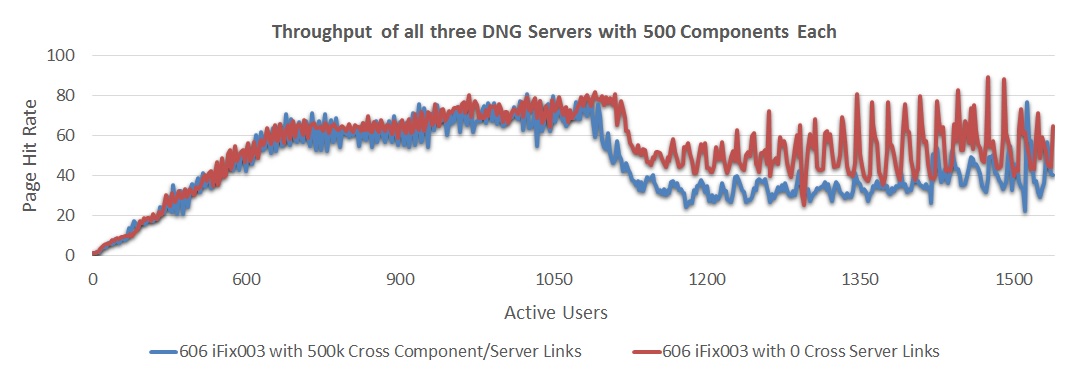
 The next chart looks at the throughput for a 3-server system, comparing a 300 component configuration to a 500 component configuration.
 - As the repository size increased, the throughput of the servers dropped by ~14%.
- 6.0.6 iFix003 with 300 components showed a maximum sustainable user load of 1200 users
- 6.0.6 iFix003 with 500 components showed a maximum sustainable user load of 1050 users
 The next chart looks at the reponse times for a 3-server system, comparing a 300 component configuration to a 500 component configuration.
 - 6.0.6 iFix003 300 components showed response times approximately 490 ms at 1200 users
- 6.0.6 iFix003 500 components showed response times approximately 730 ms at 1050 users
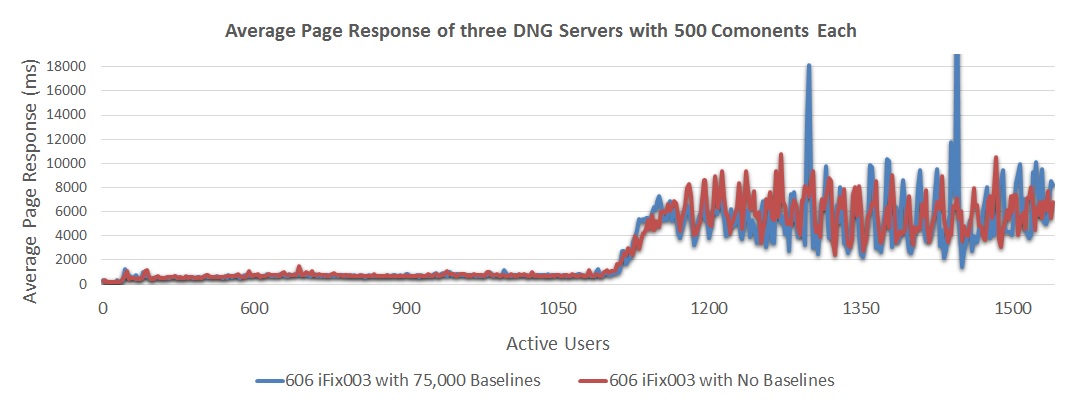
Impact of adding baselines
We also ran a test to measure the impact of adding baselines. We added 75,000 baselines to our standard test configuration, and then ran the performance workload. The impact of adding baselines on the response times was negligible (see chart below).- 6.0.6 iFix003 without baselines showed response times approximately 730 ms at 1050 users
- 6.0.6 iFix003 with 75,000 baselines showed response times approximately 760 ms at 1050 users
Summary of performance improvements in 6.0.6 ifix3
The performance improvements described in the prior section come from the following general categories of changes:- Improved scoping for queries.
- Additional caching.
- Reliable termination of long-running queries.
Improved scoping for queries
6.0.6 iFix003 improves the way that queries process results by limiting search scopes to within a component as much as possible. Prior to iFix003, searches would often look across an entire project area (or even the entire repository) and this could be slow. In iFix003, the code is more efficient at limiting query results to the smallest possible scope. You can exploit these improvements by organizing your artifacts into components. A project area that contains a number of small components will perform better than a project area with one large component. This has improved the following use cases:- Full-text search (for both Quick Search and views that include text-search predicates)
- First time open for a component
- First time open for a module
Additional caching
We are now caching the list of views which you see in the All Artifacts or Modules UI. This improves the following use cases:- Module open
- Linking between artifacts
-Dcom.ibm.team.jfs.rdf.internal.jena.enableExtendedCaching=true
-Dcom.ibm.team.jfs.rdf.internal.jena.QueryFilterNodeCacheSpec=softValues,maximumSize=10000000,recordStats,concurrencyLevel=10
Reliable termination of long-running queries
6.0.6 iFix003 introduces a "Rogue Query" feature which will reliably terminate view queries which run for too long. Long-running queries are a common source of system performance issues, so we now ensure that those queries can be killed before they create problems. You can configure how long to allow queries to run by changing the following properties in rm/admin Advanced Properties.
Miscellaneous improvements
One additional improvement of note is to module views which combine "is not any of" predicates for attributes with "not exists" predicates for link types. Prior to iFix003, these views incorrectly searched across all artifacts in the repository. iFix003 narrows the scope to only those artifacts contained in the module, making the view much faster.Deployment Recommendations and Summary
Based on the data we've gathered for DNG and GC with Components we've learned a number of different things about scalability. Below are some guidelines to consider when deploying a new DNG server or planning the growth of current servers. Please keep in mind these guidelines will not be true for all data. But most servers will benefit from considering these issues when planning data distribution and design.- You'll get the best performance by organizing your artifacts into many small components. In iFix003, the number of total components does not greatly impact overall performance. We've tested configurations with as many as 1000 components.
- Component usage allows a single project to perform well with approximately 1 million artifacts for many use cases, but some scenarios will still run slow (like full text searches). Consequently it is best to separate projects out logically and keep your project's overall artifact count closer to 200,000.
- The total number of artifacts on a single server should not exceed 2 million. If your capacity planning indicates that a server could grow to that size, then you should spread your projects across multiple DNG servers. Plan ahead for this since it is not currently possible to move projects between servers.
- In any project, a single folder or module module with over 10k artifacts can take a long time to load, especially for the first time. Keep the number of artifacts below this limit to avoid timeouts.
- View queries that select many artifacts can be expensive. Be sure to review the "View query best practices" guide.
- Make sure your server hardware aligns with your environments size and usage. Not having enough memory, CPUs, or physical disks can greatly degrade a DNG servers performance.
Full-text search performance
There are a few factors that impact search performance:- The number of artifacts in a project area
- The number of artifacts in a component
- The number of configurations in a global configuration
- The scope selection in the Quick Search bar
- How many artifacts contain the text string being searched for
Considerations when using global configurations
If you are using global configurations, keep in mind that performance can be impacted by the number of DNG configurations contained in a single global configuration. If you select "All components in this configuration" when using the Quick Search feature, your search scope will increase and so will response times. If you have organized your global configurations into a hierarchy, then the search scope covers the configurations in the selected global configuration and its children. If you have a global configuration that includes 50 DNG components split into 5 child GCs of 10 components each, your search performance will be better if you use the child GCs than if you use the parent.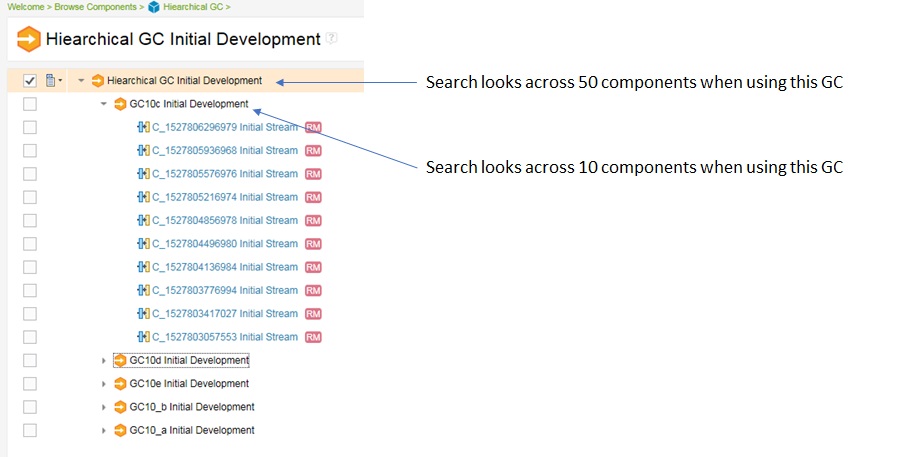
Appendix A: Topology
The topology used in our testing is based on the standard (E1) Enterprise - Distributed / Linux / DB2 topology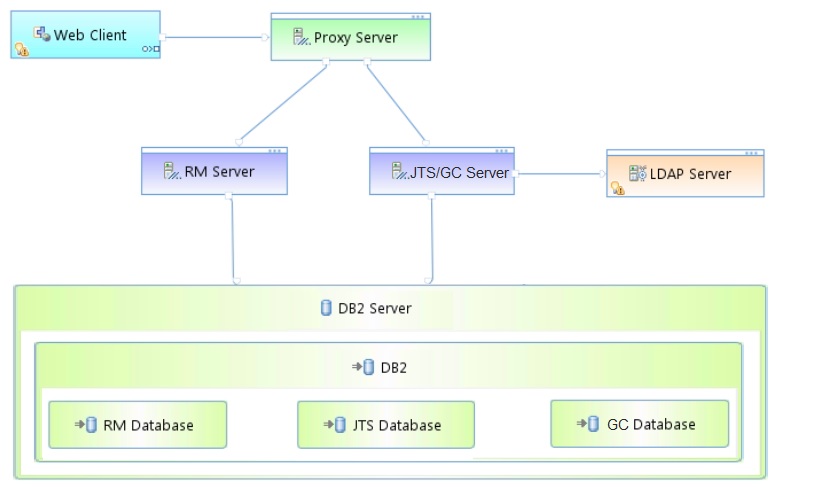 Key:
Key: - RM Server: Rational DOORS Next Generation Server
- JTS: Jazz Team Server
- GC: Global Configuration Server
Appendix B: Tested hardware and software configurations
All of the hardware tested was 64 bit and supported hyperthreading. The following table shows the server hardware configurations used for all the tests and repository sizes.| Roll | Server | Number of machines | Machine type | Processor | Total processors | Memory | Storage | Network interface | OS and version |
|---|---|---|---|---|---|---|---|---|---|
| Proxy Server | IBM HTTP Server and WebSphere Plugin | 1 | IBM System x3550 M4 | 2 x Intel Xeon E5-2640 2.5GHz (six-core) | 24 | 16 GB | RAID 5 279GB SAS Disk x 4 | Gigabit Ethernet | Red Hat Enterprise Linux Server 6.9 (Santiago) |
| RM server | WebSphere Application Server 8.5.5.11 | 1 | IBM System x3550 M4 | 2 x Intel Xeon E5-2640 2.5GHz (six-core) | 24 | 64 GB | RAID 5 279GB SAS Disk x 4 | Gigabit Ethernet | Red Hat Enterprise Linux Server 6.9 (Santiago) |
| Jazz Team Server and Global Configuration Server | WebSphere Application Server 8.5.5.11 | 1 | IBM System x3550 M4 | 2 x Intel Xeon E5-2640 2.5GHz (six-core) | 24 | 32 GB | RAID 5 279GB SAS Disk x 4 | Gigabit Ethernet | Red Hat Enterprise Linux Server 6.9 (Santiago) |
| Database | IBM DB2 enterprise version 11.1.0 | 1 | IBM System x3650 M4 | 2 x Intel Xeon E5-2640 2.5GHz (six-core) | 24 | 64 GB | RAID 10 279GB SAS Disk x 16 | Gigabit Ethernet | Red Hat Enterprise Linux Server 6.9 (Santiago) |
Appendix C: Test data shape and volume
The 6.0.6 tests used repositories containing 2.3 million artifacts. All data is contained inside 500 components which are contained inside a single project. Two types of components were used "module based" and "standard". The artifacts, modules, comments, links, and other objects were evenly distributed among each component. The project contained the total data as shown in the following table.| Artifact Type | Number |
|---|---|
| Projects | 1 |
| Components | 500 |
| Large modules (10,000 artifacts) | 20 |
| Medium modules (1500 artifacts) | 100 |
| Small modules (500 artifacts) | 380 |
| Module artifacts | 2,270,000 |
| Non-module artifacts | 50,000 |
| Total Artifacts | 2.32 million |
| Links | 6.2 million |
| Folders | 29,000 |
| Baselines | 25,000 |
| Resources added per baseline | .02% |
| Resources updated per baseline | .06% |
| GC Components | 20 |
| RM Components inside each GC | 25 |
| Comments | 7,000,000 |
| Links | 9,400,000 |
| Artifact Type | Number |
|---|---|
| Projects | 1 |
| Components | 300 |
| Large modules (10,000 artifacts) | 20 |
| Medium modules (1500 artifacts) | 100 |
| Small modules (500 artifacts) | 180 |
| Module artifacts | 1,250,000 |
| Non-module artifacts | 30,000 |
| Total Artifacts | 1,280,000 |
| Baselines per component | 300 |
| Resources added per baseline | 0% |
| Resources updated per baseline | 0% |
| GC Components | 20 |
| RM Components inside each GC | 15 |
| Comments | 3,840,000 |
| Links | 5,120,000 |
Appendix D: Workload characterization
IBM® Rational® Performance Tester was used to simulate the workload. A Rational Performance Tester script was created for each use case. The scripts are organized by pages; each page represents a user action. Users were distributed into many user groups and each user group repeatedly runs one script (use case). The RM team used the user load stages in Rational Performance Tester to capture the performance metrics. Before each test the DNG, Jazz and database data was restored to our baseline for performance testing. Next the server is started. For 6.0.6 GA each server is primed with 300 users caching components and modules. For 6.0.6 iFix3 each server is primed with a single user to trigger the initial DNG load process. This change was due to the Scoping Improvements and Caching Improvements. Because of improvements in both these areas a full component prime is no longer required for healthy server performance. Next we start our performance test ramping one user on every 10 seconds till we reach our initial user load (typically 300 users) resulting in all users being loaded after 50 minutes; settle for 5 minutes; then gather 30 minutes of performance data with our users running their use case scenarios against our DNG server. After we ramp on 50 more users; settle for 5 minutes; then gather 30 more minutes of performance data. We repeat adding users and gathering data until our maximum user target (typically 500 users). This graduated user load allows us to assess the server's maximum capacity for our different performance assessments. During the entire performance test period we use a 30 second think time between operations for each user (with a small random distribution to avoid user bunching). This table shows the use cases and the number of users who were repeatedly running each script:| Use case | Description | % Of Users | Number of users |
|---|---|---|---|
| Link DNG Artifacts | Create a new artifact link to a different component in the current GC configuration | 5% | 15 users |
| View DNG Artifacts with Links | Open folder with artifacts, linked spanning multiple DNG components in the current GC configuration | 15% | 45 users |
| Create DNG Artifact | Create a new artifact | 10% | 30 users |
| Browse DNG Component Switch Menu | Open the configuration switch menu, perform a * search and browse all DNG components | 5% | 15 users |
| Browse GC Configuration Switch Menu | Open the configuration switch menu and search for a GC configuration | 5% | 15 users |
| Browse GC Configurations and Streams | Open the GC project, open single GC configuration, and browse the GC streams | 5% | 15 users |
| View DNG Components | Open DNG web and view the components for a large project | 5% | 15 users |
| Manage DNG Components and Configurations | Open RM component management window, search for a component and browse to the components streams | 5% | 15 users |
| Scroll DNG Module | Open medium module and scroll through 20 pages of artifacts | 15% | 45 users |
| Search DNG Module View | Open medium module and perform a full text search for specific text | 15% | 45 users |
| Create DNG Module/Artifact Comment | Open medium module, open an artifact and add a new comment | 15% | 45 users |
Initial Server Caching
Caching plays a large part in DNG in regards to performance when using a large number of components, modules and configurations. Each configuration and component has its own subset of data to cache with the server. Immediately after a server restart, the caches are empty and so response times may initially be higher until the caches initialize. Our tests put as much stress as possible on the caches by spreading our user load across all components. Our tests include a "warm-up" phase which does some initial cache population, so that we are simulating a server that is at "steady-state", and not one that has just restarted.A note on failure modes
As we increase the number of users in our simulations, we see response times slowly increase up to a point - but at that point, there is a sudden, sharp increase in response times. At the same time, the CPU utilization on the DNG server increases to 100%. This occurs because a bottleneck can form around the Jena index when there are long read operations, or when there is a high level of concurrency for read operations. The DNG architecture is based on a "many readers, single writer" model. When the writer thread activates, it checks to see whether there are any reads in progress. If there aren't, then information is written into the Jena index. But if a read operation is in progress, the writer thread will store information temporarily in a journal file. The journal will be written into the main Jena index when there are no reads in progress. This approach ensures that a read query will get a consistent view of the data at all times. There is, however, a performance impact to using the journal and this gets worse as the journal grows in size. So if there is a sustained period of load such that reads are always in progress, reads will get slower and slower. And this in turn makes it less likely that there will be a time when the journal can be emptied. In other words, there is a feedback loop between reads and writes which can cause the system to get slower over time. There are two ways in which this can happen:- At low user loads, a single slow query can create the bottleneck if it runs for many minutes.
- At high user loads, read queries may always overlap because of high concurrency (even if the individual queries are fast).
Appendix E: Application Server Tuning
How hardware configurations impact scalability
As a general rule, the system can support more users, artifacts, and components as the amount of RAM on the DNG server increases. The number of supported users can also be increased if the disk I/O speed is increased (e.g. by using SSD drives instead of regular hard disks). The reason for this concerns the index files used by the DNG server to provide fast access to artifact data. The DNG server will cache this index in memory if possible, which is why increasing the amount of RAM can improve performance. The amount of RAM available to cache the DNG index is roughly the total amount of RAM minus the maximum size of the JVM heap. If the disk size of the DNG index (in server/conf/rm/indices) is less than that number, then the DNG index will be cached in memory, which will allow for the fastest read access to DNG data. The DNG index will be accessed from the file system when there isn't enough memory to cache the index completely. When artifacts are created or modified, information is written from memory to disk. So, disk I/O speed is the main factor impacting performance for use cases involving creates or updates. This is why disk I/O matters, and why SSD drives (when combined with enough RAM) provide the best performance and scale. Please refer to Rational DOORS Next Generation: Organizing requirements for best performance for more information on the how system architecture impacts performance.New system settings for 6.0.6 ifix3
There are some additional JVM system settings available with 6.0.6 iFix003.- -Dcom.ibm.team.jfs.rdf.internal.jena.enableExtendedCaching=true. This option reduces the load on Jena by caching information about components. The default is false, but we recommend that you enable this.
- -Dcom.ibm.team.jfs.rdf.internal.jena.QueryFilterNodeCacheSpec=softValues,maximumSize=10000000,recordStats,concurrencyLevel=10. This option controls the size of a cache which is used to reduce the load on Jena. For large systems with millions of artifacts, use a maximumSize of 10 million - the default is 1 million. If you are using configuration management, you can use a maximumSize based on the total number of versions.
- -Dcom.ibm.team.repository.service.internal.vvc.activityStopsPrepopulation=false. The DNG server will pre-populate caches during startup, but by default, the pre-population is stopped when users log into the system. Set this parameter to false to allow the pre-population to run to completion.
Java Virtual Memory Heap Tuning
When allocating your DNG application server's minimum (Xms) and maximum (Xmx) Java Virtual memory heap you want to allocate the appropriate amount for your anticipated server load. For medium deployments this target is often 16Gb, while Large deployments often target a 24Gb heap. For our very large DNG Component based server we used 32Gb. We used a larger heap because our large repository was able to make good use out of the additional memory. During performance runs garbage collection would reduce our heap down to roughly 30 to 40% of max and then progressively our performance run would consume most of the heap before collection again. Memory contention was always the highest during the initial caching period of our server, when all of the components, configurations, and modules were being progressively cached. For configuring your nursery (Xmn) you want to allocate between 20 to 30% of the total heap (Xmx) to the nursery. The nursery is a section of JVM memory used to efficiently manage short-lived objects, such as those associated with handling an incoming HTTP request. As the number of concurrent DNG users grows, there is more demand on the nursery to process the incoming transactions. If the nursery is too small, memory for those objects will be copied into sections of JVM memory which have more management overhead. By allocating more memory to the nursery, you can improve performance at higher load levels by ensuring short-lived objects stay in the nursery. Optimal nursery size can vary by max user load and amount of different content accessed over time. For our testing increasing the nursery size beyond ~5Gb did not show any performance gains (which was 18% of our total heap size). To set memory add the generic JVM arguments:-Xmx32g -Xms32g -Xmn4915m
Java Garbage Collection Tuning
DNG testing with components showed the ideal garbage collection policy to be gencon. CLM testing across the Jazz products has show gencon to perform efficient garbage collection in most situations. For DNG with Components gencon is still the proper GC choice. To enable gencon add the generic JVM arguments:-Xgcpolicy:gencon -Xgc:preferredHeapBase=0x100000000
Java Compressed References
The option -Xcompressedrefs enables compression for memory references, which reduces the amount of memory used. Compressed references are enabled by default in the latest Java versions, so we recommend using compressed references whenever they can be supported. The primary disadvantage of compressed references is that they limit the maximum size of your JVM heap:- In Java 8, you can use compressed references when your maximum heap size is 57G or less
- In Java 7, you can used compressed references when your maximum heap size is 25G or less
-Xcompressedrefs
Java Argument Summary
Including all of the above memory tuning our JVM and GC policy were setup as follows:Initial Heap Size: 27648 Maximum Heap Size: 27648
Generic JVM Arguments: -Xmx27g -Xms27g -Xmn4915m -Xgcpolicy:gencon -Xcompressedrefs -Xgc:preferredHeapBase=0x100000000 -XX:MaxDirectMemorySize=1G
Jena Index and Memory caching
Ensure that your DNG servers have enough memory to allow them to cache most of the Jena index in memory. Note that the Jena files are not cached in the JVM heap, so you need to have enough RAM in addition to whatever you are using for your JVM. As a rule of thumb, look at the maximum heap size of your JVM and also at the total size of the jfs-rdfindex directory. The amount of RAM should be greater than the max heap size + the jfs-rdfindex size plus 2G for the operating system. That rule of thumb will ensure that you are always able to keep the entire Jena index in memory. You can use 50% of the size of the jfs-rdfindex directory instead if your user community commonly works with a subset of artifacts. In that case, you won't need to have all of the Jena data in memory. You can monitor operating system paging rates as a way to check whether you are running into problems because of lack of RAM. By the way, this can be a disadvantage of increasing your JVM heap. The memory used by Java is not available for caching Jena data, and so it is possible to make performance worse by increasing the JVM heap. There are more technical details on this topic in this article.Tuning the Configuration Management Cache
Some information about streams and baselines is cached in memory. The cache size can be changed to improve the performance for higher user loads (with the tradeoff being additional memory usage). You control the cache settings through JVM startup parameters (e.g. through the -D flag or by using custom JVM properties). The cache stores information which DNG associates with each configuration (where a configuration is a stream, baseline, or change set). For best performance, set the cache size to the number configurations. This supports the worst-case scenario where users are working across many different configurations. The default value for this cache is 1000. Assume each active entry in the cache will consume 2M of RAM. We also recommended increase the cache expiration times above the default of 60 minutes. Using an expiration of several days reduces overhead from reloading ejected entries. To set as a JVM startup parameter:-Dcom.ibm.rdm.configcache.expiration=5040 -Dcom.ibm.rdm.configcache.size=2000For additional tuning guidance for the configuration cache, refer to this technote Tuning the configuration cache for IBM Rational DOORS Next Generation
Tuning cache pre-population
During startup, information about versions is loaded into several internal caches. This pre-population makes initial access of components, modules, and other assets notably faster (after pre_populate has finished). For best performance, you can set the noOfConfigsToPreload to match the number configurations in your deployment. This would support the worst case scenario where all configurations are loaded on your server during the day. If you set noOfConfigsToPreload higher than the default 100, you will consume more application server heap memory when your server is first booted. By default, the pre-population activity stops as soon as users log onto the system and start using DNG. This can make it hard to predict performance results, since you can't always be sure that the caches were completely populated. To allow pre-population to complete without interruption, set com.ibm.team.repository.service.internal.vvc.activityStopsPrepopulation to false. To set as a JVM startup parameter:-Dcom.ibm.team.repository.service.internal.vvc.noOfConfigsToPreload=100 -Dcom.ibm.team.repository.service.internal.vvc.noOfConfigsToCache=2000 -Dcom.ibm.team.repository.service.internal.vvc.ConfigurationIdCache.noOfConfigsToCache=2000 -Dcom.ibm.team.repository.service.internal.vvc.activityStopsPrepopulation=false
Jena TDB Default File Access Mode
Jena has two primary file access modes we use "direct" and "mapped". Full Details on direct vs mapped I/O can be read here: https://jazz.net/wiki/bin/view/Deployment/ConfiguringAndTuningDNG. Our DNG testing with or without components traditionally uses "mapped" because mapped mode supports nearly twice the throughput of direct mode, with less usage of the JVM heap. On Windows, "direct" mode is the default. We have had issues with using mapped mode on Windows virtual machines, where the sync() system call (used to flush dirty pages from memory to disk) becomes slow. We did not successfully isolate the issue, however. If you are running DNG on Windows, you may consider experimenting with mapped mode. Mapped mode works functionally on Windows, but you should monitor performance. The sync() issue would manifest as indexing backlogs or response time spikes. To set the Jena File Access Mode access rm/admin and go to advanced properties:Jena TDB Default File Access Mode - mapped Jena TDB File Access Mode - mapped
Available TCP/IP ports
The default number of TCP/IP ports available on AIX and Linux operating systems is too low and must be increased. Windows operating systems have a higher default limit, but the limit might still be too low for large concurrent user loads. Use the following instructions to increase the port range.- On AIX and Linux systems, set the limit as follows: ulimit -n 65000
- On Windows 2008 Server, follow the instructions in this Microsoft support article to change the dynamic port range. For the start port setting, use 2000. Set the number of ports to 63535.
Thread pool size
The WebSphere Application Server thread pool size must be increased from the default of 50 to 75 percent of the expected user load. For example, if you have 400 concurrent users, the thread pool maximum should be set to 300. If you are using WebSphere Liberty, you don't need to configure this - the thread pool expands automatically.More suggestions
In a 3-server topology, where Jazz Team Server and the DNG server are on separate hardware, adjust two settings in the teamserver.properties file for loads higher than 200 concurrent users.- Ensure com.ibm.rdm.fronting.server.connection.route.max equals the number of users
- Ensure com.ibm.rdm.fronting.server.connection.max is twice the value of number of users
Appendix F: Database Server Tuning
Keeping Database Statistics Up-To-Date
Information about streams, baselines, and changesets is stored in tables in the database. The DNG server will query these tables when users work in a DNG project which is enabled for configuration management. For best performance, be sure the database statistics are kept up to date as the size of the repository grows. This is especially critical when you are first adopting configuration management. Some of the tables will start out empty, and then grow as users work with streams, baselines, and change sets. Keeping the database statistics updated ensures the queries against those tables will be properly optimized. Databases generally manage statistics automatically; for example, in a scheduled overnight operation. However, to ensure the database is fully optimized, you can manually run the statistics as follows. DB2DB2 REORGCHK UPDATE STATISTICS ON TABLE ALLOracle
EXEC DBMS_STATS.GATHER_DATABASE_STATSSee also Slow server performance and CRRRW7556E on IBM Rational DOORS Next Generation version 6.0.x for further information on keeping databases tuned for configuration management, if you are experiencing performance issues.
Database Server Hardware
For a database server, the team used an IBM System x3650 M4 with 2 x Intel Xeon E5-2640 2.5 GHz (six-core) and 64G of total RAM. The total number of processor cores/machines was 24. In the tests, one server was used for both the Jazz Team Server and RM databases. The database server was used for the testing was IBM DB2 enterprise version 11.1.0. The same hardware and database settings were used for all of the performance tests, irrespective of the repository size. In our tests, performance bottlenecks always formed first on the DNG server, due to the interactions around the disk-based indices. The database server was not the limiting factor. However, the 6.0.x release does use the database server more heavily for storing version information, so we expect a higher end database server with fast disks) will improve performance as the number of versions and configurations increases.Hard Disk Capacity and Configuration
The database servers should use the RAID 10 configuration with the RAID controller configured with "write back cache." The team observed performance degradation in some use cases when using "write-through" caching. Use a high capacity and high performing hard disk (10K RPM or better).| Repository | Combined disk usage of Jazz Team Server and RM databases | Hard Disk Size |
|---|---|---|
| Up to 500,000 artifacts | ~100 GB | 300 GB |
| Up to 1 million artifacts | ~150 GB | 400 GB |
| Up to 2 million artifacts | ~300 GB | 700 GB |
Appendix G: Proxy Server Configuration (for repositories of all sizes)
The team used the same server hardware to test repositories of all sizes. In general, the proxy server does not slow the performance of the RM server.IHS Tuning
For the IHS systems used during the tests, in the server pool regulation section (worker.c) of httpd.conf file, these parameters were configured:| Parameter | Value |
|---|---|
| ThreadLimit | 25 |
| ServerLimit | 100 |
| StartServers | 2 |
| MaxClients | 2500 |
| SpareThreads | 25 |
| MaxSpareThreads | 500 |
| ThreadsPerChild | 25 |
| MaxRequestsPerChild | 0 |
ThreadLimit
ThreadsLimit should equal ThreadsPerChild. ServerLimit
ServerLimit should be equal to MaxClients divided by ThreadsPerChild rounded to nearest integer. Ideally, change MaxClients so that it equals ServerLimit multiplied by ThreadsPerChild without any fractions. If ServerLimit multiplied by 25 is greater than the amount of available RAM, lower MaxClients and readjust ServerLimit. StartServers
If ThreadsPerChild has increased by a large amount, evaluate the current value of StartServers (the initial number of child processes created). Note that StartServers is not a very important tunable, because IBM HTTP Server re-evaluates the number of available threads every second. MaxClients
On Windows there is no MaxClients directive, ThreadsPerChild is used instead MinSpareThreads
MinSpareThreads should not exceed the value of 25 or 10% of MaxClients. Its usually safely set to the same value (or double) ThreadsPerChild. Since this value is checked every second, it is not an especially sensitive setting. MaxSpareThreads
MaxSpareThreads can be increased in step with MaxClients. ThreadsPerChild
ThreadsPerChild default is 25 A higher ThreadsPerChild can benefit the WebSphere plugin, but the trade-off compensates CPU for SSL. MaxRequestsPerChild
MaxRequestsPerChild can remain at the default of 0. Tuning IBM HTTP Server to maximize the number of client connections to WebSphere Application Server Configuring and tuning IBM HTTP Server (IHS)
Related topics: Deployment web home, Deployment web home
External links:
Additional contributors: WilliamChatham, TWikiUser


Contributions are governed by our Terms of Use. Please read the following disclaimer.
Dashboards and work items are no longer publicly available, so some links may be invalid. We now provide similar information through other means. Learn more here.