Introduction
This report describes the performance testing done for the IBM DOORS Next (DN) 7.0.3 GA release. Testing results focus on our DOORS Next large scale environments, with integrated Global Configuration. We utilize configuration management (opt-in), global configurations, DN components, GC components, linking, view queries, and many other scenarios. This testing does not include other integrated applications like IBM Engineering Test Management, Engineering Workflow Management, Jazz Reporting Service, or Lifecycle Query Engine.
The DOORS Next performance testing goals this release were:
- Ensure no significant DN performance regressions exist in 7.0.3 vs 7.0.2 iFix008
- "DN Event based TRS" performance including validation and indexing did not regress
- "DN Log based TRS" performance including validation and indexing performed comparable or better than Event based TRS
- DN performance improvements were made for scenarios including "DN Baseline Access"
We were able to achieve our or testing goals the DN 7.0.3 release. The
Regression Test Results show comparisons between DN 7.0.3 and 7.0.2 iFix008 on Oracle. You can see DN 7.0.3 page operations and transactions both ran faster with lower response times during our DN 500 concurrent user performance testing on Oracle. This was the result of many different scenario improvements to reduce resource usage and improve scenario response times.
DN Event based and Log based TRS testing also went well. Performance testing indicated there have not been any regressions to rebasing, indexing, or validation response times. We also observed small improvements in rebasing and indexing response times for the new Log based TRS feature. And DN validation worked correctly and was able to complete sucessfully using Log based TRS; incremental validation was not possible for Event based TRS in our large complex enviornment, and always failed due to pre-existing known issues in DN 7.0.2 and earlier versions. Last during our TRS testing we observed significant improvements in rebasing and indexing times when using NVME drives. Indicating it is very important the underlying storage solution for databases and LQE adequately matches the size of resources being processing.
The rest of this article is divided into these sections:
Standard disclaimer
The information in this document is distributed AS IS. The use of this information or the implementation of any of these techniques is a customer responsibility and depends on the customers ability to evaluate and integrate them into the customers operational environment. While each item may have been reviewed by IBM for accuracy in a specific situation, there is no guarantee that the same or similar results will be obtained elsewhere. Customers attempting to adapt these techniques to their own environments do so at their own risk. Any pointers in this publication to external Web sites are provided for convenience only and do not in any manner serve as an endorsement of these Web sites. Any performance data contained in this document was determined in a controlled environment, and therefore, the results that may be obtained in other operating environments may vary significantly. Users of this document should verify the applicable data for their specific environment.
Performance is based on measurements and projections using standard IBM benchmarks in a controlled environment. The actual throughput or performance that any user will experience will vary depending upon many factors, including considerations such as the amount of multi-programming in the users job stream, the I/O configuration, the storage configuration, and the workload processed. Therefore, no assurance can be given that an individual user will achieve results similar to those stated here.
This testing was done as a way to compare and characterize the differences in performance between different versions of the product. The results shown here should thus be looked at as a comparison of the contrasting performance between different versions, and not as an absolute benchmark of performance.
Regression Data Shape and Workload for DN 7.0.3
For our DN Regression performance testing we used the same DOORS Next testing environment and testing methodologies outlined in the
7.0.2 iFix008 Performance Update. This gave us a good design for comparisons and monitoring potential regressions.
View Query Automation
We have complex View Query automation for 6 different views. The new views include LinkTo and LinkFrom columns and also display all of the new attributes. These views are listed below:
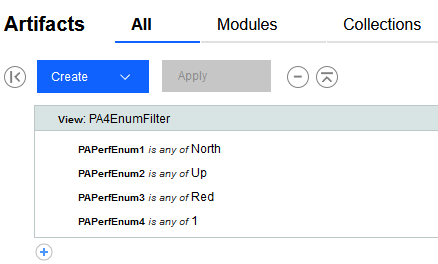
- ViewPA4EnumFilterAllArtifacts - A view showing attribute columns filtered on 4 enums in the all artifacts view:
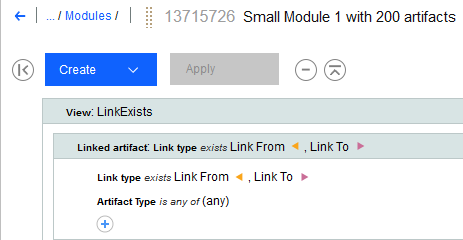
- ViewLinkExists - A view showing artifacts that contain LinkTo or LinkFrom links
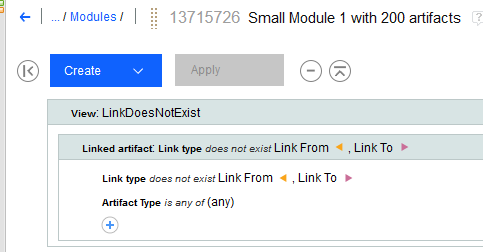
- ViewLinkDoesNotExist - A view showing artifacts that do not have links:
- ViewExtendedLinks - A view showing attribute columns and the extended links data:
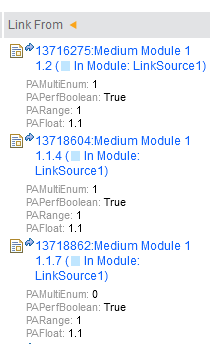
- ViewPABoolEnumCombo - A view showing artifacts filtered on a combination of Bool and Enum values:
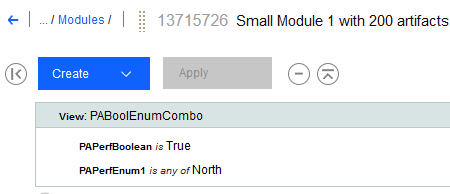
- ViewPAMultiEnumFilter - A view showing artifacts filtered on multiple enums:
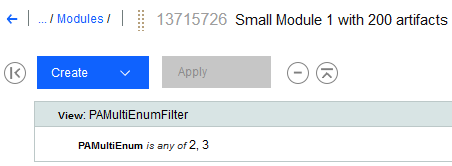
Regression Workload
The updated workload is described in the following table. This indicates the percentage of user load for each scenario, as well showing which scenarios run against the stress component and which run against components with less history.
List of scripts and their proportion of the designated workload
| Script |
Percentage Usage |
Target Component |
| ScrollModule |
1.5% |
General |
| HoverArtifactEditMod |
9% |
General |
| Upload4MbFileNewArtifact |
2% |
General |
| CreateModArtifactComment |
2% |
General |
| CopyPaste25 |
4% |
General |
| CreateStream |
1 User |
General |
| CreateBaseline |
1% |
General |
| MultiSizeDeliver_Small |
8% |
General |
| MultiSizeDeliver_Large |
2% |
General |
| MultiSizeDiscard_Small |
4.5% |
General |
| MultiSizeDiscard_Large |
2% |
General |
| ViewModuleHistory |
2% |
General |
| CreateWordFromModule |
1% |
General |
| HoverModuleLink |
4% |
General |
| CreateLinkAndDeliver |
9% |
General |
| ViewLinkExists |
1.5% |
General |
| ViewLinkDoesNotExist |
1.5% |
General |
| ViewPA4EnumFilterAllArtifacts |
2% |
General |
| ExtendedLinks |
2% |
General |
| ViewPABoolEnumCombo |
2% |
General |
| ViewPAMulitEnumFilter |
2% |
General |
| ScrollModule |
1.5% |
Stress |
| Upload4MbFileNewArtifact |
2% |
Stress |
| CreateModArtifactComment |
2% |
Stress |
| CreateBaseline |
1% |
Stress |
| MultiSizeDeliver_Small |
8% |
Stress |
| MultiSizeDeliver_Large |
2% |
Stress |
| MultiSizeDiscard_Small |
4.5% |
Stress |
| MultiSizeDiscard_Large |
2% |
Stress |
| ViewModuleHistory |
2% |
Stress |
| CreateWordFromModule |
1% |
Stress |
| ViewLinkExists |
1.5% |
Stress |
| ViewLinkDoesNotExist |
1.5% |
Stress |
| ViewPA4EnumFilterAllArtifacts |
2% |
Stress |
| ExtendedLinks |
2% |
Stress |
| ViewPABoolEnumCombo |
2% |
Stress |
| ViewPAMulitEnumFilter |
2% |
Stress |
Data shapes
The data shape for 7.0.3 is made up of a large number of standard-sized components, spread across 3 standard project area sizes. When we want to increase the size of repository, we just add more of the standard projects. In addition, the test environment is enabled for configuration management, and all operations are executed within the context of a global configuration. We have 3 standard sizes for global configurations (small, medium and large).
Please note this data shape for 7.0.3 is identical to our 7.0.2 iFix008 data shape, with two exceptions: First we made some attribute modifications to help certain view queries run more consistently. Second we added support for baseline testing, which we do not outline in this article. Neither of these changes impacted our regression testing comparisons between 7.0.3 and 7.0.2 iFix008.
Artifact counts
We have 3 different standard module sizes:
- Small (200 artifacts)
- Medium (1500 artifacts)
- Large (10,000 artifacts)
We use these standard module sizes to create 3 different standard components.
| Artifact type |
Small component |
Medium component |
Large component |
| Number of large modules |
0 |
0 |
1 |
| Number of medium modules |
0 |
3 |
0 |
| Number of small modules |
20 |
0 |
0 |
| Total module artifacts |
4200 |
4500 |
10000 |
| Non-module artifacts |
100 |
100 |
100 |
We use these standard components to create 3 standard size projects (small, medium, and large). Artifacts are imported via components to create our standarized shape. In the first five million artifacts, each artifact inside a module has 10 links to a matching "Linksource module artifact". This results in 44,525,000 links. The remaining six to twenty million artifacts are linked differently, with random cross component links created between artifacts with approximately two links per artifact. The number of artifacts and links for these standard projects is summarized below.
| Artifact type |
Small project |
Medium project |
Large project |
| Large components |
1 |
5 |
20 |
| Medium components |
6 |
30 |
120 |
| Small components |
36 |
180 |
720 |
| Total components |
43 |
215 |
860 |
| Module artifacts |
181,000 |
905,000 |
3,620,000 |
| Non-module artifacts |
4,300 |
21,500 |
86,000 |
| Total artifacts |
185,300 |
926,500 |
3,706,000 |
| Large modules (10,000 artifacts) |
1 |
5 |
20 |
| Medium modules (1,500 artifacts) |
18 |
90 |
360 |
| Small modules (200 artifacts) |
720 |
3,600 |
14,400 |
| RM Links (artifacts x10) |
1,853,000 |
9,265,000 |
37,060,000 |
Finally, we combine these standard projects to create repositories of varying sizes. Here is the summary of our test repositories up to 20,000,000 total artifacts.
| Server Data |
5m |
10m |
15m |
20m |
| Large Projects |
0 |
1 |
1 |
1 |
| Medium Projects 1 |
2 |
2 |
6 |
10 |
| Small Projects |
15 |
19 |
23 |
27 |
| Total Projects |
17 |
22 |
30 |
38 |
| Module Artifacts |
4,525,000 |
8,869,000 |
13,213,000 |
17,557,000 |
| Non-Module Artifacts |
107,500 |
210,700 |
313,900 |
417,100 |
| RM Links |
74,346 |
178,076 |
187,851 |
279,104 |
| Large modules (10,000 artifacts) |
25 |
49 |
73 |
97 |
| Medium modules (1,500 artifacts) |
450 |
882 |
1,314 |
1,746 |
| Small modules (200 artifacts) |
18,000 |
35,280 |
52,560 |
69,840 |
| Large Components |
25 |
49 |
73 |
97 |
| Medium Components |
150 |
294 |
438 |
582 |
| Small Components |
900 |
1,764 |
2,628 |
3,492 |
| Total Components |
1,075 |
2,107 |
3,139 |
4,171 |
| GC Components |
256 |
511 |
767 |
1,023 |
| Total GC Baselines |
12,788 |
25,575 |
38,363 |
51,150 |
| Total DNG Local Baselines |
125,000 |
250,000 |
375,000 |
500,000 |
| Total Links |
45,250,000 |
53,575,000 |
58,100,000 |
62,625,000 |
| Total Artifacts |
4,835,488 |
9,447,009 |
14,947,224 |
18,756,265 |
| Added/Updated Artifacts in all Baselines |
486,413 |
953,369 |
1,420,325 |
1,984,563 |
| Total Versioned Artifacts |
5,118,913 |
10,033,069 |
14,947,225 |
20,885,163 |
Global configurations
We created global configurations (GCs) and added the DNG components as contributions. We used 4 standard sizes:
- A tiny GC with 10 contributions
- A small GC with 250 contributions, consisting of 25 tiny GCs
- A medium GC with 1250 contributions, consistent of 6 small GCs
- A large GC with 2500 contributions, consistent of 2 medium GCs
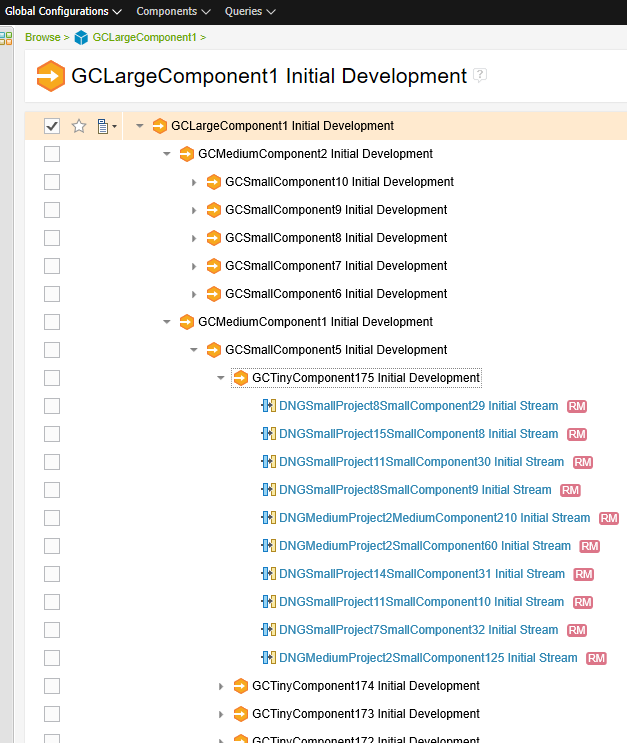
In other words, the global configurations are organized into a hierarchy. The figure below illustrates this for the small GC:
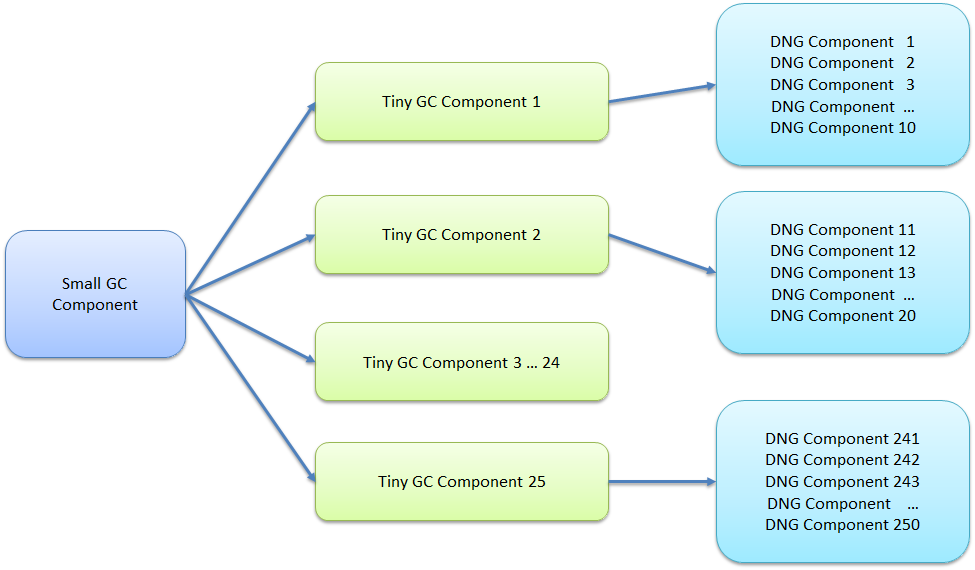
The large GC looks like this:
Regression Test Results for DN 7.0.3 testing on Oracle
Overall performance looks good and results are similar to our last published results for
7.0.2 iFix008. DN 7.0.3 released with no major performance regressions we were tracking. Our physical hardware server was able to support 500 users with reasonable response times. Our testing is based off using DOORS Next with GC and opt-in projects with configuration management. And our scenarios include complex data and a variety of queries noted in
"Performance Workload". Note our testing does have some coverage gaps, does not include opt-out projects, and lacks cross product integration/linking.
General test configuration for DN 7.0.3 testing on Oracle
About this test:
- Performed on a Linux/Oracle environment
- Performance workload as detailed above
- Number of contributions in global configuration: 2500
- Number of users: 500
- Oracle CPU utilization ~20% and Disk Busy ~60% (Oracle server memory increased to 192G)
- RM Server utilization 70%-80%
- Repository size: 20 million artifacts
- One stress component with high version counts
Performance test approach for DN 7.0.3 testing on Oracle
For every test the test environment is restarted. Then, we ensure that the system is fully initialized by:
- manually logging into all the application components
- running the administration diagnostics,
- opening the GC and DN UI's and perform basic actions such as opening a component from the GC project and opening a module
Once this is completed we start a performance schedule and allow it to complete the 500 user warm up and the 10 minute settle period. The test is then stopped. Warmup is repeated three times in order to properly simulate caching for a large distributed server.
At this point the recorded test is executed and all appropriate metrics gathered.
Comparison between DN 7.0.3 vs DN 7.0.2 iFix008 on Oracle
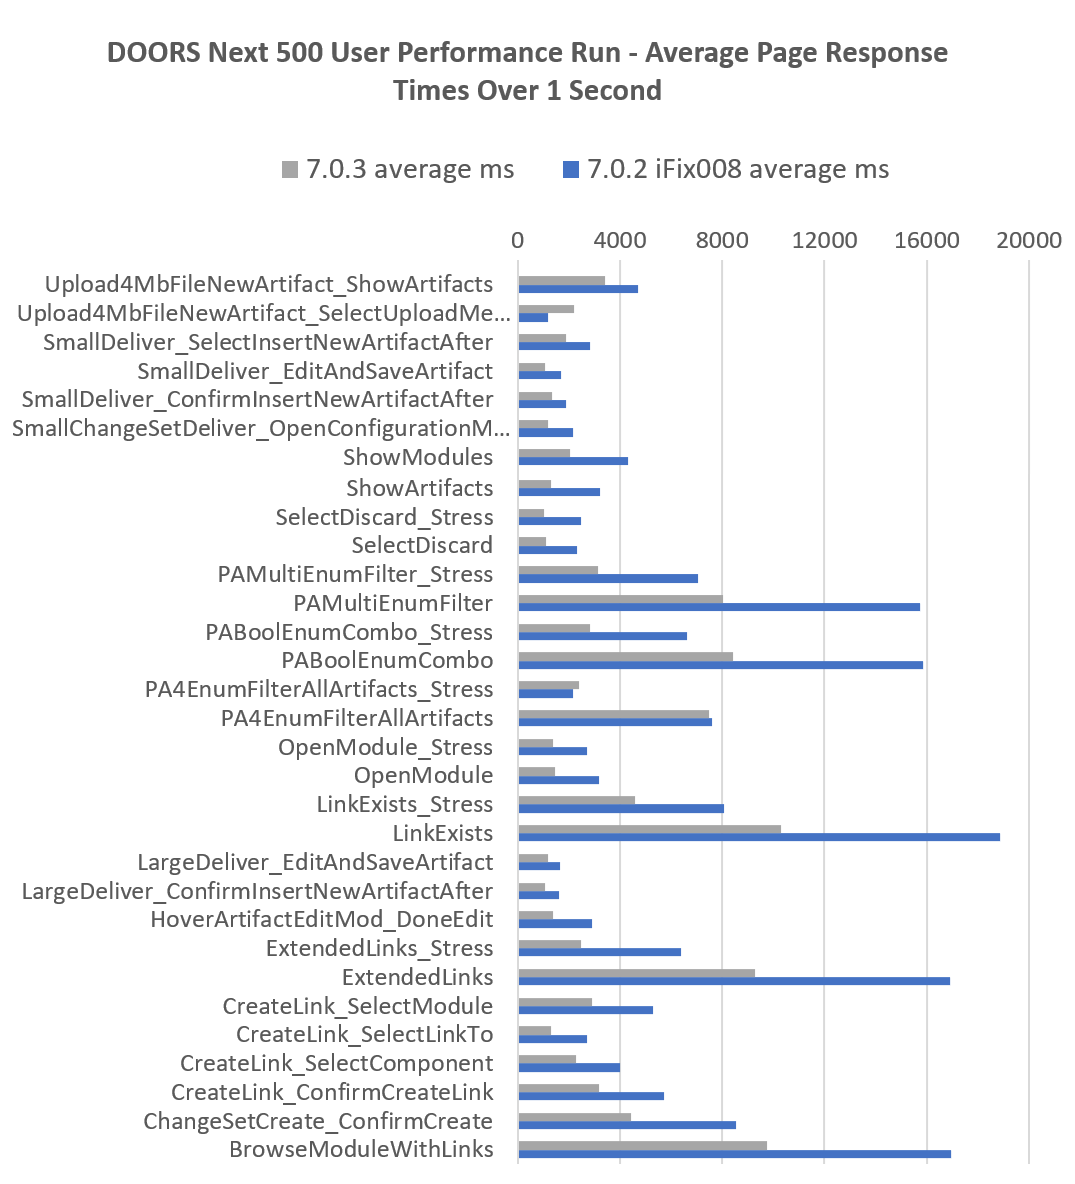
The following chart shows regression comparisons for DN 500 concurrent user performance benchmarks on Oracle of all "Page Operations" which took over one second. Response times were lower in 7.0.3 due to many scenarios having 7.0.3 development improvements, resulting in lower resource consumption and improved server health.
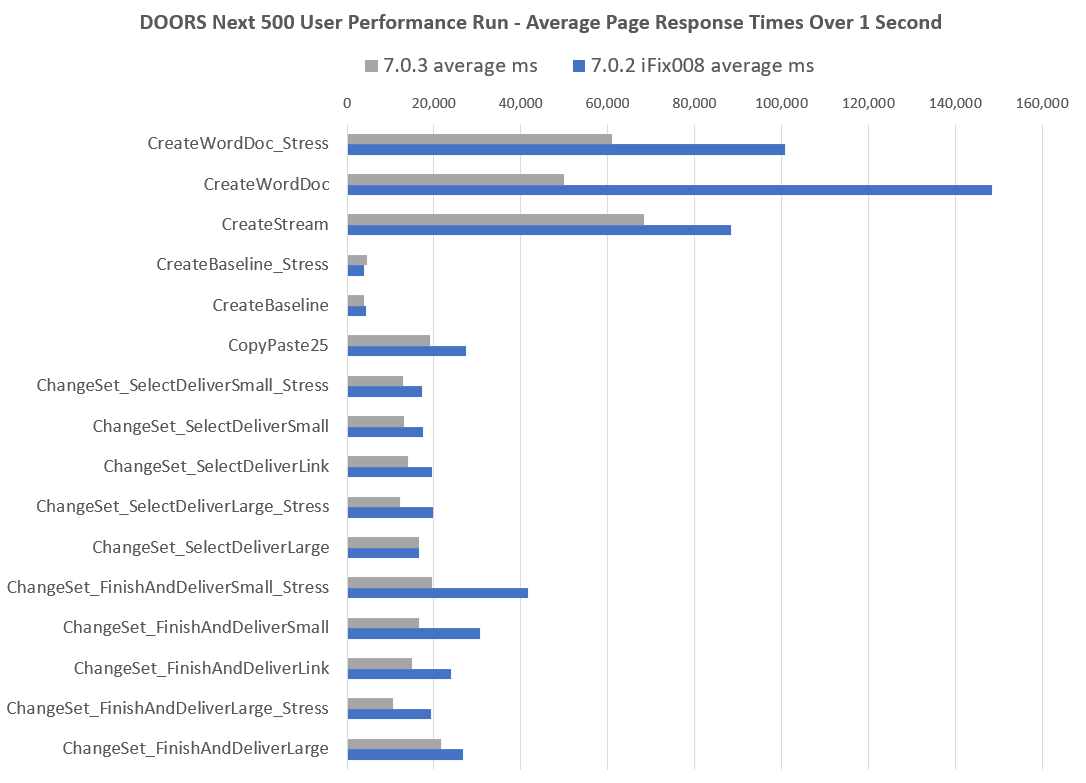
The next chart shows regression comparisons for DN 500 concurrent user performance benchmarks on Oracle of all "Long Running Transactions". Again transaction times were lower in 7.0.3 due to many scenarios having 7.0.3 development improvements, resulting in lower resource consumption and improved server health.

Top operations for DN 7.0.3 testing on Oracle
The following table shows all operations over one second ordered by their average response times. Most of the slow operations involve opening views that display link columns.
All transactions over one second by average response time
| Operation |
Description |
Time [ms] |
| LinkExists |
Open a view that with a "Link does exist" filter |
10,295 |
| BrowseModuleWithLinks |
Add LinkTo and LinkFrom columns to a module view |
9,749 |
| ExtendedLinks |
Open a view that gathers links end point attribute data |
9,287 |
| PABoolEnumCombo |
Open a view that filters on multiple attribute types |
8,442 |
| PAMultiEnumFilter |
Open a view that filters on a multi-enum attribute |
8,022 |
| PA4EnumFilterAllArtifacts |
Open a view that checks pa4enum enumfilter on all artifacts view |
7,504 |
| LinkExists_Stress |
Open a view that with a "Link does exist" filter in the stress component |
4,609 |
| ChangeSetCreate_ConfirmCreate |
Create a new change set |
4,451 |
| Upload4MbFileNewArtifact_Upload4MbFile |
Upload 4Mb file |
3,425 |
| CreateLink_ConfirmCreateLink |
Confirm link creation |
3,188 |
| PAMultiEnumFilter_Stress |
Open a view that filters on a multi-enum attribute in the stress component |
3,145 |
| CreateLink_SelectModule |
Select link destination module |
2,900 |
| PABoolEnumCombo_Stress |
Open a view that filters on multiple attribute types in the stress component |
2,842 |
| ExtendedLinks_Stress |
Open a view that gathers links end point attribute data in the stress component |
2,492 |
| PA4EnumFilterAllArtifacts_Stress |
Open a view that checks pa4enum enumfilter on all artifacts view in stress component |
2,404 |
| CreateLink_SelectComponent |
Select link destination component |
2,291 |
| Upload4MbFileNewArtifact_ShowArtifacts |
Show artifacts list |
2,191 |
| ShowModules |
Show modules list |
2,053 |
| SmallDeliver_SelectInsertNewArtifactAfter |
Insert artifact in module |
1,883 |
| LinkDoesNotExist |
Open a view that with a "Link does not exist" filter |
1,835 |
| OpenModule |
Open selected module |
1,480 |
| HoverArtifactEditMod_DoneEdit |
Confirm module description edit |
1,397 |
| OpenModule_Stress |
Open selected module in stress component |
1,375 |
| SmallDeliver_ConfirmInsertNewArtifactAfter |
Confirm new artifact insert in module |
1,357 |
| CreateLink_ShowModuleList |
Show modules available to link |
1,338 |
| ShowArtifacts |
Show artifacts list |
1,316 |
| CreateLink_SelectLinkTo |
Select link creation type |
1,294 |
| LargeDeliver_EditAndSaveArtifact |
Save artifact edit in module |
1,204 |
| SmallChangeSetDeliver_OpenConfigurationMenu |
Open configuration menu |
1,180 |
| SelectDiscard |
Select changeset discard |
1,098 |
| LargeDeliver_ConfirmInsertNewArtifactAfter |
Confirm new artifact insert in module |
1,090 |
| SmallDeliver_EditAndSaveArtifact |
Save artifact edit in module |
1,088 |
| SelectDiscard_Stress |
Select changeset discard in stress component |
1,017 |
Top transactions for DN 7.0.3 testing on Oracle
Some of the more complex operations (creating streams or baselines, delivering change sets, or creating reports from modules) can take longer - response times for the complex operations are listed below.
Top Large transactions by average response time
| Transaction |
Description |
Time [ms] |
| CreateStream |
Create a new stream |
68,263 |
| CreateWordDoc_Stress |
Create a word document from a module in the stress component |
60,939 |
| CreateWordDoc |
Create a word document from a module |
49,855 |
| ChangeSet_FinishAndDeliverLarge |
Delivering a change set with the large profile |
21,620 |
| ChangeSet_FinishAndDeliverSmall_Stress |
Delivering a change set with the small profile in the stress component |
19,537 |
| CopyPaste25 |
Copying 25 artifacts and pasting in same module |
19,035 |
| ChangeSet_SelectDeliverLarge |
Initial deliver step with changes from large profile |
16,654 |
| ChangeSet_FinishAndDeliverSmall |
Delivering a change set with the small profile |
16,514 |
| ChangeSet_FinishAndDeliverLink |
Delivering a change set from a link generation script |
14,894 |
| ChangeSet_SelectDeliverLink |
Delivering a change set with the large profile |
14,012 |
| ChangeSet_SelectDeliverSmall |
Initial deliver step with changes from small profile |
13,167 |
| ChangeSet_SelectDeliverSmall_Stress |
Initial deliver step with changes from small profile in stress component |
12,976 |
| ChangeSet_SelectDeliverLarge_Stress |
Delivering a change set with the large profile in the stress component |
12,090 |
| ConfirmDiscard |
Discard changes from change set |
11,698 |
| ChangeSet_FinishAndDeliverLarge_Stress |
Delivering a change set with the large profile in the stress component |
10,510 |
| ConfirmDiscard_Stress |
Discard changes from change set in stress component |
7,190 |
| CreateBaseline_Stress |
Create new baseline in stress component |
4,528 |
| CreateBaseline |
Create new baseline |
3,963 |
Event and Log based TRS Data Shape and Workload for DN 7.0.3
DOORS Next 7.0.3 released "Log based TRS", a new implementation of the DN TRS redesigned to be more efficient and robust. You can read more about the new TRS feature here,
Whats new for IBM Engineering 7.0.3 administrators? DOORS Next TRS design changes can affect certain operations performance, related to LQE and Jazz Reporting.
The goal of our DN TRS testing was to ensure Event and Log based TRS continued to perform equally well for DN Rebase, LQE Reindex of DN, and DN Validation. For TRS testing we used two different environments. Our Oracle TRS environment with 12 million resources, primarily used for performance comparisons of Event and Log based TRS. And our DB2 TRS environment with 71 million resources, primary used for large scale performance testing of Rebase, Reindex and Validation times. Also its important to note for TRS performance testing we used 300 concurrent users, specifically because the workloads were modified with higher % "deliver scenarios" and "duplicate delivery scenarios". This modification was important to help identify potential bottlenecks in the new TRS solution. These delivery rates, specifically in the TRS DB2 workload are higher than we might expect in a typical live customer environment.
TRS Workload for DN 7.0.3 testing on Oracle
- DN Artifacts 5 Million
- DN Indexed Resources 12 Million (includes links)
- 300 concurent users
- LQE Jena
- Primarily used for performance comparisons of Event and Log based TRS
- Collected comparisons for Rebase, Reindex and Validation times
- Oracle TRS hardware details
The TRS workload for DN 7.0.3 testing on Oracle is described in the following table. This indicates the percentage of user load for each scenario.
List of scripts and their proportion of the designated workload
| Script |
Percentage Usage |
Target Component |
| ScrollModule |
16% |
General |
| HoverArtifactEditMod |
9% |
General |
| Upload4MbFileNewArtifact |
4% |
General |
| CreateModArtifactComment |
4% |
General |
| CopyPaste25 |
4% |
General |
| CreateStream |
1 User |
General |
| CreateBaseline |
2% |
General |
| MultiSizeDeliver_Small |
16% |
General |
| MultiSizeDeliver_Large |
4% |
General |
| MultiSizeDiscard_Small |
9% |
General |
| MultiSizeDiscard_Large |
4% |
General |
| ViewModuleHistory |
4% |
General |
| CreateWordFromModule |
2% |
General |
| BrowseModuleLinks |
9% |
General |
| HoverModuleLink |
4% |
General |
| CreateLinkAndDeliver |
9% |
General |
TRS Workload for DN 7.0.3 testing on DB2
- DN Artifacts 5 Million
- DN Indexed Resources 71 Million (includes links)
- 300 concurent users
- LQE relational store
- Primary used for large scale performance testing of Rebase, Reindex and Validation times
- DB2 TRS hardware details:
The TRS workload for DN 7.0.3 testing on DB2 is described in the following table. This indicates the percentage of user load for each scenario. The DB2 TRS workload was also run with a manual large 10k artifact ReqIf import, both inside and outside of a changeset.
List of scripts and their proportion of the designated workload
| Script |
Percentage Usage |
Target Component |
| ScrollModule |
1.5% |
General |
| HoverArtifactEditMod |
4.5% |
General |
| Upload4MbFileNewArtifact |
2% |
General |
| CreateModArtifactComment |
2% |
General |
| CopyPaste25 |
2% |
General |
| CreateStream |
1 User |
General |
| 10kReqIfImport |
1 User |
Manual |
| 10kReqIfImportInsideChangeSet |
1 User |
Manual |
| CreateBaseline |
1% |
General |
| MultiSizeDeliver_Small |
8% |
General |
| MultiSizeDeliver_Large |
2% |
General |
| MultiSizeDiscard_Small |
4.5% |
General |
| MultiSizeDiscard_Large |
2% |
General |
| DuplicateDeliver without Baseline |
25% |
General |
| DuplicateDeliver with Baseline |
25% |
General |
| ViewModuleHistory |
2% |
General |
| CreateWordFromModule |
1% |
General |
| HoverModuleLink |
2% |
General |
| CreateLinkAndDeliver |
4.5% |
General |
| ViewLinkExists |
1.5% |
General |
| ViewLinkDoesNotExist |
1.5% |
General |
| ViewPA4EnumFilterAllArtifacts |
2% |
General |
| ExtendedLinks |
2% |
General |
| ViewPABoolEnumCombo |
2% |
General |
| ViewPAMulitEnumFilter |
2% |
General |
Event and Log based TRS test results for DN 7.0.3
As of DN 7.0.3 GA our Event and Log based TRS testing showed healthy performance results. Comparing the Event and Log based solution, we can consistently see Log based ran equal or better for Rebase, Reindex and Validation times.
Our DB2 Log based testing with 71 million resources demonstrated hosting the LQE Relational Store database on a large NVME drive array can be highly beneficial. When trying this same test with our typical 16 drive SAS array, our 71 million resource environment would take five to ten times longer to complete Rebase and Reindex operations. Indicating it is very important the underlying storage solution for databases and LQE adequately matches the size of resources being processing.
Full Rebase
Time required to rebase DN. This operation is required to switch to the new Log based TRS implementation. We can see here our 24 NVME drive array performed well and kept rebase under two days for our 71 Million resource environment.
| |
Oracle Event Based |
Oracle Log Based |
DB2 Log Based |
| Storage |
Raid 1 - 6.4TB NVME x 2 |
Raid 1 - 6.4TB NVME x 2 |
Raid 10 - 800GB NVME x 24 |
| Indexed Resources |
12 Million |
12 Million |
71 Million |
| Duration |
21 hours 13 mins |
11 hours 24 mins |
34 hours 20 mins |
Reindex
Time required to reindex the DN resources into LQE. This operation is required to switch to the new Log based TRS implementation. Here our 24 NVME drive array again performed great, and significantly reduced the indexing time to process 71 million resources. 24 drives processed 71 million resources in the same time 2 drives processed 12 Million.
| |
Oracle Event Based |
Oracle Log Based |
DB2 Log Based |
| Storage |
Raid 1 - 6.4TB NVME x 2 |
Raid 1 - 6.4TB NVME x 2 |
Raid 10 - 800GB NVME x 24 |
| Indexed Resources |
12 Million |
12 Million |
71 Million |
| Base Process |
2 days 21 hours 23 mins |
2 days 14 hours 35 mins |
2 days 22 hours 27 mins |
| Removal Process |
9 mins |
9 mins |
16 mins |
| Compaction |
30 hours |
20 hours |
Not Collected |
TRS Validation
Time required to Validate DN resources in our environments. "Initial Validation" is the first validation without any validation cache. "Unchanged Incremental Validation" is our second validation done with the validation cache in place, but without making changes to the repository. "Changed Incremental Validation" is our third validation done after running approximately 6 hours of performance workloads against the server, with the validation cache in place. Note Event based TRS results were not fully collected due to some defects in in the Event based TRS design, which prevented accurate validations inside of our environment.
| |
Oracle Event Based |
Oracle Log Based |
DB2 Log Based |
| Storage |
Raid 1 - 6.4TB NVME x 2 |
Raid 1 - 6.4TB NVME x 2 |
Raid 10 - 800GB NVME x 24 |
| Indexed Resources |
12 Million |
12 Million |
71 Million |
| Initial Validation |
2 days 9 hours |
1 day 10 hours 15 mins |
3 days 5 hours 10 mins |
| Unchanged Incremental Validation |
Not Collected |
2 hours 23 mins |
34 hours 0 mins |
| Changed Incremental Validation |
Not Collected |
7 hours 15 mins |
43 hours 0 mins |
Appendix - Additional details
Oracle regression test environment for DN 7.0.3 testing
| Role |
Server |
Number of machines |
Machine type |
Processor |
Total processors |
Memory |
Storage |
Network interface |
OS and version |
| Proxy Server |
IBM HTTP Server and WebSphere Plugin |
1 |
IBM System x3550 M3 |
2 x Intel Xeon X5667 3.07 GHz (quad-core) |
16 |
32 GB |
RAID 5 279GB SAS Disk x 4 |
Gigabit Ethernet |
Red Hat Enterprise Linux Server 7 (Maipo) |
| RM server |
Embedded WebSphere Liberty |
1 |
IBM System x3550 M4 |
2 x Intel Xeon E5-2640 2.5GHz (six-core) |
24 |
64 GB |
RAID 5 279GB SAS Disk x 4 |
Gigabit Ethernet |
Red Hat Enterprise Linux Server 7 (Maipo) |
| Jazz Team Server and Global Configuration Server |
Embedded WebSphere Liberty |
1 |
IBM System x3550 M4 |
2 x Intel Xeon E5-2640 2.5GHz (six-core) |
24 |
32 GB |
RAID 5 279GB SAS Disk x 4 |
Gigabit Ethernet |
Red Hat Enterprise Linux Server 7 (Maipo) |
| Database |
Oracle 19c Enterprise Edition |
1 |
IBM System SR650 |
2 x Xeon Silver 4114 10C 2.2GHz (ten-core) |
40 |
192 GB |
RAID 10 900GB SAS Disk x 16 |
Gigabit Ethernet |
Red Hat Enterprise Linux Server 8 (Ootpa) |
Storage details are below. See
Disk benchmarking for more details on I/O benchmarking.
| RAID controller |
Lenovo RAID 930-16i 4GB flash |
| RAID mode |
RAID10 |
| RAM (G) |
64 |
| Total disks |
14 |
| Spans |
7 |
| Disks per span |
2 |
| Drive speed (Gbps) |
12 |
| Strip size (Kbyte) |
256 |
| Logical sector size (bytes) |
512 |
| Caching mode |
Write-back |
| Disk type |
900G Lenovo ST900MP0146 |
| Spin rate (rpm) |
15000 |
| Calibrate_io - IOPS |
6896 |
| Calibrate_io - Mbps |
449 |
| SLOB IOPS |
22581 |
| Sysbench random r/w |
|
| * IOPS |
989 |
| * Read MiB/s |
4.1 |
| * Write MiB/s |
2.7 |
| Sysbench sequential read |
|
| * IOPS |
15280 |
| * Read MiB/s |
239 |
Oracle TRS test environment for DN 7.0.3 testing
- DN Artifacts 5 Million
- DN Indexed Resources 12 Million (includes links)
- LQE Jena
| Role |
Server |
Number of machines |
Machine type |
Processor |
Total processors |
Memory |
Storage |
Network interface |
OS and version |
| Proxy Server |
IBM HTTP Server and WebSphere Plugin |
1 |
IBM System x3550 M3 |
2 x Intel Xeon X5667 3.07 GHz (quad-core) |
8 |
16 GB |
RAID 5 279GB SAS Disk x 4 |
Gigabit Ethernet |
Red Hat Enterprise Linux Server 7 (Maipo) |
| RM server |
Embedded WebSphere Liberty |
1 |
IBM System x3550 M4 |
2 x Intel Xeon E5-2640 2.5GHz (six-core) |
24 |
64 GB |
RAID 5 279GB SAS Disk x 4 |
Gigabit Ethernet |
Red Hat Enterprise Linux Server 7 (Maipo) |
| Jazz Team Server and Global Configuration Server |
Embedded WebSphere Liberty |
1 |
IBM System x3550 M4 |
2 x Intel Xeon E5-2640 2.5GHz (six-core) |
24 |
32 GB |
RAID 5 279GB SAS Disk x 4 |
Gigabit Ethernet |
Red Hat Enterprise Linux Server 7 (Maipo) |
| LQE Jena Server |
Embedded WebSphere Liberty |
1 |
IBM System x3550 M4 |
2 x Intel Xeon E5-2640 2.5GHz (six-core) |
24 |
128 GB |
RAID 1 6.4TB NVMe Mainstream Drive x 2 |
Gigabit Ethernet |
Red Hat Enterprise Linux Server 7 (Maipo) |
| Database |
Oracle 19c |
1 |
IBM System x3650 M4 |
2 x Intel Xeon E5-2640 2.5GHz (six-core) |
24 |
64 GB |
RAID 10 300GB SAS Disk x 16 |
Gigabit Ethernet |
Red Hat Enterprise Linux Server 7 (Maipo) |
DB2 TRS test environment for DN 7.0.3 testing
- DN Artifacts 5 Million
- DN Indexed Resources 71 Million (includes links)
- LQE Relational Store
| Role |
Server |
Number of machines |
Machine type |
Processor |
Total processors |
Memory |
Storage |
Network interface |
OS and version |
| Proxy Server |
IBM HTTP Server and WebSphere Plugin |
1 |
IBM System x3550 M3 |
2 x Intel Xeon X5667 3.07 GHz (quad-core) |
8 |
16 GB |
RAID 5 279GB SAS Disk x 4 |
Gigabit Ethernet |
Red Hat Enterprise Linux Server 7 (Maipo) |
| RM server |
Embedded WebSphere Liberty |
1 |
IBM System x3550 M4 |
2 x Intel Xeon E5-2640 2.5GHz (six-core) |
24 |
32 GB |
RAID 5 279GB SAS Disk x 4 |
Gigabit Ethernet |
Red Hat Enterprise Linux Server 7 (Maipo) |
| Jazz Team Server and Global Configuration Server |
Embedded WebSphere Liberty |
1 |
IBM System x3550 M4 |
2 x Intel Xeon E5-2640 2.5GHz (six-core) |
24 |
32 GB |
RAID 5 279GB SAS Disk x 4 |
Gigabit Ethernet |
Red Hat Enterprise Linux Server 7 (Maipo) |
| Database |
DB2 11.5 Advanced Edition |
1 |
IBM System x3650 M4 |
2 x Intel Xeon E5-2640 2.5GHz (six-core) |
24 |
64 GB |
RAID 10 300GB SAS Disk x 16 |
Gigabit Ethernet |
Red Hat Enterprise Linux Server 7 (Maipo) |
| LQE Server |
Embedded WebSphere Liberty |
1 |
IBM System x3650 M4 |
2 x Intel Xeon E5-2640 2.5GHz (six-core) |
24 |
128 GB |
RAID 5 279GB SAS Disk x 4 |
Gigabit Ethernet |
Red Hat Enterprise Linux Server 7 (Maipo) |
| LQE Relational Store Database |
DB2 11.5 Advanced Edition |
1 |
Lenovo ThinkSystem SR650 V2 |
2 x Xeon Silver 4114 10C 2.2GHz (ten-core) |
40 |
768 GB |
RAID 10 800GB NVME Mainstream x 24 |
Gigabit Ethernet |
Red Hat Enterprise Linux Server 8 (Ootpa) |
WebSphere Liberty Java memory settings and ELM admin settings
Note in 7.0.3 Liberty Java startup memory settings have been updated to reflect optimal memory settings for Java 11:
- -Xmx24G -Xms24G -Xmn4G -Xgcpolicy:gencon
- -Dcom.ibm.rdm.configcache.expiration=5040
- -Dcom.ibm.rdm.configcache.size=5000
- In rm/admin and gc/admin:
- Maximum number of contributions per composite: 5000
- JDBC connection pool: 400
- RDB Mediator pool: 400
- Maximum outgoing HTTP connections per destination: 400
- Maximum outgoing HTTP connections total: 500
- In rm/admin:
- View query threadpool size override: 500
- Maximum number of changesets allowed for processing: 550000
- Note increasing the "maximum number of changesets allowed to process" will allow larger changesets to be committed. But we are aware of some performance problems which can occur when trying to process extremely large changesets with over 60k changes.
References:


 The large GC looks like this:

 The next chart shows regression comparisons for DN 500 concurrent user performance benchmarks on Oracle of all "Long Running Transactions". Again transaction times were lower in 7.0.3 due to many scenarios having 7.0.3 development improvements, resulting in lower resource consumption and improved server health.
