Introduction
This page provides guidance for sizing database servers that host the Lifecycle Query Engine - Relational store (LQE rs) application. LQE rs is an implementation of the Lifecycle Query Engine that replaces Jena with a relational database. This improves report scalability while reducing LQE resource requirements.Standard disclaimer
The information in this document is distributed AS IS. The use of this information or the implementation of any of these techniques is a customer responsibility and depends on the customers ability to evaluate and integrate them into the customers operational environment. While each item may have been reviewed by IBM for accuracy in a specific situation, there is no guarantee that the same or similar results will be obtained elsewhere. Customers attempting to adapt these techniques to their own environments do so at their own risk. Any pointers in this publication to external Web sites are provided for convenience only and do not in any manner serve as an endorsement of these Web sites. Any performance data contained in this document was determined in a controlled environment, and therefore, the results that may be obtained in other operating environments may vary significantly. Users of this document should verify the applicable data for their specific environment. Performance is based on measurements and projections using standard IBM benchmarks in a controlled environment. The actual throughput or performance that any user will experience will vary depending upon many factors, including considerations such as the amount of multi-programming in the users job stream, the I/O configuration, the storage configuration, and the workload processed. Therefore, no assurance can be given that an individual user will achieve results similar to those stated here. This testing was done as a way to compare and characterize the differences in performance between different versions of the product. The results shown here should thus be looked at as a comparison of the contrasting performance between different versions, and not as an absolute benchmark of performance.Summary of results
We ran a series of tests to determine how much database memory was optimal for our performance workload. Based on these tests, we recommend setting your buffer cache or buffer pool to 10% of the disk size of your LQE rs database. Then, monitor the I/O on your database and adjust that number up or down based on your own reporting workload.Background
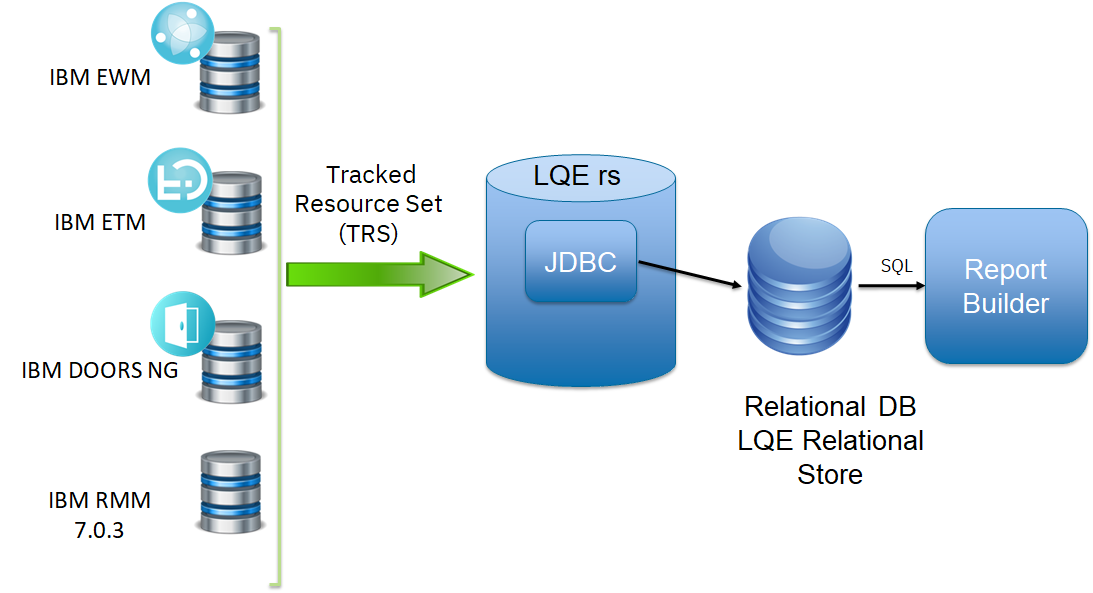
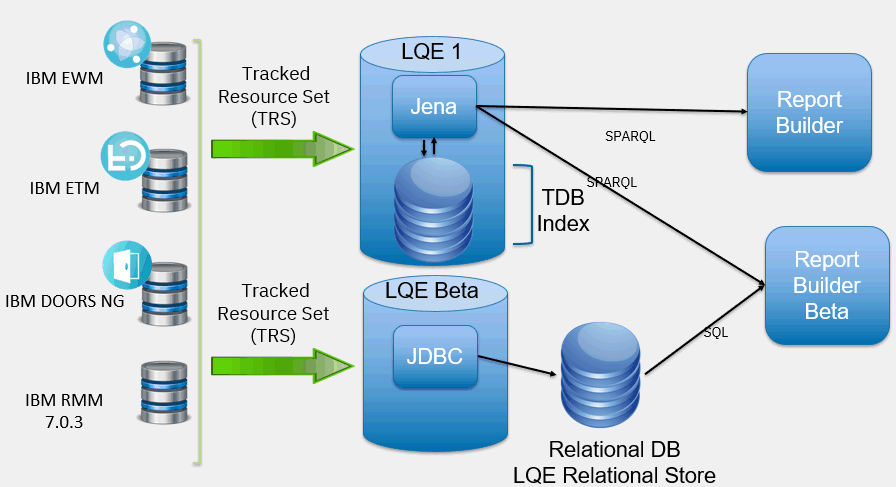
The Jazz Reporting Service is the default reporting option for the IBM® Engineering solutions. You can quickly and easily consolidate data from a variety of sources across your tools and project areas. It consists of three components: Report Builder, Data Collection Component, and Lifecycle Query Engine. The Lifecycle Query Engine (LQE) implements a Linked Lifecycle Data Index over data provided by one or more lifecycle tools. A lifecycle tool makes its data available for indexing by exposing its Linked Lifecycle Data via a Tracked Resource Set. With this index, you can build sophisticated traceability reports to understand relationships between your data (for example, find all requirements that are associated with failing test cases). When LQE was introduced, it stored index data using Apache Jena TDB. Reports were implemented using SPARQL queries. The architecture is shown below: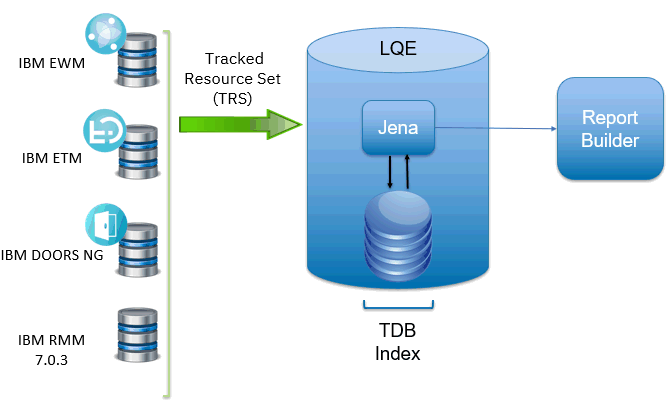 This architecture has several disadvantages for large indexes:
 - The TDB index must be local to the LQE server machine, which prevents addressing scale issues through clustering
- Large Jena indexes must be almost entirely cached in memory for performance reasons, so that LQE servers require large amounts of RAM (as well as large Java heaps)
- Jena does not have a sophisticated query optimization engine, so complex traceability reports could be slow.
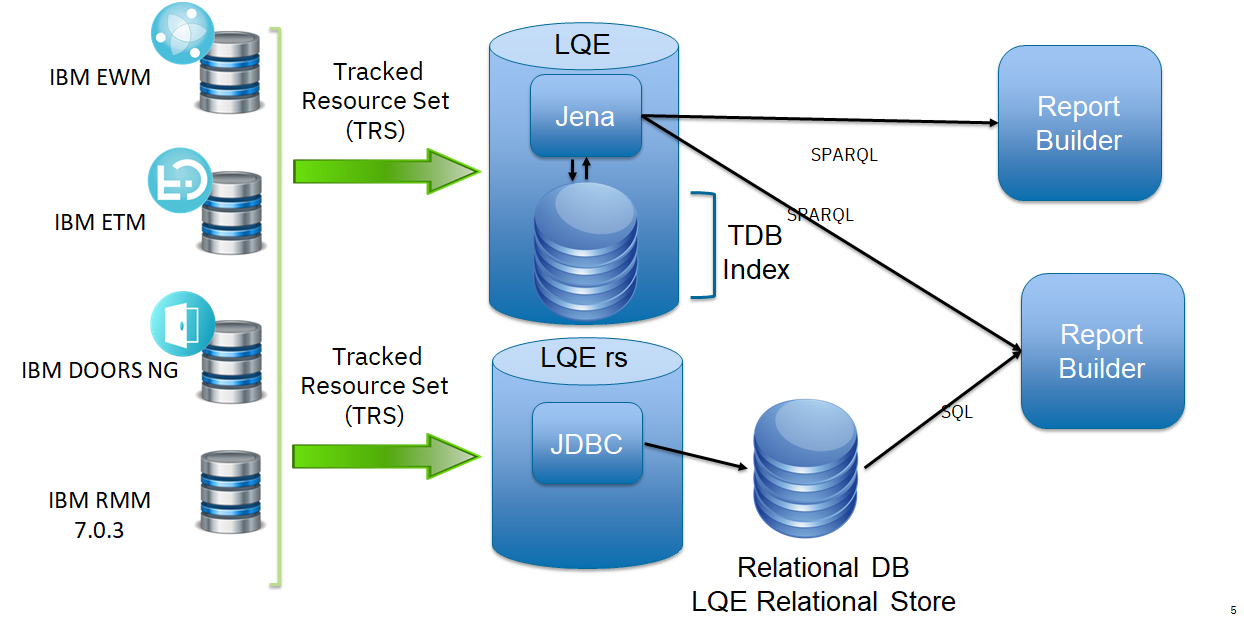
 This improves the scalability of the LQE solution in several ways.
 - Clustering becomes possible through standard database solutions like Oracle RAC
- Database optimization engines are more sophisticated than Jena, allowing for improved query execution
- Relational databases are designed for high data volumes, with many optimizations available to limit physical IO
- Relational databases are much better at dealing with concurrent reading and writing. While locking is still needed, the locking usually happens at the row level. Lock escalation to the table level is not frequent, so one slow SQL query will not disrupt the entire server.
- Since query processing shifts from the LQE server to the database server in this architecture, the LQE server requires less RAM. RAM freed up from LQE can be moved to the database server where it can be used more efficiently
Test results
The goal of these tests was to determine how much database memory should be allocated to the database caches, specifically:- The buffer cache on Oracle
- The buffer pool on DB2
Test results for Oracle
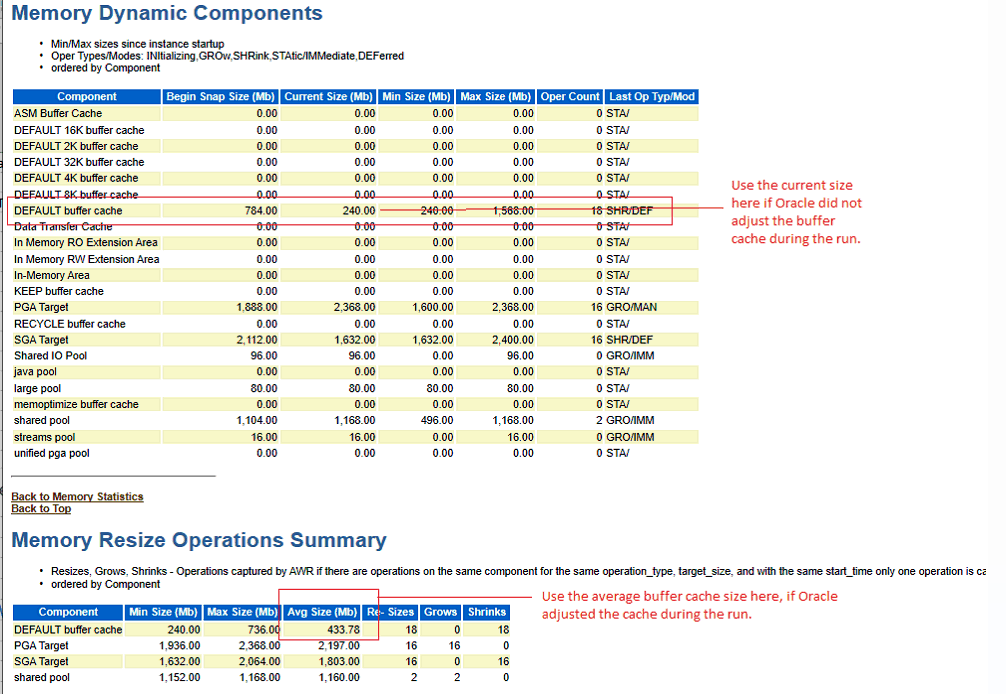
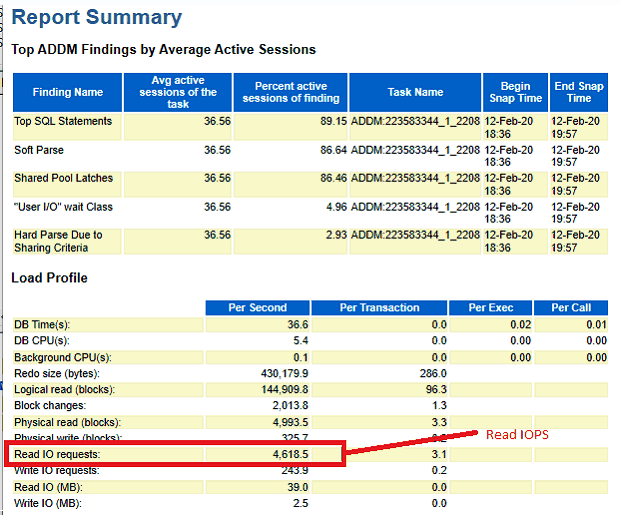
In these tests, we kept the total memory allocated to Oracle fixed at 96G, and then varied the size of the buffer cache (by setting the parameter DB_CACHE_SIZE). For each value of buffer cache, we then ran a 100 user reporting workload (with report caching disabled). We collected operating system metrics during the test, and also captured an AWR report during the peak load. We extracted the number of Read IO requests per second from the AWR report. We disabled caching in report builder to have better control over when SQL statements execute. With report caching enabled, a request to generate a report may avoid executing a SQL statement, which reduces pressure on the buffer cache. With caching disabled, each request to generate a report runs a SQL statement. This results in a more predictable I/O load. I/O as a function of buffer cache size is shown below. For this workload, a 24G buffer cache is optimal.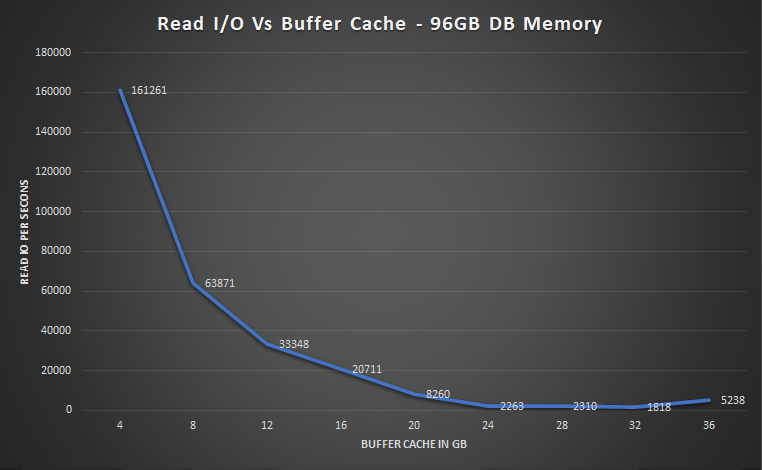 Other test details:
 - Disk size of LQE rs database: 698G
- Total RAM on database server: 768G
- Database CPU utilization: 25%
- Disk busy (24G buffer cache): 12%
Test results for DB2
For DB2 tests, we set the total amount of database memory to be 128G, disabled self-tuning memory, and then varied the buffer pool size from 3G to 60G. We ran a reporting workload and measured the disk utilization (disk busy) of the DB2 server. We plotted disk utilization vs. buffer pool size (see chart below). The optimal buffer pool size is where the curve starts to flatten out (where there are diminishing returns from adding more memory). For this workload, the optimal buffer pool size is 27G. We recommend disabling self-tuning memory for the LQE rs database. When self-tuning memory is enabled, DB2 can shrink the buffer pool, and this can temporarily lead to poor query performance. Performance improves once DB2 increases the size of the buffer pool. When self-tuning memory is disabled, report performance will be more consistent.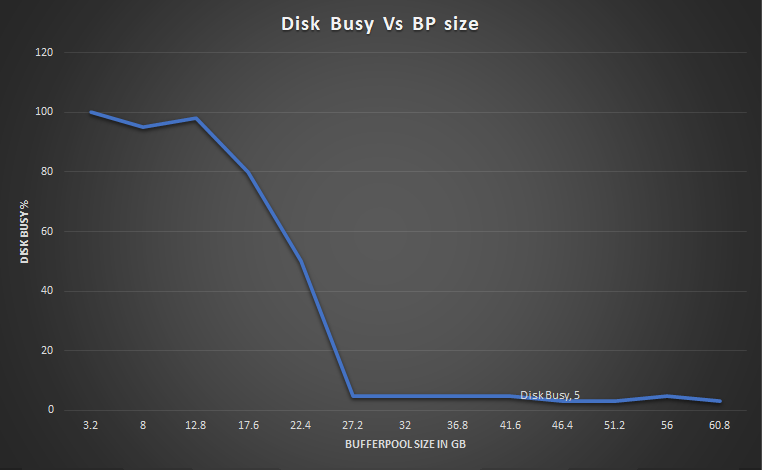 We disabled caching in report builder to have better control over when SQL statements execute. With report caching enabled, a request to generate a report may avoid executing a SQL statement, which reduces pressure on the buffer cache. With caching disabled, each request to generate a report runs a SQL statement. This results in a more predictable I/O load.
Other test details:
We disabled caching in report builder to have better control over when SQL statements execute. With report caching enabled, a request to generate a report may avoid executing a SQL statement, which reduces pressure on the buffer cache. With caching disabled, each request to generate a report runs a SQL statement. This results in a more predictable I/O load.
Other test details: - Disk size of LQE rs database: 665G
- Total RAM on database server: 768G
- Database CPU utilization: 25%
Factors impacting database sizing
As a general rule, reports perform best if the database is able to cache the rows that the report operates on in memory. If the rows are not in memory, the database must read them into memory from disk, and this adds to the report execution time. It is not necessary to have so much memory that the database is held in memory in its entirety - you only need enough for whatever subset of rows are being commonly used by reports. This is why we suggest sizing your database caches based on 10% of the disk size of the data warehouse, as a starting point. There are several factors that impact memory usage and may require you to increase (or decrease) the database memory. This section describes those factors in more detail.Overall reporting workload
One factor that impacts database memory usage is the reports themselves. One factor that impacts database memory usage is the reports themselves. The amount of memory required depends on what the reports are doing, how big the index is, how many reports are running concurrently, how many rows are returned, and how long the reports run. There are database tables that represent the different ELM artifacts and the relationships between them. A traceability report that looks at links between multiple artifacts (e.g. work items linked to test cases with failing test results) will need to examine more database tables than a report against a single artifact type (e.g. work items open in the current release), and this can require larger database caches to achieve optimum performance. Additionally, the LQE rs schema stores artifact properties in their own database tables. So, the columns that you select for display in a report can result in examining additional database tables. Report scoping is another factor. For reports scoped to a global configuration, larger global configurations will require more memory. However, using conditions can help to reduce the memory required by allowing the database to filter out artifacts that are not relevant. Reports that return more rows will touch more parts of the database than reports that return fewer rows. Finally, consider your overall reporting workload. Think about the number of concurrent users that might be running reports, either directly or through dashboards. Since Report Builder caches report results, what's important is the total number of active reports (and their variants). Each set of report parameters (including scope values like global configurations as well as the user running the report) results in a unique report instance, which then may touch different parts of the database. So, if you have mostly complex reports that run with a variety of different parameters, under high concurrency, you should consider increasing the database caches to 15 or 20% of the disk size of the LQE database. Simpler reports running at lower concurrency will require less (say 5%).Amount of indexed data
Monitoring memory usage
Because memory requirements will vary based on your specific reporting workload, we recommend that you monitor the database server so that you can adjust database cache sizes as needed. You can monitor:- The disk size of the LQE rs database
- On Oracle, how much of the tables and indexes are resident in memory
- The disk sizes of the individual tables and indexes in the LQE rs database
- Key operating system metrics (disk utilization, CPU utilization)
- On Oracle, the number of disk reads per second (from an AWR report)
Oracle: What's resident in memory
To see which tables and indexes are cached in memory on Oracle, run the following SQL command:set pagesize 0 COLUMN OBJECT_NAME FORMAT A40 COLUMN NUMBER_OF_BLOCKS FORMAT 999,999,999,999 COLUMN OBJECT_TYPE FORMAT a10 SELECT o.OBJECT_NAME, o.object_type, COUNT(*) NUMBER_OF_BLOCKS FROM DBA_OBJECTS o, V$BH bh WHERE o.DATA_OBJECT_ID = bh.OBJD AND o.OWNER = 'RITRS' GROUP BY o.OBJECT_NAME, o.object_type ORDER BY COUNT(*);This lists the number of blocks of each table or index that are resident in memory. Multiply this by the block size of the database to convert to bytes. Some example output is shown below. Here, the REQUIREMENT table has 1,683,362 blocks in memory, and the block size for this Oracle instance is 8k. So, 13G of data from the REQUIREMENT table is loaded into the buffer cache.
RESOURCE_PROPERTY                        TABLE               580,249
WORK_ITEM                                TABLE               637,868
REQUIREMENT                              TABLE             1,683,362
Size of the LQE rs database
On DB2, you can get the size of the RS database by running the following command:db2 "call GET_DBSIZE_INFO (?,?,?,1)" Value of output parameters -------------------------- Parameter Name : SNAPSHOTTIMESTAMP Parameter Value : 2023-03-23-12.42.05.471605 Parameter Name : DATABASESIZE Parameter Value : 665232097280 Parameter Name : DATABASECAPACITY Parameter Value : 2242420260864The DATABASESIZE parameter is the size of the database in bytes. On Oracle, run the following script to get the sizes of all tablespaces on the Oracle instance:
set pagesize 0
col "Tablespace" for a22
col "Used MB" for 99,999,999

select df.tablespace_name "Tablespace",
totalusedspace "Used MB"
from
(select tablespace_name,
round(sum(bytes) / 1048576) TotalSpace
from dba_data_files
group by tablespace_name) df,
(select round(sum(bytes)/(1024*1024)) totalusedspace, tablespace_name
from dba_segments
group by tablespace_name) tu
where df.tablespace_name = tu.tablespace_name ;
The output of that script will be similar to this:
Tablespace                          Used MB
SYSTEM                               1006
SYSAUX                              37588
VNF_IDX                            380097
VNF_32K                            332177
LQE                                  1477
UNDOTBS1                              172
USERS                               32111
VSTR_32K                                8
VSTR_IDX                               11
To get the LQE rs database size, add up the "used MB" values for the VNF_IDX and VNF_32K tablespaces.
Getting table and index sizes from Oracle
On Oracle, you can get the sizes of the tables in the LQE rs database by running the following script. This shows table sizes in bytes.set pagesize 0 COLUMN TABLESPACE_NAME FORMAT A10 COLUMN SEGMENT_NAME FORMAT A45 SELECT DS.TABLESPACE_NAME, SEGMENT_NAME, DS.BYTES FROM DBA_SEGMENTS DS WHERE (DS.TABLESPACE_NAME = 'VNF_32K') and SEGMENT_NAME IN (SELECT TABLE_NAME FROM DBA_TABLES) ORDER BY DS.BYTES DESC;Here is sample output taken from the IBM performance lab, showing the top 5 largest tables in our test configuration:
VNF_32K    URL                                           6.4357E+10
VNF_32K    REQUIREMENT_RELATIONSHIP                      4.4023E+10
VNF_32K    TEST_RICH_TEXT_SECTION                        3.2749E+10
VNF_32K    REQUIREMENT_STRING_PROP                       3.1541E+10
VNF_32K    TEST_SCRIPT_STEP_RESULT                       2.3488E+10
Get the sizes of the indexes by running the following script. This shows index sizes in bytes.
set pagesize 0
COLUMN TABLESPACE_NAME FORMAT A10
COLUMN SEGMENT_NAME FORMAT A50
SELECT DS.TABLESPACE_NAME, SEGMENT_NAME, DS.BYTES
  FROM DBA_SEGMENTS DS
  WHERE DS.TABLESPACE_NAME = 'VNF_IDX' and SEGMENT_NAME IN (SELECT INDEX_NAME FROM DBA_INDEXES)
  ORDER BY DS.BYTES DESC;
Here is sample output taken from the IBM performance lab, showing the top 5 largest indexes in our test configuration:
VNF_IDX    REQUIREMENT_STRING_PROP_IDX3                       2.5636E+10
VNF_IDX    REQUIREMENT_STRING_PROP_IDX2                       1.4361E+10
VNF_IDX    SELECTIONS_SELECTS_IDX2                            1.4093E+10
VNF_IDX    SELECTIONS_SELECTS_IDX4                            1.3556E+10
VNF_IDX    SELECTIONS_SELECTS_IDX3                            1.2549E+10
Note that the LQE rs schema stores tables and indexes in separate tablespaces.
Getting table and index sizes from DB2
To get the sizes of individual tables on DB2, connect to the LQE rs database and then run the following SQL statement:SELECT SUBSTR(TABSCHEMA,1,18) TABSCHEMA,SUBSTR(TABNAME,1,30) TABNAME,(DATA_OBJECT_P_SIZE + INDEX_OBJECT_P_SIZE + LONG_OBJECT_P_SIZE + LOB_OBJECT_P_SIZE + XML_OBJECT_P_SIZE) AS TOTAL_SIZE_IN_KB,(DATA_OBJECT_P_SIZE + INDEX_OBJECT_P_SIZE + LONG_OBJECT_P_SIZE + LOB_OBJECT_P_SIZE + XML_OBJECT_P_SIZE)/1024 AS TOTAL_SIZE_IN_MB, (DATA_OBJECT_P_SIZE + INDEX_OBJECT_P_SIZE + LONG_OBJECT_P_SIZE + LOB_OBJECT_P_SIZE + XML_OBJECT_P_SIZE) / (1024*1024) AS TOTAL_SIZE_IN_GB FROM SYSIBMADM.ADMINTABINFO WHERE TABSCHEMA = 'RITRS' ORDER BY TOTAL_SIZE_IN_KB DESC;Here is sample output taken from the IBM performance lab, showing the top 5 largest tables in our DB2 test configuration:
TABSCHEMA          TABNAME                        TOTAL_SIZE_IN_KB     TOTAL_SIZE_IN_MB     TOTAL_SIZE_IN_GB
------------------ ------------------------------ -------------------- -------------------- --------------------
RITRS              URL                                       118309888               115537                  112
RITRS              REQUIREMENT_RELATIONSHIP                  100173824                97826                   95
RITRS              REQUIREMENT_STRING_PROP                    56057856                54744                   53
RITRS              SELECTIONS_SELECTS                         44907520                43855                   42
RITRS              VERSION_RESOURCE                           37067776                36199                   35
You can get the total size of all indexes defined for a table by running the following script:
SELECT distinct substr(tabname, 1, 30) as TABLE, substr(tabschema, 1, 20) as SCHEMA,
   index_object_p_size  as IndexSizeKB
   FROM TABLE(sysproc.admin_get_index_info('T','','')) AS t where t.tabschema = 'RITRS' order by IndexSizeKB desc;
Here is sample output taken from the IBM performance lab, showing the tables that have the largest collection of indexes:
TABLE                          SCHEMA               INDEXSIZEKB
------------------------------ -------------------- --------------------
URL                            RITRS                            55036928
REQUIREMENT_RELATIONSHIP       RITRS                            53405696
SELECTIONS_SELECTS             RITRS                            31303680
VERSION_RESOURCE               RITRS                            18227200
REQUIREMENT_STRING_PROP        RITRS                            18143232
Test environment and data
In these tests, we use a single test deployment of the Engineering Lifecycle management applications, and index that deploying using LQE rs (both DB2 and Oracle), as well as indexing with the Jena-based LQE. This allows for comparison of reports (both performance and content) across the 3 LQEs. The deployment topology is shown below: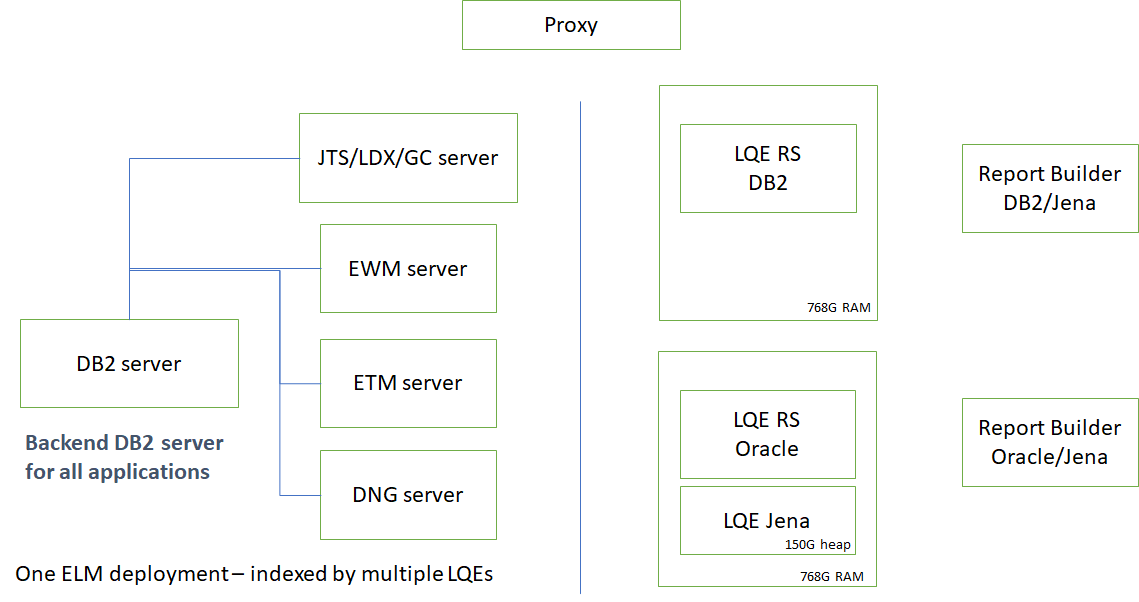 The servers in the topology are all physical servers. The hardware specifications are listed below.
| Role | Server | Machine type | Processor | Total processors | Memory | Storage | OS and version |
|---|---|---|---|---|---|---|---|
| Proxy Server | IBM HTTP Server and WebSphere Plugin | IBM System x3550 M3 | 2 x Intel Xeon X5667 3.07 GHz (quad-core) | 16 | 16 GB | RAID 5 279GB SAS Disk x 2 | RHEL 7 |
| DNG | WebSphere Liberty | IBM System x3550 M4 | 2 x Intel Xeon E5-2640 2.5GHz (six-core) | 24 | 64 GB | RAID 5 279GB SAS Disk x 4 | RHEL 7 |
| JTS/GC/LDX | WebSphere Liberty | IBM System x3550 M4 | 2 x Intel Xeon E5-2640 2.5GHz (six-core) | 24 | 32 GB | RAID 5 279GB SAS Disk x 4 | RHEL 7 |
| ETM | WebSphere Liberty | IBM System x3550 M4 | 2 x Intel Xeon E5-2640 2.5GHz (six-core) | 24 | 32 GB | RAID 5 279GB SAS Disk x 4 | RHEL 7 |
| EWM | WebSphere Liberty | IBM System x3550 M4 | 2 x Intel Xeon E5-2640 2.5GHz (six-core) | 24 | 32 GB | RAID 5 279GB SAS Disk x 4 | RHEL 7 |
| LQE rs Oracle/Jena | Oracle 19c | IBM System SR650 | 2 x Xeon Silver 4114 10C 2.2GHz (ten-core) | 40 | 768 GB | RAID 10 900GB SAS Disk x 16 | RHEL 7 |
| LQE rs DB2 | DB2 11.5 | IBM System SR650 | 2 x Xeon Silver 4114 10C 2.2GHz (ten-core) | 40 | 768 GB | RAID 10 900GB SAS Disk x 16 | RHEL 7 |
| Report Builder - DB2 | WebSphere Liberty | IBM System x3550 M4 | 2 x Intel Xeon E5-2640 2.5GHz (six-core) | 24 | 64 GB | RAID 5 279GB SAS Disk x 4 | RHEL 7 |
| Report Builder - Oracle | WebSphere Liberty | IBM System x3550 M4 | 2 x Intel Xeon E5-2640 2.5GHz (six-core) | 24 | 64 GB | RAID 5 279GB SAS Disk x 4 | RHEL 7 |
Abbreviations:
- JTS = Jazz Team Server
- GC = Global configuration application
- LDX = Link index provider
- DNG = DOORS Next Generation
- EWM = Engineering Workflow Management
- ETM = Engineering Test Management
- LQE rs = Lifecycle Query Engine - Relational Store
- RHEL = Red hat Enterprise Linux
Test data
The test deployment includes the following kinds of artifacts:- DOORS Next: 10 million requirements and 60 million links. 5 million links have link validity.
- EWM: 2 million work items
- ETM: 5 million total test artifacts
- Global configurations: 1000 total components
- Jena LQE: 1320 G
- LQE rs Oracle: 698G
- LQE rs DB2: 665G
Related topics: Deployment web home, Deployment web home
External links:
Additional contributors: TWikiUser, TWikiUser


| I | Attachment | Action | Size | Date | Who | Comment |
|---|---|---|---|---|---|---|
| |
DB2Results.png | manage | 60.3 K | 2023-03-22 - 21:08 | VaughnRokosz | |
| |
Jena.png | manage | 29.6 K | 2023-03-21 - 16:53 | VaughnRokosz | |
| |
OracleBCache.png | manage | 158.0 K | 2023-03-20 - 18:15 | VaughnRokosz | |
| |
OracleIO.png | manage | 64.7 K | 2023-03-20 - 18:14 | VaughnRokosz | |
| |
OracleResults.png | manage | 70.4 K | 2023-03-22 - 20:25 | VaughnRokosz | |
| |
RDB.png | manage | 112.0 K | 2023-08-01 - 18:30 | VaughnRokosz | |
| |
RDB_v2.png | manage | 112.0 K | 2023-08-01 - 18:32 | VaughnRokosz | |
| |
SideBySide.png | manage | 74.4 K | 2023-03-21 - 16:53 | VaughnRokosz | |
| |
SideBySide_v2.png | manage | 189.1 K | 2023-08-01 - 18:36 | VaughnRokosz | |
| |
Topology.png | manage | 25.7 K | 2023-03-20 - 18:14 | VaughnRokosz |
Contributions are governed by our Terms of Use. Please read the following disclaimer.
Dashboards and work items are no longer publicly available, so some links may be invalid. We now provide similar information through other means. Learn more here.