![]() How do I determine if my network is contributing to my performance degradation?
How do I determine if my network is contributing to my performance degradation?
Authors: StephanieBagot Build basis: CLM 4.x and later
This page will help users determine if network latency is causing the performance degradation with Rational Collaborative Lifecycle Management (CLM) applications.
This assessment assumes that you have exhausted and ruled out all investigation between the application and server software, and believe that the issue might be related to the network. At this point, your network administrator should be involved.
Before you conclude that this issue might be related to the network, review the How to Start a Troubleshooting Assessment to assess where the performance issue might reside.
Important questions in the assessment will help you determine where the problem resides. For example, if you determine that all users in Building A have the problem, but no one in Building B has the problem, then this might be related to the network configuration in Building A. Alternatively, if the issue happens for User X, and User Y is sitting next to user X does not have the same issue, this might not be related to the network but is more likely a configuration issue with User X. Another important step in determining if the performance degradation is related to a network is to find out if your organization monitors the network and if you can obtain that data. Often a slowdown in Jazz Team Server performance can be traced to a general network slowdown. Being able to access the network performance data will help you determine if the network is having an adverse impact on your performance. Accessing network data will also help you eliminate network issues when troubleshooting problems.
http://www.webpagetest.org/ (tests from USA (VA,CA), UK, China, and New Zealand)
http://www.thumbalizr.com/ (from Germany)
http://www.websnapr.com/ (USA)
The transport layer concerns the actual transport of the data. This would involve looking at the overall communication of the network. Wireshark, or TCPDump are tools you would want to use at this stage. They will look at the time the packets were sent, source and destination IP, protocol, length and info of the packet. By gathering this data (your network administrator might already be collecting some network monitoring information) you can determine if there are any out-of-the-ordinary communication issues on the network.
In the sample below, the source and destination IP addresses were removed, as well as some of the information concerning name queries.
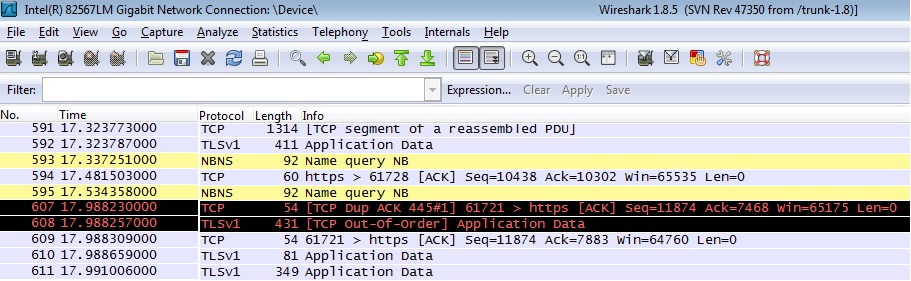
In this sample, there are some NBNS packets, essentially DNS queries for machines. Highlighted in black (default in Wireshark) will show two packets:
TCP DUP ACK: This packet occurs when the same ACK number is seen and it is lower than the last byte of data sent by the sender. If there are numerous occurrences of these types of packets, there is a clear indication of dropped or missing packets in the network, which might be contributing to the performance degradation.
TCP Out of Order: This packet occurs when a frame was received in a different order than which it was sent. Excessive numbers of these types of packets can simply mean there are multiple paths between source and destination, but cause slightly more load as TCP needs to reassemble the packets in the right order. These errors might also be an indication of a network appliance malfunctioning such as a load balancer not functioning as intended.
Further examples of packet information can be found on the Wireshark help Contents.
| Note: This information should only be used as a reference. Any network troubleshooting should be completed with the assistance of your network administrator. Any tools used to diagnose network issues might come at a cost with regards to performance. |
How do I determine if my network has a problem?
Most CLM deployments are not contained on a single machine nor is it typically recommended. We often see multiple servers involved which need to be able to effectively communicate between each other, and if they can not, performance degradation may occur.Initial assessment
| This page discusses some basic networking concepts, but does not intend to be a comprehensive or in-depth document. Your network administrator should be involved in any network troubleshooting. |
Important questions in the assessment will help you determine where the problem resides. For example, if you determine that all users in Building A have the problem, but no one in Building B has the problem, then this might be related to the network configuration in Building A. Alternatively, if the issue happens for User X, and User Y is sitting next to user X does not have the same issue, this might not be related to the network but is more likely a configuration issue with User X. Another important step in determining if the performance degradation is related to a network is to find out if your organization monitors the network and if you can obtain that data. Often a slowdown in Jazz Team Server performance can be traced to a general network slowdown. Being able to access the network performance data will help you determine if the network is having an adverse impact on your performance. Accessing network data will also help you eliminate network issues when troubleshooting problems.
Recommended data gathering and subsequent analysis steps
The topics below will discuss possible data gathering and areas to analyze when troubleshooting a performance issue which you believe is related to the network.| Note: This information should only be used as a reference. Any network troubleshooting should be completed with the assistance of your network administrator. Any tools used to diagnose network issues might come at a cost with regards to performance. |
Deployment
If there are firewalls, proxy servers or load balancers in between the target nodes, be sure to- Examine their configuration files and log files; and
- Have an alternate method to navigate all paths in question via another means, such as spoofing/masquerading an IP address (including port number).
- Have someone else test the connection, and if successful, compare the traceroute paths.
- Try to narrow down the problem by getting on another server that is within the same zone/company/network as the target host, and reattempt the same access method.
http://www.webpagetest.org/ (tests from USA (VA,CA), UK, China, and New Zealand)
http://www.thumbalizr.com/ (from Germany)
http://www.websnapr.com/ (USA)
TCP/IP Stack
This article follows Network troubleshooting through the TCP/IP Stack, which is a model of communication protocols that provide end-to-end connectivity.| TCP/IP Model | Protocols | Investigation |
|---|---|---|
| Application | SSH, HTTP, FTP, etc | HTTPwatch, Firebug, SpeedTracer |
| Transport | TCP, UDP, etc | Wireshark |
| Internet | IP, ICMP, etc | Ping, tracert |
| Network Interface | ARP, OSPF, etc | Checking cables |
Application layer
Identify the performance degradation at the application level of the TCP/IP model from a web browser or Eclipse client while using a CLM application. You can further analyze the HTTP requests through HTTPWatch. As discussed in How to Use HTTPWatch, you will be able to see each request and perform a browser comparison (see the Browser Performance page) to investigate whether the browser is the root cause of the performance and not the network. Once browser and configuration are ruled out, you can move down to the next layer of the TCP/IP Model.Transport layer
| Network troubleshooting at the transport layer should not be completed unless you are familiar with networking concepts. Do not attempt to complete any further investigation without engaging your network administrator. |
In this sample, there are some NBNS packets, essentially DNS queries for machines. Highlighted in black (default in Wireshark) will show two packets:
TCP DUP ACK: This packet occurs when the same ACK number is seen and it is lower than the last byte of data sent by the sender. If there are numerous occurrences of these types of packets, there is a clear indication of dropped or missing packets in the network, which might be contributing to the performance degradation.
TCP Out of Order: This packet occurs when a frame was received in a different order than which it was sent. Excessive numbers of these types of packets can simply mean there are multiple paths between source and destination, but cause slightly more load as TCP needs to reassemble the packets in the right order. These errors might also be an indication of a network appliance malfunctioning such as a load balancer not functioning as intended.
Further examples of packet information can be found on the Wireshark help Contents.
Internet layer
After analyzing the Wireshark output, you can complete further investigation into the network appliances, which is done at the Internet level. For example, if you see multiple TCP DUP ACK messages (as indicated above) look at the source IP to determine a network appliance (such as a load balancer or router) that might be dropping packets. This type of investigation might include reviewing the appliance logs and engaging your network administrator for assistance in coming to a resolution. Additional investigation could involve running simple pings or tracert between machines to determine if the response time is abnormally slow or if packets are getting lost or dropped during the communication. You can also increase the ping size and frequency to test network load without involving packets from applications. For more information on ping and traceroute, see the following articles:- Ping - Windows, Linux
- Traceroute - Linux, Windows (tracert)
Network layer
The last layer of investigation is the network layer. If you have seen lost or dropped packets and cannot determine the root cause, your network administrator can check the cabling of the appliances to ensure that connectivity exists.Possible causes and solutions
There are many possible causes and solutions to list here that occur within a network and affect CLM application performance. Each depends on your individual network configuration, network appliances, load, bandwidth and other considerations that need to be understood from an internal perspective. Engaging your network administrator to determine cause and solution is the ideal approach once a performance issue has been deemed to be related to the network.IPv4 vs. IPv6
In some environments, the network is using IPv6 while clients are using IPv4. The fallback time from IPv6 to IPv4 for Windows and some Linux platforms is 21 seconds. During these 21 seconds, the client sends three SYNs and switches to IPv4 after receiving ICMPv6 error responses. This translation between the two protocols can cause some performance degradation. With respect to the CLM environment, this protocol mismatch can cause blocked and hanging threads within the JVM as it performs the IPv6 lookup. To mitigate this behaviour, the JVM can be forced to use IPv4 as per: technote 1170467 - Slow performance or hang in Hostname lookup due to high DNS traffic.Related topics:
- Still need help troubleshooting your performance issue? See Performance Troubleshooting for additional topics.
External links:
- None
Additional contributors: None
Contributions are governed by our Terms of Use. Please read the following disclaimer.
Dashboards and work items are no longer publicly available, so some links may be invalid. We now provide similar information through other means. Learn more here.