This analysis page will provide some instruction to using HTTPWatch in an effort to compare browser performance between Internet Explorer and Firefox.
This will ensure that you are not loading pages from cache and the load times are accurate. 2. Start HTTPWatch by right clicking on the page and selecting 'HTTPWatch' such as 'HTTPWatch Basic'.
3. Click Record.
4. Load the web page.
This can be done by refreshing the page (if you are currently on it) or navigating to the page manually. This will cause multiple entries to be added to the output in the bottom half of your browser.
Below is a sample of a typical HTTPWatch output from both Firefox and Internet Explorer when loading www.ibm.com:
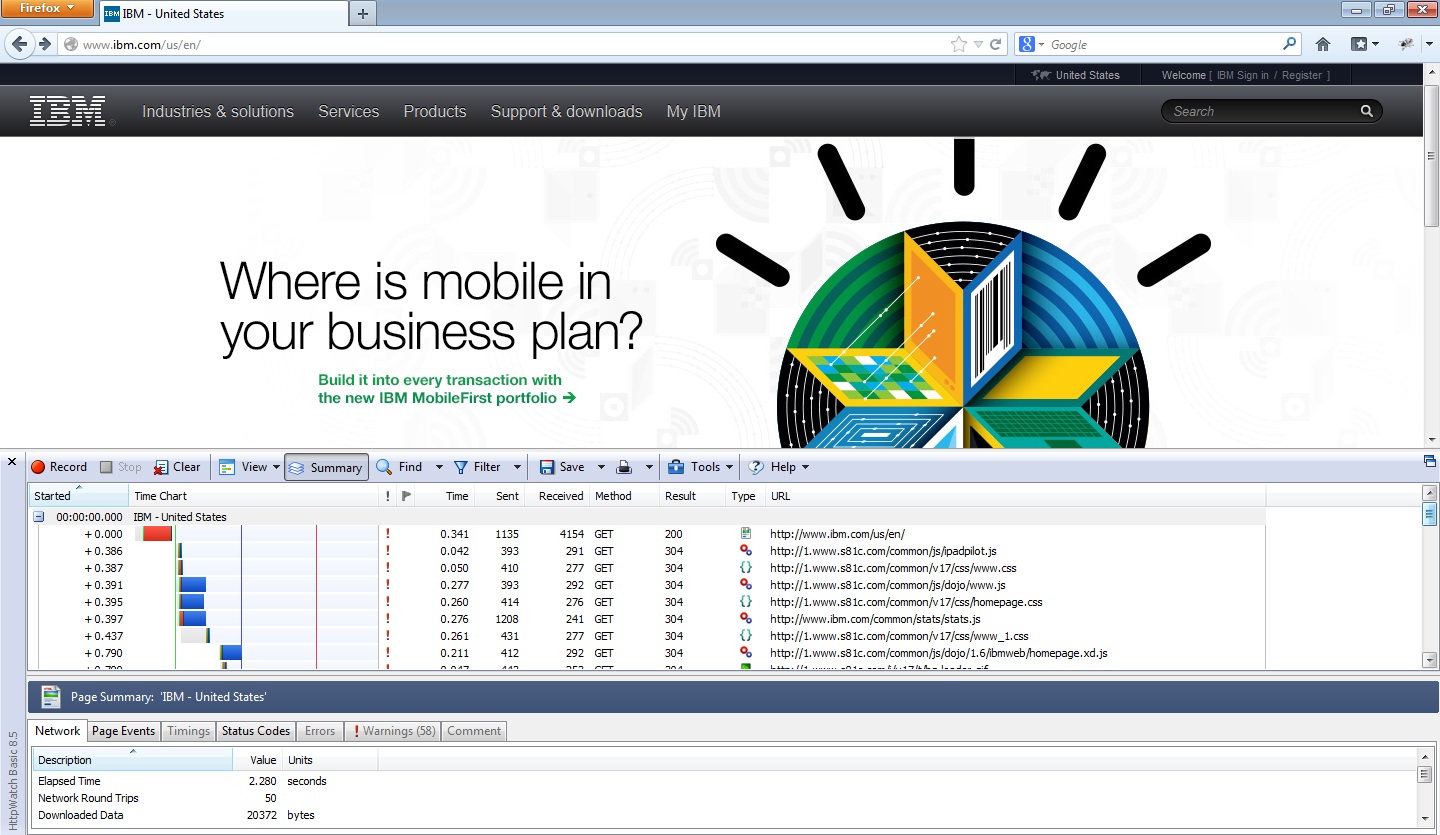
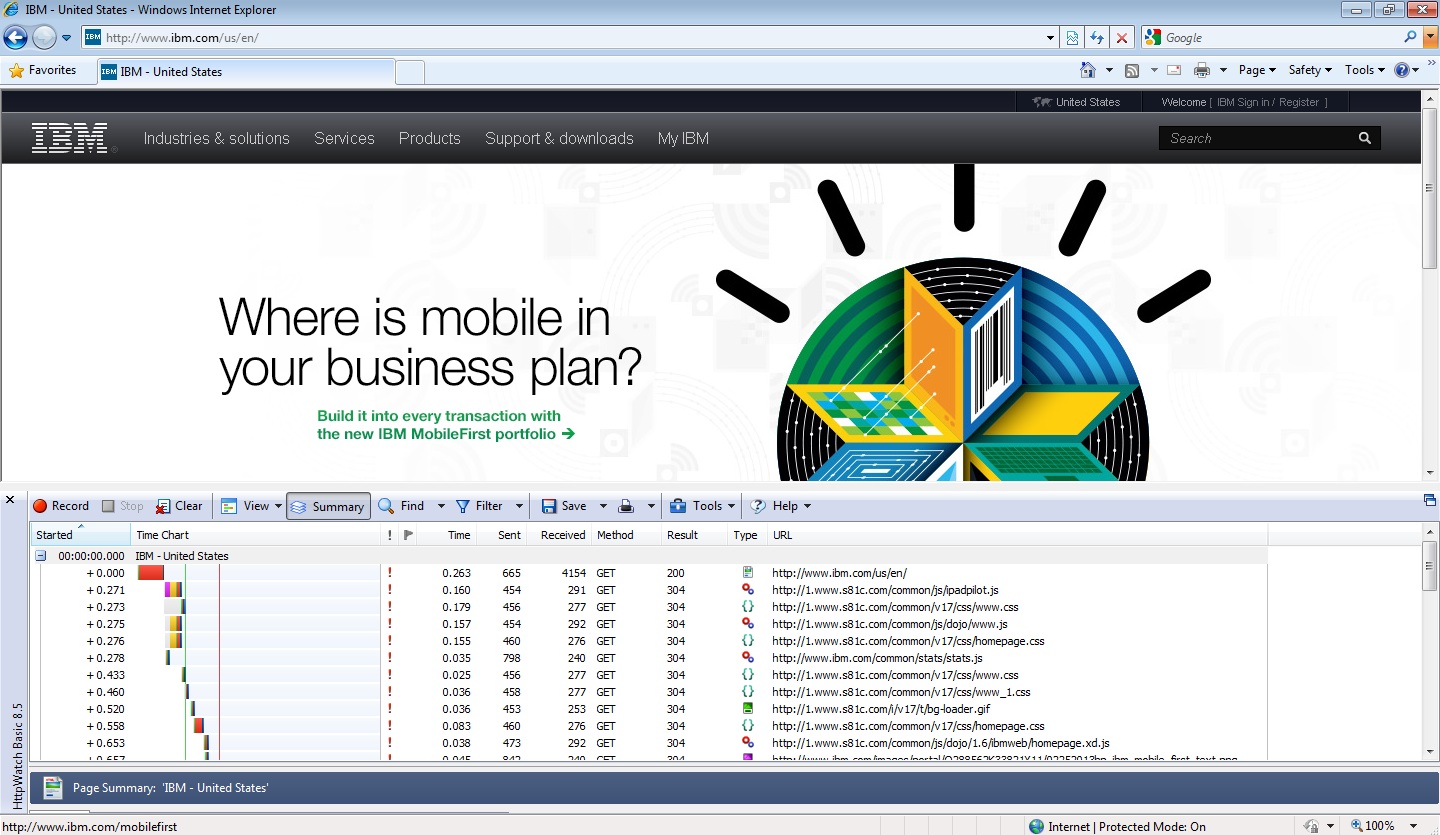
The columns which will be particularly useful in performance measurement are Time, Method, Result, Type, and URL. Below is a sample from the attached document that we will use to analyze the output.
It may be useful to compare multiple HTTPWatch outputs over time from multiple users and/or browsers to get an overall picture of the performance in the environment. Keep in mind when comparing HTTPWatch outputs that there are many additional factors which may come into play resulting in the slow performance, some of which cannot be controlled (ie. different environments and configurations).
One possible solution would be to consider additional caching through a proxy. Keep in mind that the content type alone is not a good way to make a decision about caching, since the cachability of an HTTP response is defined by it's cache control headers, not the content type. Caching and proxy deployment should be a discussion with your Network Administrator and is beyond the scope of this wiki.
NOTE: The CLM applications have been optimized to load certain URLs and calls faster in more recent versions, so it is important to keep in mind if running HTTPWatch on older application versions that the performance may have increased on a newer release. Proper testing and analysis should be completed before upgrading a production to a newer version.
HTTPWatch
HTTPWatch allows one to inspect and monitor CSS, HTML, JavaScript and Net requests in any web page. One particularly useful aspect of the tool for performance investigation is its ability to be installed in both Internet Explorer and Firefox. In our Browser Performance example, we used the HTTPWatch output from both browsers to compare overall browser performance with a variety of user functions. Similar tools for Chrome include Chrome Developer Tools, Speed Tracer or Fiddler but may not have the same exact capabilities.How to use HTTPWatch
HTTPWatch must be downloaded and installed into your browser. Follow the instructions on the HTTPWatch Download site for details. For complete instructions on using HTTPWatch, navigate to the HTTPWatch Help Documentation. Below are some basic instructions for using HTTPWatch. 1. Clear your Browser Cache (CTRL-SHIFT-DEL in both Firefox and Internet Explorer).This will ensure that you are not loading pages from cache and the load times are accurate. 2. Start HTTPWatch by right clicking on the page and selecting 'HTTPWatch
This can be done by refreshing the page (if you are currently on it) or navigating to the page manually. This will cause multiple entries to be added to the output in the bottom half of your browser.
Saving HTTPWatch output
The HTTPWatch output can be reviewed within the console in your browser, or can be saved and exported. For comparison purposes, it is useful to export as a CSV.Below is a sample of a typical HTTPWatch output from both Firefox and Internet Explorer when loading www.ibm.com:
Analyzing HTTPWatch output
HTTPWatch output will show multiple columns: Started, Page Title, Warnings, Comment, Time, Sent, Received, Method, Result, Type, URL.The columns which will be particularly useful in performance measurement are Time, Method, Result, Type, and URL. Below is a sample from the attached document that we will use to analyze the output.
It may be useful to compare multiple HTTPWatch outputs over time from multiple users and/or browsers to get an overall picture of the performance in the environment. Keep in mind when comparing HTTPWatch outputs that there are many additional factors which may come into play resulting in the slow performance, some of which cannot be controlled (ie. different environments and configurations).
What to do next?
Once you have analyzed/compared and contrasted the HTTPWatch output, the information will help you to determine if the cause of the preformance degradation is related to the client browser (ie. when comparing browsers) or related to the user machine (ie. comparing different user outputs), or even if the overall server performance is not optimal. At this point, some of the information may only be for reference.One possible solution would be to consider additional caching through a proxy. Keep in mind that the content type alone is not a good way to make a decision about caching, since the cachability of an HTTP response is defined by it's cache control headers, not the content type. Caching and proxy deployment should be a discussion with your Network Administrator and is beyond the scope of this wiki.
NOTE: The CLM applications have been optimized to load certain URLs and calls faster in more recent versions, so it is important to keep in mind if running HTTPWatch on older application versions that the performance may have increased on a newer release. Proper testing and analysis should be completed before upgrading a production to a newer version.
Related topics:
- Still need help troubleshooting your performance issue? Refer to Performance Troubleshooting for additional topics.
External links:
Additional contributors: None
Contributions are governed by our Terms of Use. Please read the following disclaimer.
Dashboards and work items are no longer publicly available, so some links may be invalid. We now provide similar information through other means. Learn more here.