Introduction
This article provides the large scale performance report of IBM Engineering Test Management
(ETM) 7.0.1. In this report, we will compare the performance of an extra large ETM component impacted by the repository size, and the ETM performance impacted by the component size in the same repository, repectively. The performance load is focused on a wide range of user operations in the
streams (for instance, viewing, searching, adding, and modifying a test artifact), incorporating a small portion of basic user navigations for
baselines. The repository under test is comprised of
15 million versioned test artifacts 1 in 11 components migrated from ETM 6.0.6, out of which one single extra large-sized component contains 10 million test artifacts, while the remaining test artifacts are evenly spead across 10 smaller components. During the migration process, The ETM database was partitioned for scalability (refer to
upgrade guide,
release new and noteworthy, and
the knowledge centerfor details for partitioning).
1: versioned test artifact counts are based on the
data generation utility which collects the sum from each artifact type visible in the UI.
Changes to the 7.0.1 ETM performance test
- Topology: replaced the IBM WebSphere Application Servers with Embedded WebSphere Liberty Servers, replaced IBM DB2 Server with Oracle
- Datashape: added multiple ETM components to the same project area, mixed different component sizes
- Repository size: increased the total count of versioned test artifacts to 15 million
The test in this report does not cover the evaluation of performance under Global Configuration, nor capacity/scalability with regard to increasing the number of streams or baselines for any given ETM component. The integration scenarios including cross-product links are not tested in this release.
While the report provides a
Summary of results, detailed information is covered in various sections. Use the
page content menu on the upper-right section of the report to navigate. We may provide raw results upon requests.
Disclaimer
The information in this document is distributed AS IS. The use of this information or the implementation of any of these techniques is a customer responsibility and depends on the customers ability to evaluate and integrate them into the customers operational environment. While each item may have been reviewed by IBM for accuracy in a specific situation, there is no guarantee that the same or similar results will be obtained elsewhere. Customers attempting to adapt these techniques to their own environments do so at their own risk. Any pointers in this publication to external Web sites are provided for convenience only and do not in any manner serve as an endorsement of these Web sites. Any performance data contained in this document was determined in a controlled environment, and therefore, the results that may be obtained in other operating environments may vary significantly. Users of this document should verify the applicable data for their specific environment.
Performance is based on measurements and projections using standard IBM benchmarks in a controlled environment. The actual throughput or performance that any user will experience will vary depending upon many factors, including considerations such as the amount of multi-programming in the users job stream, the I/O configuration, the storage configuration, and the workload processed. Therefore, no assurance can be given that an individual user will achieve results similar to those stated here.
This testing was done as a way to compare and characterize the differences in performance between different versions of the product. The results shown here should thus be looked at as a comparison of the contrasting performance between different versions, and not as an absolute benchmark of performance.
Summary of results
On top of the product scalablity improvement, we applied additional optimization by taking the adventage of database optimization approaches (refer to section
Test load based tunings for details), given the unique design of the load, which is keyword searching and sorting intensive throughout the scenarios. With them, the concurrency load was carried smoothly and maintained stable during of the entire course of testing. We observed the following performance characteristics
- When we increased the size of the repository from 10 million 2 to 15 million total number of versioned test artifacts, or by 50%, for the same extra large-sized component:
- The general performance only slightly degrades, with an average response time for all pages increased by 20% approximately.
- 15 out of 128, or 11.7%, of the pages under test have an increase of at least 1 second, but no more than 3 seconds, with this level of repository size growth.
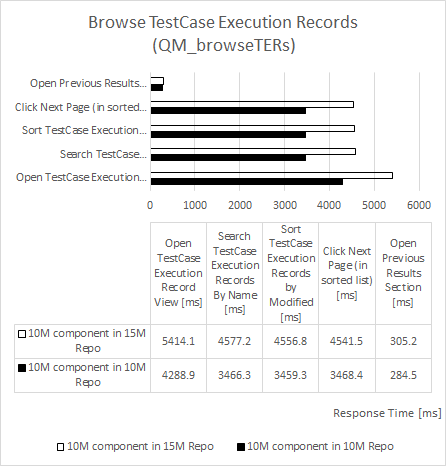
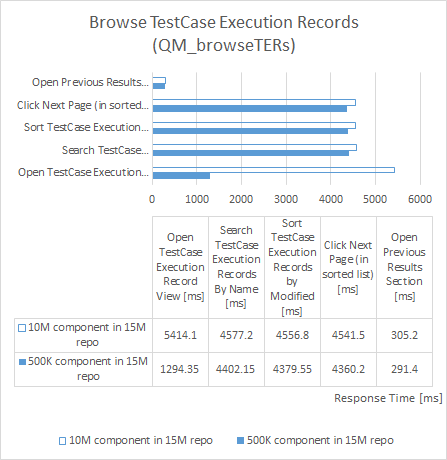
- The top 15 pages with the most increases in response time include various read operations in a stream, such as Browse Test Case Results, Browse Test Case Execution Records, and pages to search/filter a type of test artifact, due to the largest test artifact counts for these pages, as shown in chart below. Amongst them, many of the searchTestArtifact pages have a chance to be more optimal if they had been tuned via SQL profiling approach outlined in Test load based tunings.
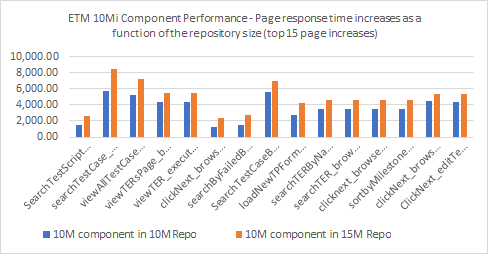
.
- The server resource utilizations are barely increased: the CPU utilizations on all servers are still low, disk %busy on ETM WebSphere Liberty Server remains moderate. We noticed the Oracle disk busyness is about the same during the run phase regardless of repository size, with an average of 88% which includes handling multiple background tasks by the server post migration. These background tasks are estimated to introduce 60% extra disk utilizations.
- For the page-by-page performance result for each test scenario, see this section: Detailed performance results.
- 2: the 10 million -repository performance number is based on ETM 7.0 GA data; however we estimated that the performance impact between ETM 7.0 and 7.0.1 is minimal.
- When we compared the performance of a much smaller component (size of 500 thousand versioned test artifacts) versus the extra large component (size of 10 million versioned test artifacts):
- The result shows the average response time for all pages have increased as the component size increases.
- 28 out of 128, or 22.8%, of the pages under test have an increase of at least 1 second, with the component size grows 20 times bigger; 9 pages have increased more than 3 seconds.
- The larger counts in an artifact view, especially in baselines, the more impact is by the flat growth of their component size, which can be seen from the list below showing top pages that are mostly sensitive to the component size increase:

- The server resource utilizations are the same or slightly increased.
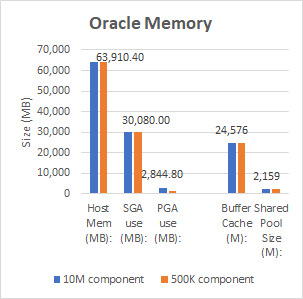
Automatic memory management (AMM) is enabled on Oracle server. For more details about the system resource including memory statistics of the Oracle database, please see section
Resource utilization and
performance tunings of the test systems.
Topology, network, and data volume
Data volume and shape
- ETM Database size on disk ~ 775 GB
Versioned test artifacts distribution by components
The test artifacts were created by the in-house datagen utility. For the large scale repository under test in this report, we created total of
15 million test artifacts that are spread out across one large and 10 smaller components, and for each of the component size the test artifact counts are distributed as below:
versioned test artifact counts by component size:
| Counts |
Extra large component |
Smaller component |
| test plans |
1,681 |
50 |
| test cases |
1,000,207 |
30,000 |
| test scripts |
1,000,209 |
30,000 |
| test suites |
100,020 |
3,000 |
| test case execution records |
4,000,800 |
120,000 |
| test case results |
4,000,921 |
360,000 |
| test suite results |
500,100 |
15,000 |
| test execution schedules |
47,467 |
1,424 |
| test phases and test environments |
31,636 |
800 |
| build definitions and build records |
33,533 |
1,006 |
| total |
10,716,574 |
561,280 |
The test artifact maintains the following associations:
- each test plan is linked to 600 unique test cases, and 600 unique test scripts
- each test suite contains 15 test cases in smaller-sized component, and 500 test cases in the extra large component, respectively
Streams and baselines
The initial component, which is the target for the automation test load, contains two streams and two baselines. The smaller component under test has one initial stream and one baseline created.
EWM artifacts in the applications
There are 5,000 work items (defects) in the EWM project area.
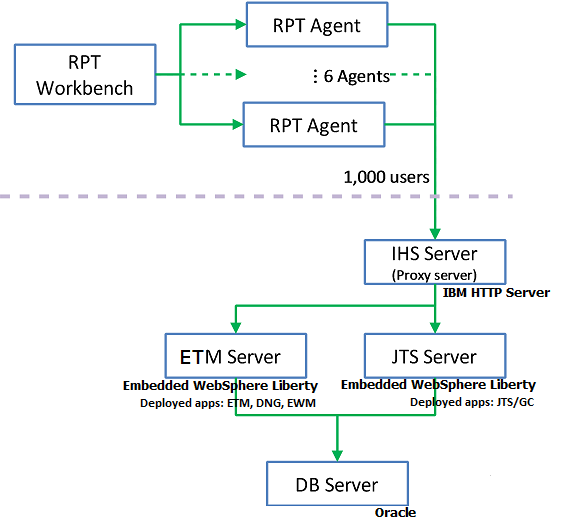
Topology and network
The topology under test is based on Distributed / Linux / Database Server:
The specifications of machines under test are listed in the table below. Server tuning details listed in
Appendix - Key configuration parameters
| Function |
Number of Machines |
Machine Type |
CPU / Machine |
Total # of CPU vCores/Machine |
Memory/Machine |
Disk |
Disk capacity |
Network interface |
OS and Version |
| Proxy Server (IBM HTTP Server and WebSphere Plugin) |
1 |
IBM System x3250 M4 |
1 x Intel Xeon E3-1240 3.4GHz (quad-core) |
8 |
16GB |
RAID 1 -- SAS Disk x 2 |
299GB |
Gigabit Ethernet |
Red Hat Enterprise Linux Server release 6.5 |
| JTS Server |
1 |
IBM System x3550 M4 |
2 x Intel Xeon E5-2640 2.5GHz (six-core) |
24 |
32GB |
RAID 5 -- SAS Disk x 2 |
897GB |
Gigabit Ethernet |
Red Hat Enterprise Linux Server release 6.5 |
| ETM Server |
1 |
IBM System x3550 M4 |
2 x Intel Xeon E5-2640 2.5GHz (six-core) |
24 |
32GB |
RAID 5 -- SAS Disk x 2 |
897GB |
Gigabit Ethernet |
Red Hat Enterprise Linux Server release 6.5 |
| Database Server |
1 |
IBM System x3650 M4 |
2 x Intel Xeon E5-2640 2.5GHz (six-core) |
40 |
64GB |
RAID 10 279GB SAS Disk x 16 |
4TB |
Gigabit Ethernet |
Red Hat Enterprise Linux Server 7 (Maipo) |
| RPT workbench |
1 |
IBM System x3550 M4 |
2 x Intel Xeon E5-2640 2.5GHz (six-core) |
24 |
32GB |
RAID 5 -- SAS Disk x 2 |
897GB |
Gigabit Ethernet |
Red Hat Enterprise Linux Server release 6.4 |
| RPT Agents |
6 |
VM image |
4 x Intel Xeon X5650 CPU (1-Core 2.67GHz) |
1 |
2GB |
N/A |
30GB |
Gigabit Ethernet |
Red Hat Enterprise Linux Server release 6.5 |
| Network switches |
N/A |
Cisco 2960G-24TC-L |
N/A |
N/A |
N/A |
N/A |
N/A |
Gigabit Ethernet |
24 Ethernet 10/100/1000 ports |
N/A: Not applicable.
vCores = Cores with hyperthreading
Network connectivity
All server machines and test clients are located on the same subnet. The LAN has 1000 Mbps of maximum bandwidth and less than 0.3 ms latency in ping.
Performance load
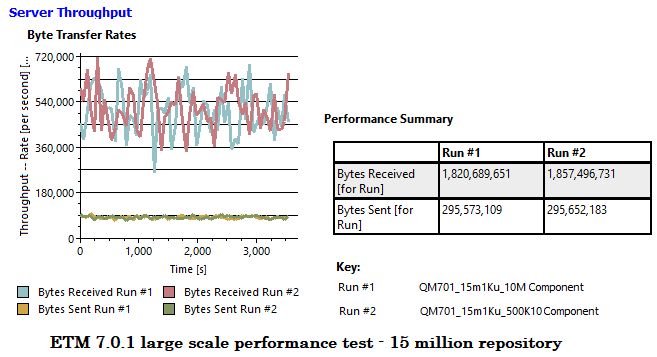
1000 virtual users are executing test scenarios against ETM servers concurrently for one hour, generating a consistent throughput (the page hit rate), of
8.2 pages per second, as shown in the picture below. During the concurrency load, we evaluated page loading for more than 100 individual pages by collecting their page response times (the smaller page response time, the better performance) and server statistics metric.

Rational Performance Tester (RPT) is used to simulate this load created using the web client. Each virtual user completes a random use case from a set of
available use cases. Each use case is implemented as a RPT script; and these RPT scripts are organized by pages representing user actions.
The performance work load is role based as each of the areas defined under sequence of actions which are separated into individual user groups within an RPT schedule, see
User roles, test cases and workload characterization for detailed description for each test scenario.
User roles, test cases and workload characterization
a. User Roles
| Configuration |
Use role |
% of Total |
Related Actions |
| Stream |
|
98 |
|
|
QE Manager |
8 |
Create test plan, browse test plan and test case, browse test script, simple test plan copy, search defect, view dashboard. |
|
Test Lead |
19 |
Edit test environments, edit test plan, create test case, bulk edit of test cases, browse test script, test execution, search defect. |
|
Tester |
66 |
Create defect, modify defect, search defect, edit test case, create test script, edit test script, test execution, browse test execution record. |
|
Dashboard Viewer |
5 |
View dashboard, with login and logout. |
| Baseline |
|
2 |
|
|
Baseline Viewer |
2 |
Browse test case, or test plan, or test case execution record in baseline. |
b. Test Cases
| Use Role |
Percentage of the user role |
Sequence of Operations |
| QE Manager |
1 |
Create test plan: user creates a test plan, adds description, business objectives, test objectives, two test schedules, test estimate, quality objectives, and entry and exit criteria. |
| 26 |
Browse test plans and test cases: user lists all test plans, types a keyword in the name filter, opens a test plan found, reviews various sections, and closes the test plan. |
| 26 |
Browse test script: user searches for a test script by name, opens, and reviews the contents. |
| 1 |
Simple test plan copy: user searches a test plan by name, makes a copy. |
| 23 |
Search defect: user searches for a specific defect by number, reviews the defect. |
| 20 |
Refresh dashboard: user views dashboard |
| Test Lead |
8 |
Edit test environment: user lists all test environments, selects a test environments, modifies the description and saves the change. |
| 15 |
Edit test plan: user lists all test plans, opens a test plan for editing, adds a test case to the test plan, modifies a few other sections of the test plan, saves the changes. |
| 4 |
Create test case: user opens page Create Test Case, enters data for a new test case, and saves the new test case. |
| 1 |
Bulk edit of test cases: user searches for test cases with root name and edits all found with owner change. |
| 32 |
Browse test script: user searches for a test script by name, opens and reviews the contents, and closes the test script. |
| 26 |
Test Execution: user searches a test case execution record by name, selects the test case execution record, starts execution, enters pass/fail verdict, reviews results, sets points then saves. |
| 11 |
Search defect: user searches for a specific defect by number, user reviews the defect, and closes. |
| Tester |
8 |
Create defect: user opens the Create Defect page, enters data for a new defect, and saves the defect. |
| 5 |
Modify defect: user searches for a specific defect by number, modifies and saves the defect. |
| 14 |
Search defect: user searches for a specific defect by number, user reviews the defect and closes. |
| 6 |
Edit test case: user searches a test case by name, opens the test case, adds a test script to the test case (user clicks next a few times (server size paging feature) before selecting test script), and saves the test case. |
| 4 |
Create test script: user opens Create Test Script page, enters data for a new test script, and saves the test script. |
| 8 |
Edit test script: user searches a test script by name, opens a test script, modifies and saves the test script. |
| 42 |
Test Execution: user searches a test case execution record by name, selects and starts execution, enters pass/fail verdict, reviews results, sets points then saves. |
| 7 |
Browse test execution record: user searches a test case execution record by name, opens the most recent results. |
| Dashboard Viewer |
100 |
View dashboard(with login and logout): user logs in, views dashboard, and logs out. |
| Baseline Viewer |
34 |
Browse test script in baseline: user switches to a baseline, browse test scripts, and opens a test script from the list. |
| 33 |
Browse test case execution record in baseline: user switches to a baseline, selects browse test case execution records, opens one of them from the list. |
| 33 |
Browse test plans and test cases in baseline: user switches to a baseline, lists all test plans, types a keyword in the name filter, opens a test plan found, reviews various sections, and closes the test plan. |
Response time comparison
The page performance is measured as mean value (or average) of its response time in the result data. For the majority of the pages under tests, there is little variation between runs, and the mean values are close to median in the sample for the load.
Detailed performance results
Average page response time breakdown
NOTE
For all charts, each column represents the time for page loading (or page response time) in milliseconds, for which value smaller is better.
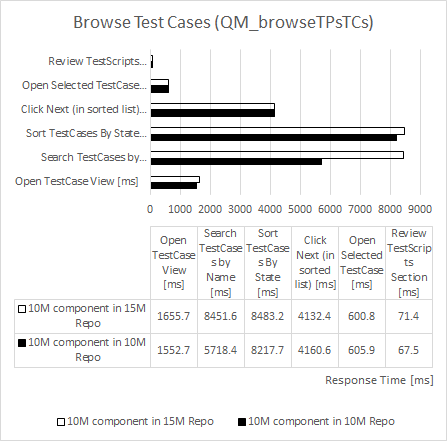
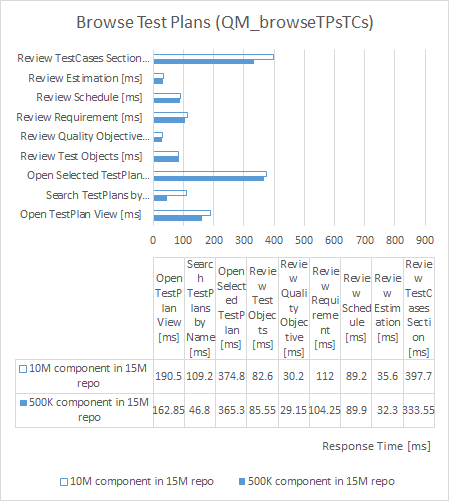
Browse Test Plans & Test Cases
Back to Test Cases & workload characterization
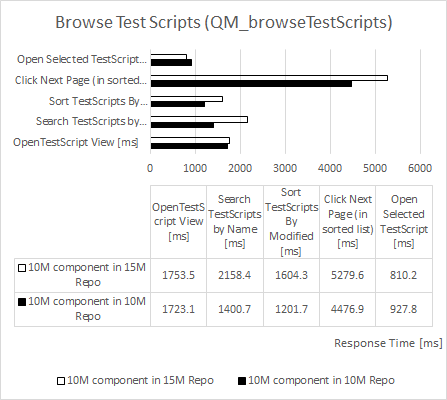
Browse Test Scripts
| repository size increased by 50% |
component size increased by 2,000% |
 |
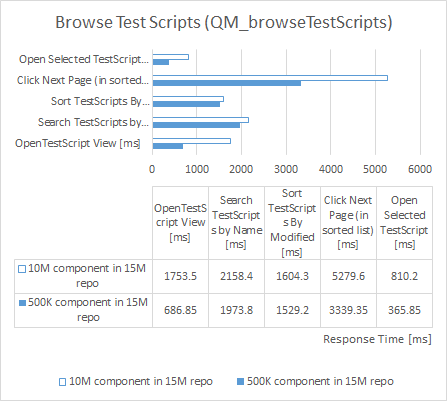 |
Back to Test Cases & workload characterization
Test Execution Record Browsing
| repository size increased by 50% |
component size increased by 2,000% |
 |
 |
Back to Test Cases & workload characterization
Create Defect
| repository size increased by 50% |
component size increased by 2,000% |
 |
 |
Back to Test Cases & workload characterization
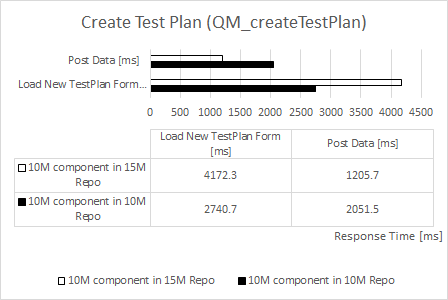
Create Test Plan
| repository size increased by 50% |
component size increased by 2,000% |
 |
 |
Back to Test Cases & workload characterization
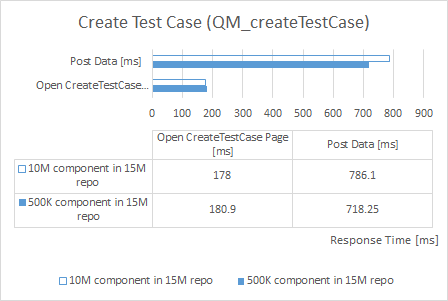
Create Test Case
| repository size increased by 50% |
component size increased by 2,000% |
 |
 |
Back to Test Cases & workload characterization
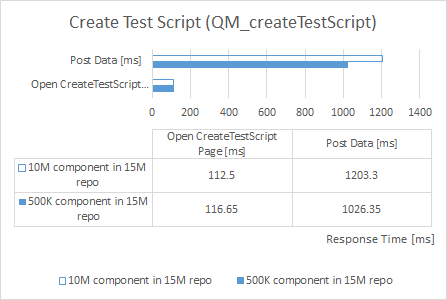
Create Test Script
| repository size increased by 50% |
component size increased by 2,000% |
 |
 |
Back to Test Cases & workload characterization
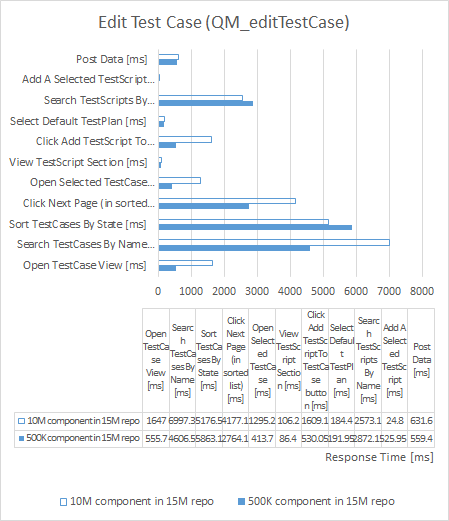
Edit Test Case
| repository size increased by 50% |
component size increased by 2,000% |
 |
 |
Back to Test Cases & workload characterization
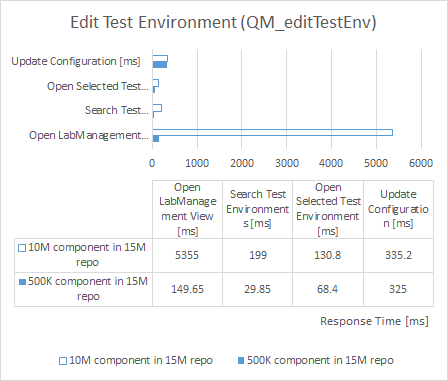
Edit Test Environment
| repository size increased by 50% |
component size increased by 2,000% |
 |
 |
Back to Test Cases & workload characterization
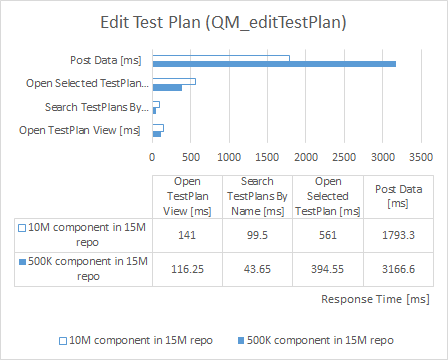
Edit Test Plan
| repository size increased by 50% |
component size increased by 2,000% |
 |
 |
Back to Test Cases & workload characterization
Edit Test Script
| repository size increased by 50% |
component size increased by 2,000% |
 |
 |
Back to Test Cases & workload characterization
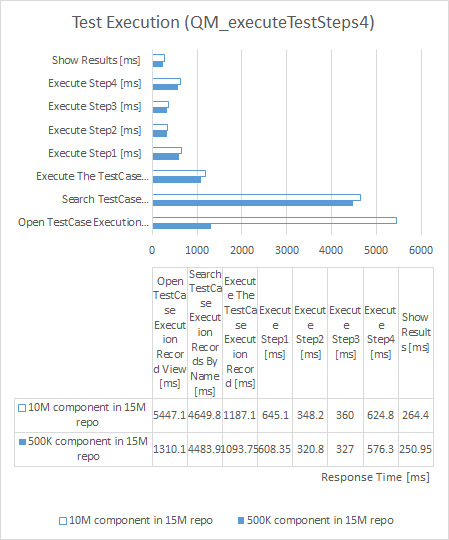
Test Execution
| repository size increased by 50% |
component size increased by 2,000% |
 |
 |
Back to Test Cases & workload characterization
Simple Test Plan Copy
| repository size increased by 50% |
component size increased by 2,000% |
 |
 |
Back to Test Cases & workload characterization
Bulk Edit of Test Cases
| repository size increased by 50% |
component size increased by 2,000% |
 |
 |
Back to Test Cases & workload characterization
View Dashboard
| repository size increased by 50% |
component size increased by 2,000% |
 |
 |
Back to Test Cases & workload characterization
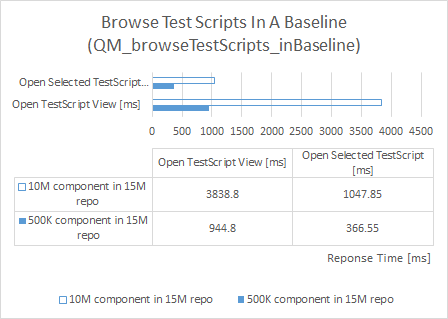
Browse Test Script In Baseline
| repository size increased by 50% |
component size increased by 2,000% |
 |
 |
Back to Test Cases & workload characterization
Browse Test Case Execution Record In Baseline
| repository size increased by 50% |
component size increased by 2,000% |
 |
 |
Back to Test Cases & workload characterization
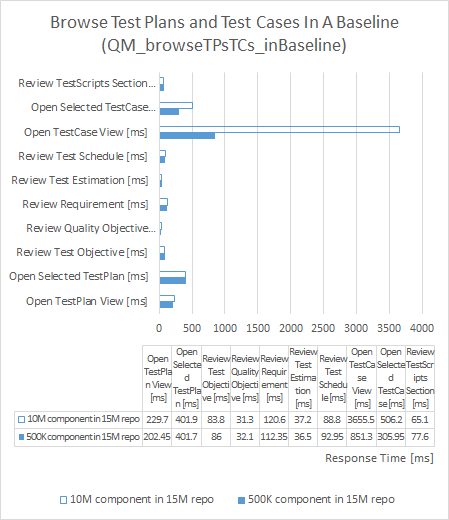
Browse Test Plans And Test Cases In Baseline
| repository size increased by 50% |
component size increased by 2,000% |
 |
 |
Back to Test Cases & workload characterization
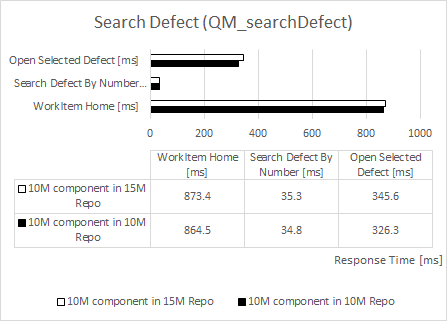
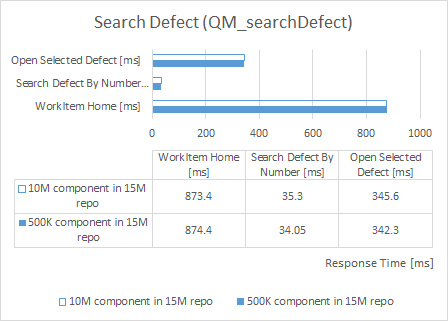
Defect Search
| repository size increased by 50% |
component size increased by 2,000% |
 |
 |
Back to Test Cases & workload characterization
Defect Modify
| repository size increased by 50% |
component size increased by 2,000% |
 |
 |
Back to Test Cases & workload characterization
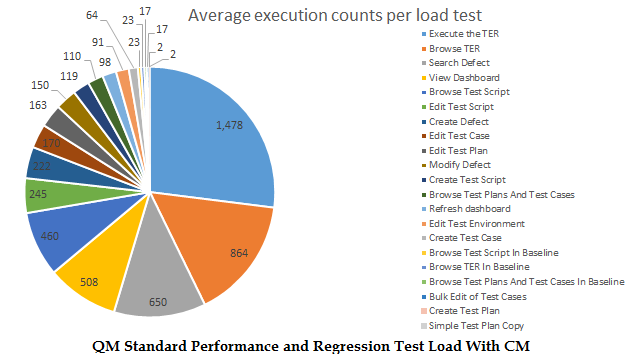
RPT script executions
RPT test scenario breakdown: average page executions during the one-hour staging period
RPT network transfer comparison
Resource utilization
Database Server resource utilization - ETM 7.0.1 15 million repository - 1000users performance load large scale:
| |
extra large component vs smaller component |
| CPU utilization |
 |
Disk utilization |
 |
| Memory |
 |
Disk transfer |
 |
WebSphere Liberty Server (ETM) resource utilization - ETM 7.0.1 15 million repository - 1000users performance load large scale:
| |
extra large component vs smaller component |
| CPU utilization |
 |
Disk utilization |
 |
Garbage collection - JVM GC Chart
For JVM parameter please refer to
Appendix - Key configuration parameters
Verbose garbage collection is enabled to log the GC activities. These GC logs showed very little variation between runs. There is also no discernible difference between versions. Below is one example of the output from the GC log for each application.
WebSphere Liberty Server JVM Garbage Collections
| |
 |
Test load based tunings
The numbers represented in the report are based on some levels of optimization techniques.
Apply additional indexes based on the test load
As seen from the
load execution breakdown, the ETM 7.0.1 performance workload contains Test Case Execution-intensive usage scenarios by design, where more than 40% of the virtual users are either browsing or searching a Test Case Execution Record, or executing it in a stream. This has resulted in the default
Browse Test Case Execution Record (Open TER view) page being consistently loaded with high frequency. Another usage pattern for this workload is to apply the
Name filter for all other types of artifacts across different test scenarios, which contribute to 20% of the total page loadings. The following chart shows an example of applying the
Name column filter and a typical sort, implemented in the performance load:

.
These pages could be the most expensive ones in our performance test, taking more than 10 seconds to load for instance. When we looked at the queries from within the database, we determined to use additional indexes to help improve both of their response times as well as the memory usage. The indexes were created on the ETM database schema as below
--function-based indexes for using name column for filtering and searching
CREATE INDEX "QM_USER"."NAMECOL_UPPER_TER" ON "QM_USER"."EXECUTION_EXECUTION_RECORD" (UPPER("NAME"));
CREATE INDEX "QM_USER"."NAMECOL_UPPER_TCER" ON "QM_USER"."EXECUTION_EXECUTION_TASK_RESLT" (UPPER("NAME"));
CREATE INDEX "QM_USER"."NAMECOL_UPPER_TS" on "QM_USER"."PLANNING_EXECUTION_SCRIPT" (UPPER(NAME));
CREATE INDEX "QM_USER"."NAMECOL_UPPER_CATG" on "QM_USER"."PLANNING_CATEGORY" (UPPER(NAME));
CREATE INDEX "QM_USER"."NAMECOL_UPPER_TC" on "QM_USER"."PLANNING_TEST_CASE" (UPPER(NAME));
CREATE INDEX "QM_USER"."NAMECOL_UPPER_TSU" on "QM_USER"."PLANNING_TEST_SUITE" (UPPER(NAME));
CREATE INDEX "QM_USER"."NAMECOL_UPPER_CTRR" on "QM_USER"."REPOSITORY_CONTRIBUTOR_RECORD" (UPPER(NAME));
CREATE INDEX "QM_USER"."USERID_UPPER_CTRR" on "QM_USER"."REPOSITORY_CONTRBTR_RCRD_SR_DS" (UPPER(USER_ID));

--composite indexes to improve large views such as execution record, and test results
CREATE INDEX "QM_USER"."TER_JZ_ARC_MOD_PRJ_ITM_ST" ON "QM_USER"."EXECUTION_EXECUTION_RECORD" ("JZ_DISCRIMINATOR", "ARCHIVED", "MODIFIED", "PROJECT_AREA_ITEM_ID", "ITEM_ID", "STATE_ID");
CREATE INDEX "QM_USER"."TCER_JZ_ARC_ET_PRJ_ITM_ST" ON "QM_USER"."EXECUTION_EXECUTION_TASK_RESLT" ("JZ_DISCRIMINATOR", "ARCHIVED", "END_TIME", "PROJECT_AREA_ITEM_ID", "ITEM_ID", "STATE_ID");
CREATE INDEX "QM_USER"."JZ_ARC_PRJ_SNPS_ITM_ST" ON "QM_USER"."PLANNING_VERSIONABLE_ITEM" ("JZ_DISCRIMINATOR", "ARCHIVED", "PROJECT_AREA_ITEM_ID", "SNAPSHOT", "ITEM_ID", "STATE_ID");

--composite index for process
CREATE INDEX "QM_USER"."PRJITMID_ITMID" ON "QM_USER"."PROCESS_PROCESS_AREA" ("PROJECT_AREA_ITEM_ID", "ITEM_ID");
Apply SQL profile
We created function-based indexes for the queries for filtering/searching, as shown above. However they may not be directly recognized yet applied by the underlying queries. To make them immediately effective, we used SQL profile suggested by the Oracle SQL Tuning Advisor. The process to apply the SQL profiles is:
- emulate the searching and filtering scenarios, via web browser or automation
- collect theses queries (this can be done either from tracking the hotspot queries from the Oracle Performance Hub, or found in the AWR report)
- create tuning tasks, and execute tuning tasks
- review tuning suggestion, make sure the function-based indexes are being used by the EXPLAIN plan with which performance is improved
- accept tuning task that applies the SQL profile
In ETM 7.0.1, we found that the option to allow function-based indexes through SQL profiling may disappear due to an index "RPSTR_VRSNSTDBDSCRNTTMCRTDCNFG" presented under the ETM user schema. After dropping this index, the EXPLAIN PLAN from SQL profile will become desired. Based on the performance payload test and extended longer loads, dropping this particular index in the ETM user schema does not seem to introduce negative performance impact to the application.
Oracle tuning parameters
The recommended Oracle tunings for ELM is documented in the
DOORS Next performance guide. The test results in this report adopted the majority of the settings or concepts, except for leaving
filesystemio_options and
parallel_degree_policy default values. While they can further improve some of the page response times to a great deal, we found they could also made the load variable and response times unstable if the disk busyness on the Oracle server is already high. We recommend to tune them accordingly when you have extra disk capacity. The tuning parameters for ETM 7.0.1 large scale test are:
####enable automatic memory management (AMM)
#original memory_max_target and memory_target are both 0;
#original sga_target=28800M and sga_max_size=40G;
#may need to increase the memory settings on the system first,  run as root: mount -t tmpfs shmfs -o size=56g /dev/shm
alter system set memory_max_target=52000M scope=spfile;
alter system set memory_target=52000M scope=spfile;
alter system set sga_max_size=0 scope=spfile;
alter system set sga_target=0 scope=spfile;
alter system set pga_aggregate_limit=0 scope=spfile;
alter system set pga_aggregate_target=0 scope=spfile;
#rebounce db. note that in the test we also secured the sizes of sga_max_size and db_cache_size to match the high water mark observed prior to tuning
alter system set sga_max_size=40G scope=spfile;
alter system set db_cache_size=24G scope=spfile;
#rebounce db

####disable adaptive plan
alter system set optimizer_adaptive_plans = false #default true
#_optimizer_use_feedback= false #not available in 12c

####these settings can help enable auto parallelism in SQL execution. however for high payload, only turn these on when you have enough disk capacity
#alter system set parallel_degree_policy=auto scope=spfile; #default manual
#alter system set filesystemio_options=setall scope=spfile; #default none
#rebounce db
Appendix - Key configuration parameters
Product
|
Version |
Highlights for configurations under test |
| IBM HTTP Server for WebSphere Application Server |
8.5.5.12 |
IBM HTTP Server functions as a reverse proxy server implemented via Web server plug-in for WebSphere Application Server.
Configuration details can be found from the CLM infocenter.
HTTP server (httpd.conf):
OS Configuration:
- max user processes = unlimited
|
| Embedded WebSphere Liberty Server | 20.0.0.3 | JVM settings:
- GC policy and arguments, max and init heap sizes:
 -Xgcpolicy:gencon -Xmx16g -Xms16g -Xmn4g -Xcompressedrefs -Xgc:preferredHeapBase=0x100000000
 -verbose:gc -Xverbosegclog:gc.log -XX:MaxDirectMemorySize=1G
SDK version:
- java.version = 1.8.0_191; java.runtime = Java(TM) SE Runtime Environment (8.0.5.25 - pxa6480sr5fp25-20181030_01(SR5 FP25))
Thread pools:
- Maximum WebContainer = Minimum WebContainer = 500
OS Configuration:
System wide resources for the app server process owner:
- max user processes = unlimited
- open files = 65536
|
| Oracle |
Oracle Database 12c Enterprise Edition Release 12.2.0.1.0 - 64bit Production |
|
| LDAP server |
|
|
| License server |
|
N/A |
| RPT workbench |
8.3.0.3 |
Defaults |
| RPT agents |
8.3.0.3 |
Defaults |
| Network |
|
Shared subnet within test lab |
About the authors:
HongyanHuo is a performance engineer focusing on the performance test & analysis of products in the IBM Engineering Lifecycle Management (ELM) family.
Questions and comments:
- What other performance information would you like to see here?
- Do you have performance scenarios to share?
- Do you have scenarios that are not addressed in documentation?
- Where are you having problems in performance?
Warning: Can't find topic Deployment.PerformanceDatasheetReaderComments
 7.0.1 Performance Report: IBM Engineering Test Management (DRAFT)