How is the Completion Probability of a work item calculated?
Could anyone let me know know the calculation formula of Completion Probability?
I looked at following articles but I was not able to figure out the calculation formula of Completion Probability.
https://jazz.net/forum/questions/87776/2x-rtc-planning-features-in-4x
https://jazz.net/library/article/594
I looked at following articles but I was not able to figure out the calculation formula of Completion Probability.
https://jazz.net/forum/questions/87776/2x-rtc-planning-features-in-4x
https://jazz.net/library/article/594
Accepted answer
The completion probability is estimated using a triangular probability distribution ( see http://en.wikipedia.org/wiki/Triangular_distribution ) with the midpoint being the estimated time and the two endpoints being the minimum and maximum estimate respectively. If the minimum and maximum are not specified they default to 1/2 of the estimated time and 2x the estimated time respectively.
This in practice ends up yielding a higher probability that an item will complete behind schedule than ahead of schedule. The diagram below illustrates how the area under the triangle and to the right of the effective estimate is twice as large as the area to the left of the effective estimate, meaning that if the time available is exactly equal to the estimate the probability of completion will be estimated at 33%.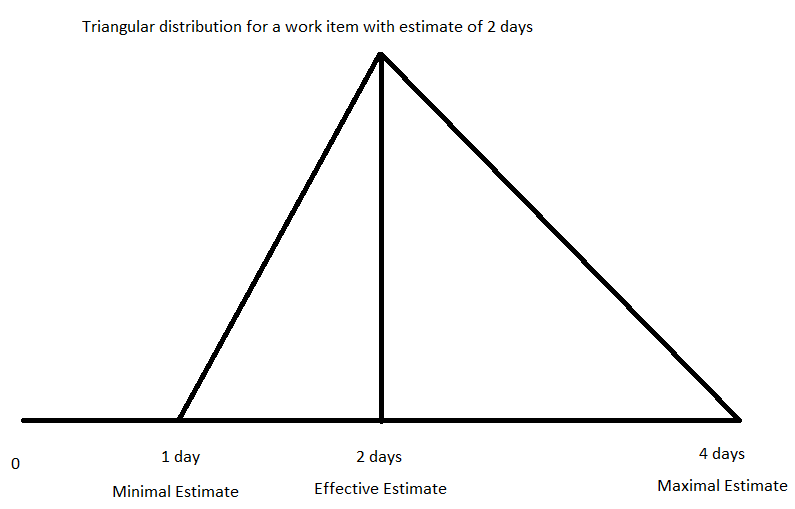
This in practice ends up yielding a higher probability that an item will complete behind schedule than ahead of schedule. The diagram below illustrates how the area under the triangle and to the right of the effective estimate is twice as large as the area to the left of the effective estimate, meaning that if the time available is exactly equal to the estimate the probability of completion will be estimated at 33%.
Comments
Millard Ellingsworth
FORUM ADMINISTRATOR / JAZZ DEVELOPER Feb 13 '14, 5:17 p.m.As both of your references indicate:
Yoshihisa Komai
Feb 13 '14, 6:02 p.m.I want to get following kind of answer so that I can clearly understand how Completion Probability works.
https://jazz.net/forum/questions/18287/how-does-team-concert-determine-individual-progress
User 1:
134/162 = 0.82 ~0.8 -> 0.8 - 0.8 = 0 (On Track)
(Bar will be green as both ratios (realtime/worktime) are equal)
User 2:
48/48 = 1 -> 0.8 - 1 = -0.2 -> (Behind)
Expected Work Done= (48 * 0.2) - 0 = 9.6 ~ 10
User 3:
76/88 = 0.86 ~0.9 -> 0.8 - 0.9 = -0.1 (Behind)
Expected Work Done= (88 * 0.2) - 12 = 5.6 ~ 6