Total estimates over time chart in formal process project
One answer
Comments
Hi Christophe. Thanks for that, but can you be a bit more specific about where 'Reports' is in eclipse? I'm a new user and haven't quite found may way around yet.
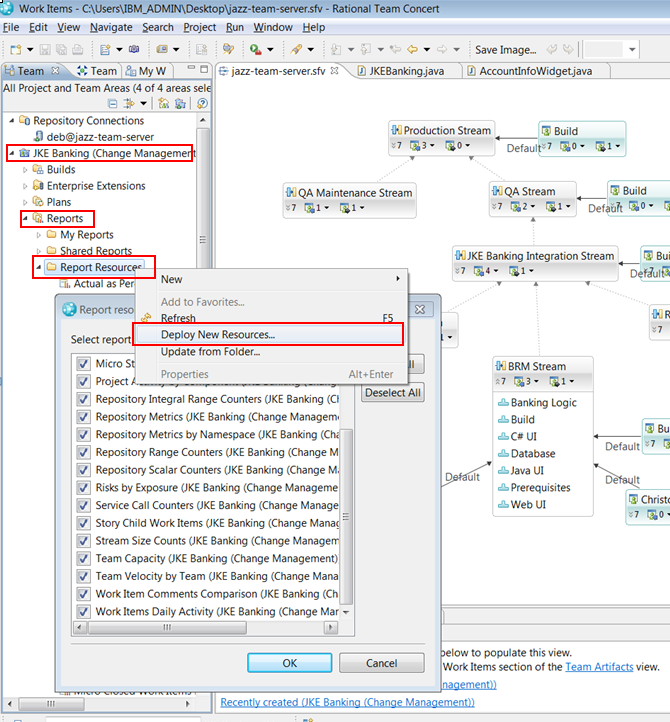
Hi Stuart, seems the wording 'Deploy New Templates' was replaced by 'Deploy New Resources' in the right-click highlighted below ... does this work for you ?
I doubt that deploying the report helps with the data. These reports act on complexity data (for example story points) and that data is collected in the data warehouse. If you don't have a complexity for the burndown, I don't see how the chart should calculate the complexity if there is no complexity available. I have however not tried what would be possible should you add a complexity attribute.
The Burndown I referred to (and I assumed your question Stuart) is the 'Burndown' (hours), not the 'Release Burndown' (story points).

That's got it sorted! Thankyou very much for the help.
Great Stuart ... happy it works for you.