CLM reliability report: CLM 5.0 release
Authors: Jeff Pang Last updated: June 2, 2014 Build basis: Collaborative Lifecycle Management 5.0Introduction
Reliability testing is about exercising the CLM applications so that failures are discovered and removed before the system is deployed. There are many different combinations of alternate pathways through the complex CLM application, this test scenario exercises the most likely use cases (explained in detail below). The use cases are put under constant load for a seven day period to validate that the CLM application provides the expected level of service, without any downtime or degradation in overall system performance. This report is a sample of the results from a recent CLM 5.0 GA Reliability run.Disclaimer
The information in this document is distributed AS IS. The use of this information or the implementation of any of these techniques is a customer responsibility and depends on the customers ability to evaluate and integrate them into the customers operational environment. While each item may have been reviewed by IBM for accuracy in a specific situation, there is no guarantee that the same or similar results will be obtained elsewhere. Customers attempting to adapt these techniques to their own environments do so at their own risk. Any pointers in this publication to external Web sites are provided for convenience only and do not in any manner serve as an endorsement of these Web sites. Any performance data contained in this document was determined in a controlled environment, and therefore, the results that may be obtained in other operating environments may vary significantly. Users of this document should verify the applicable data for their specific environment. Performance is based on measurements and projections using standard IBM benchmarks in a controlled environment. The actual throughput or performance that any user will experience will vary depending upon many factors, including considerations such as the amount of multi-programming in the users job stream, the I/O configuration, the storage configuration, and the workload processed. Therefore, no assurance can be given that an individual user will achieve results similar to those stated here. This testing was done as a way to compare and characterize the differences in performance between different versions of the product. The results shown here should thus be looked at as a comparison of the contrasting performance between different versions, and not as an absolute benchmark of performance.What our tests measure
We use predominantly automated tooling such as Rational Performance Tester (RPT) to simulate a workload normally generated by client software such as the Eclipse client or web browsers. All response times listed are those measured by our automated tooling and not a client. The diagram below describes at a very high level which aspects of the entire end-to-end experience (human end-user to server and back again) that our performance tests simulate. The tests described in this article simulate a segment of the end-to-end transaction as indicated in the middle of the diagram. Performance tests are server-side and capture response times for this segment of the transaction.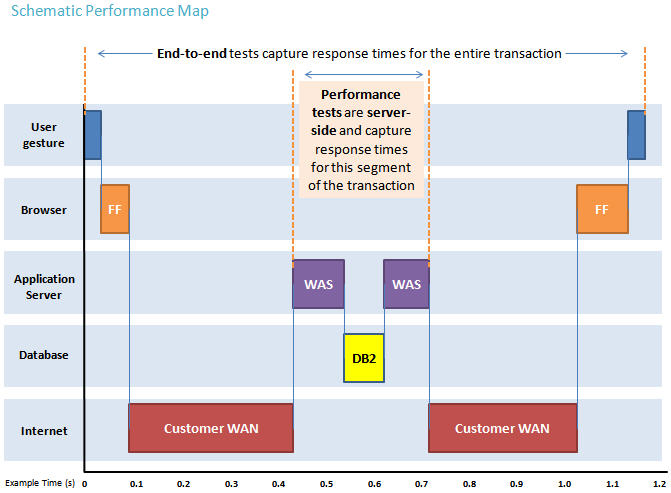
Findings
Performance goals
Primary Goals - Detection
- Test the CLM software performance under given conditions, and monitoring for any degradation in performance over the course of the 7 day run.
- Monitor for increases in the overall page or page element averages.
- Report on any specific page which increases over time.
Secondary Goals - Analysis
- To discover the main cause of any failure.
- To find and correlate the structure of repeating failures.
Findings
- Completion of 7 day run without any crashes or noticeable degradation in performance.
- CCM accumulated thousands of sprite-related tmp files, the issue has been addressed in jazz.net workitem 318899.
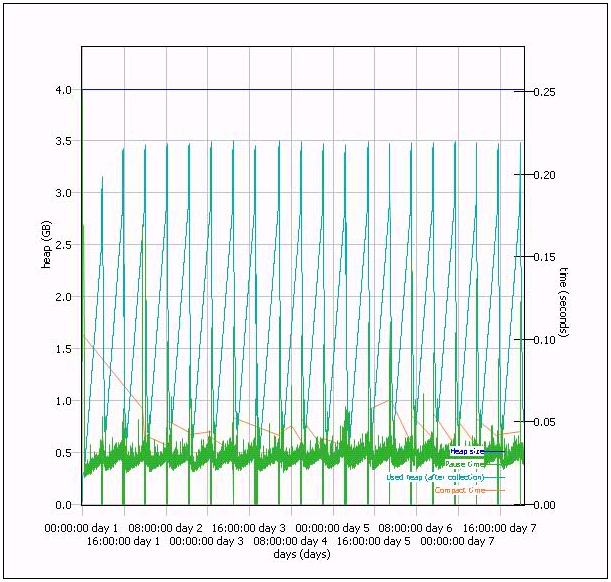
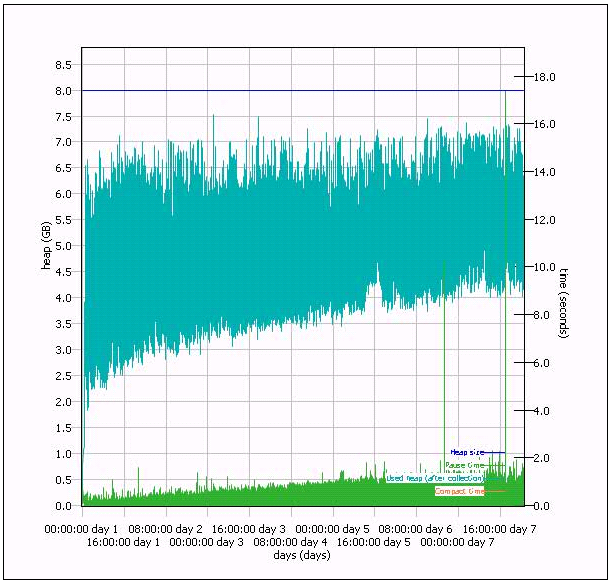
- RM encountered increased memory consumption during the 7-day period, the issue has been addressed in jazz.net workitem 87921.
- The load setting/distribution fits our anticipated scalability needs.
Topology
The topology under test is based on Standard Topology (E1) Enterprise - Distributed / Linux / DB2.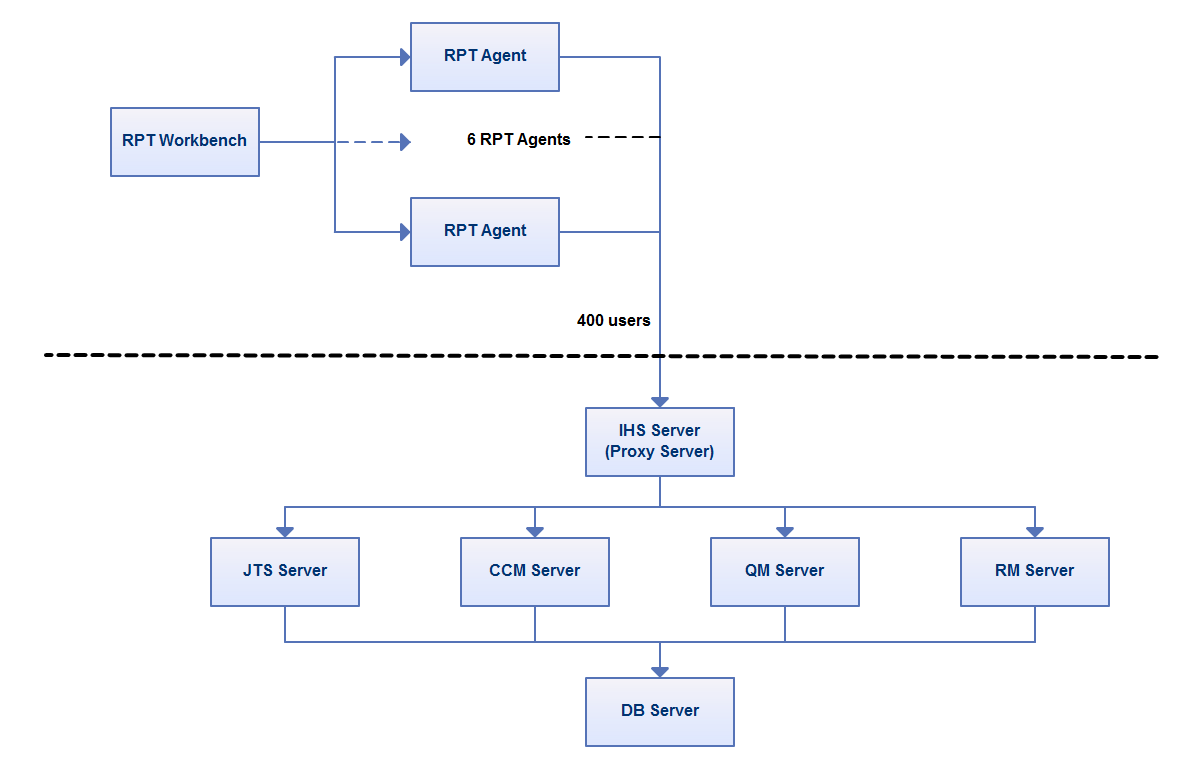 The specifications of machines under test are listed in the table below. Server tuning details listed in Appendix A
| Function | Number of Machines | Machine Type | CPU / Machine | Total # of CPU Cores/Machine | Memory/Machine | Disk | Disk capacity | Network interface | OS and Version |
|---|---|---|---|---|---|---|---|---|---|
| IBM HTTP Server and WebSphere Plugin | 1 | IBM System x3250 M4 | 1 x Intel Xeon E3-1240 3.4GHz (quad-core) | 8 | 16GB | RAID 1 -- SAS Disk x 2 | 299GB | Gigabit Ethernet | Red Hat Linux Server 2.6.32-431.1.2.el6.x86_64, WebSphere Application Server 8.5.5.1 64-bit |
| JTS Server | 1 | VMWare Image | VMWare Hypervisor, Intel(R) Xeon(R) CPU E5-2640 0 @ 2.50GHz | v4 | v8GB | VMFS | V100GB | Gigabit Ethernet | Red Hat Linux Server 2.6.32-358.14.1.el6.x86_64, WebSphere Application Server 8.5.5.1 64-bit |
| CCM Server | 1 | VMWare Image | VMWare Hypervisor, Intel(R) Xeon(R) CPU E5-2640 0 @ 2.50GHz | v4 | v8GB | VMFS | v100GB | Gigabit Ethernet | Red Hat Linux Server 2.6.32-358.14.1.el6.x86_64, WebSphere Application Server 8.5.5.1 64-bit |
| QM Server | 1 | VMWare Image | VMWare Hypervisor, Intel(R) Xeon(R) CPU E5-2640 0 @ 2.50GHz | v4 | v8GB | VMFS | v100GB | Gigabit Ethernet | Red Hat Linux Server 2.6.32-358.14.1.el6.x86_64, WebSphere Application Server 8.5.5.1 64-bit |
| RM Server | 1 | VMWare Image | VMWare Hypervisor, Intel(R) Xeon(R) CPU E5-2640 0 @ 2.50GHz | v4 | v16GB | VMFS | v200GB | Gigabit Ethernet | Red Hat Linux Server 2.6.32-358.14.1.el6.x86_64, WebSphere Application Server 8.5.5.1 64-bit |
| DB2 Server | 1 | IBM System x3550 M4 | 2 x Intel Xeon E5-2640 2.5GHz (six-core) | 24 | 64GB | RAID 5 -- SAS Disk x 2 | 2.4TB | Gigabit Ethernet | Red Hat Linux Server 2.6.32-358.14.1.el6.x86_64, DB2 Enterprise 10.5.1 |
| RPT Workbench | 1 | VMWare Image | VMWare Hypervisor, Intel(R) Xeon(R) CPU E5-2640 0 @ 2.50GHz | v4 | v8GB | VMFS | v100GB | Gigabit Ethernet | Red Hat Linux Server 2.6.32-431.11.2.el6.x86_64, Rational Performance Tester 8.3.0.3 64-bit |
| RPT Agent | 6 | VMWare Image | VMWare Hypervisor, Intel(R) Xeon(R) CPU E5-2640 0 @ 2.50GHz | v4 | v4GB | VMFS | v30GB | Gigabit Ethernet | Red Hat Linux Server 2.6.32-431.17.1.el6.x86_64, Rational Performance Tester Agent 8.3.0.3 64-bit |
| Network switches | N/A | Cisco 2960G-24TC-L | N/A | N/A | N/A | N/A | N/A | Gigabit Ethernet | 24 Ethernet 10/100/1000 ports |
Network connectivity
All CLM server machines and RPT test driver machines are located on the same subnet. The LAN has 1000 Mbps of maximum bandwidth, and the average latency between the IHS server and all distributed Application Servers is 1.12ms. The LDAP Server is also on the same subnet, but has a latency of less than 0.8ms with the CLM Servers.Data volume and shape
At the beginning of the test the repository projects were populated to have the following size:- RM/DNG - 1 project with ~84K artifacts (imported from the medium project template for RM)
- CCM - 1 project populated with 100K artifacts
- QM - 1 project populated with 100K artifacts
- Admin 1 CLM project with artifacts linked across all projects
Methodology
Rational Performance Tester was used to simulate the CLM workload created using the web client. Each user is distributed across a set of user groups. Each user group represents a CLM product area, e.g. CCM, QM, RM. Each user group performs a random set of use cases from a set of available use cases. A Rational Performance Tester script is created for each use case. The scripts are organized by pages and each page represents a single user action. Based on real customer use, the CLM test scenario provides a ratio of 70% reads and 30% writes. The total CLM workload distribution is 45% CCM, 30% QM, 10% Integrations, 15% DNG Web and RM. Test cases with the higher weights will be run more frequently within the User Groups.CLM test cases and weighted distribution
| Use case | Description | User Group | Weight within User Group loop |
|---|---|---|---|
| RTC_CreateDefect | CCM User logs in to their project area, creates a defect, then logs out. | CCM | 5 |
| RTC_QueryAndEditDefect | CCM User logs in to their project area, queries for a defect, edits defect, then logs out. | CCM | 10 |
| RTC_QueryAndViewDefect | CCM User logs in to their project area, queries for a defect, views defect, then logs out. | CCM | 60 |
| RTC_DashboardInitialization | CCM User logs in to their project area, non-cached first time dashboard access, then logs out. | CCM | 5 |
| RTC_DefaultDashboard | CCM User logs in to their project area, open default dashboard, then logs out. | CCM | 5 |
| RTC_FeedsDashboard | CCM User logs in to their project area, open dashboard with feed only, then logs out. | CCM | 5 |
| RTC_WorkItemGraphDashboard | CCM User logs in to their project area, open dashboard with workitem statistics graphs, then logs out. | CCM | 5 |
| RTC_WorkitemQueryDashboard | CCM User logs in to their project area and open dashboard with project shared queries, then logs out. | CCM | 5 |
| QM_CreateTestCase | QM User logs in to their project area and creates a test case. | QM | 6 |
| QM_VewDashboard_DV | QM User logs in to their project area and view dashboard. | QM | 2 |
| QM_BrowseTPsTCs | QM User logs in to their project area, then browses test plans and test cases. | QM | 60 |
| QM_BrowseTERs | QM User logs in to their project area, then browses test case execution records. | QM | 10 |
| QM_editTestScript | QM User logs in to their project area, opens and edits a test script. | QM | 18 |
| QM_editTestPlan | QM User logs in to their project area, opens and edits a test plan. | QM | 5 |
| QM_editTestCase | QM User logs in to their project area, opens and edits a test case. | QM | 18 |
| QM_createTestScript | QM User logs in to their project area and creates a test script. | QM | 6 |
| QM_executeTestSteps4 | QM User logs in to their project area, searches for TER, executes a 4 step TER then shows results. | QM | 60 |
| QM_browseTestScript | QM User logs in to their project area and browses a test script. | QM | 32 |
| QM_bulkEditTC | QM User logs in to their project area, selects and edits multiple test cases. | QM | 1 |
| QM_createDefect | QM User logs in to their project area and creates a defect. | QM | 8 |
| QM_createTestPlan | QM User logs in to their project area and creates a test plan. | QM | 1 |
| QM_editTestEnv | QM User logs in to their project area and edits a test environment. | QM | 8 |
| QM_fullTextSearch | QM User logs in to their project area and does text search. | QM | 3 |
| QM_modifyDefect | QM User logs in to their project area and modifies a defect. | QM | 5 |
| QM_searchDefect | QM User logs in to their project area and searches for a defect. | QM | 14 |
| QM_simpleCopy | QM User logs in to their project area and copy a test plan. | QM | 1 |
| QM_viewDashboard | QM User logs in to their project area and refreshes the dashboard. | QM | 20 |
| QPlan to Req Collection | QM User logs in, creates a new test plan, and then creates a new quality task and links it to an RTC task, then logs out. | Int | 5 |
| Test case links Dev item | QM User logs in, creates a new test case and links it to an RTC workitem, then logs out. | Int | 5 |
| TER Links | QM User logs in to their project, creates and runs a new test case, then creates a linked RTC defect to the TER, user logs out. | Int | 5 |
| Test script Links | QM User logs in to their project, creates a new test script and links it to an RTC workitem, then logs out. | Int | 5 |
| Test plan Links | QM User logs in to their project, creates a new test plan and links it to a new RM collection, then logs out. | Int | 5 |
| RM artifact links to test case | RM User logs in to their project area, creates a new artifact then links to a new test case in QM, then logs out. | Int | 1 |
| RM artifact links to workitem | RM User logs in to their project area, creates a new artifact then links to a new workitem in CCM, then logs out. | Int | 1 |
| RM collection links to test plan | RM User logs in to their project area, creates a new collection then links to a new QM test plan, then logs out. | Int | 1 |
| RM collection links to release plan | RM User logs in to their project area, creates a new collection then links to a new CCM release plan, then logs out. | Int | 1 |
| CreateArtifact | RM user logs in to their project area and creates a new artifact. | RM/DNG | 3 |
| CreateCollection | RM user logs in to their project area and creates a new collection. | RM/DNG | 1 |
| EditModuleArtifact | RM user logs in to their project area, opens a module and edits a module artifact. | RM/DNG | 3 |
| OpenCollection | RM user logs in to their project area and opens a collection. | RM/DNG | 1 |
| ManageFolders | RM user logs in to their project area and creates/moves/deletes folders. | RM/DNG | 1 |
| OpenProjectDashboard | RM user logs in to their project area and opens the dashboard | RM/DNG | 5 |
| OpenAndScrollLargeModule | RM User logs in, opens a large module, then scrolls through the entire 1500 artifacts. | RM/DNG | 10 |
| ModuleViewTraceReportPDF | RM User logs in, opens a large module, then generates and publishes a traceability report. | RM/DNG | 2 |
| OpenRMAdmin | RM User logs in, then opens the administration page. | RM/DNG | 39 |
| ReviewModule | RM User logs in, opens and reviews a large module. | RM/DNG | 1 |
| CreateModuleArtifactComment | RM User logs in, opens a large module, then adds a comment to a module artifact. | RM/DNG | 15 |
| DisplayModuleHistory | RM User logs in, opens a module and shows the module history. | RM/DNG | 1 |
| Upload4MBNewArtifact | RM User logs in, then uploads new artifacts from a 4MB file. | Long Operations | 1 |
| ImportRegIF | RM User logs, then imports new artifacts from a file in requirements interchange format. | Long Operations | 1 |
| ImportCSV | RM User logs, then imports new artifacts from a CSV file. | Long Operations | 1 |
| ImportWordDoc | RM User logs, then imports new artifacts from a word document. | Long Operations | 1 |
Results
IHS Thread Analysis IHS threads usage is monitored to determine how well IHS server was keeping up with the load, and determine if IHS was tuned properly to move the threads through the system most efficiently. The following chart shows how well the IHS server was handling it's threads, and of note are the threads in WAS module which do not accumulate over time which indicates the WebSphere Application servers are keeping up with the load.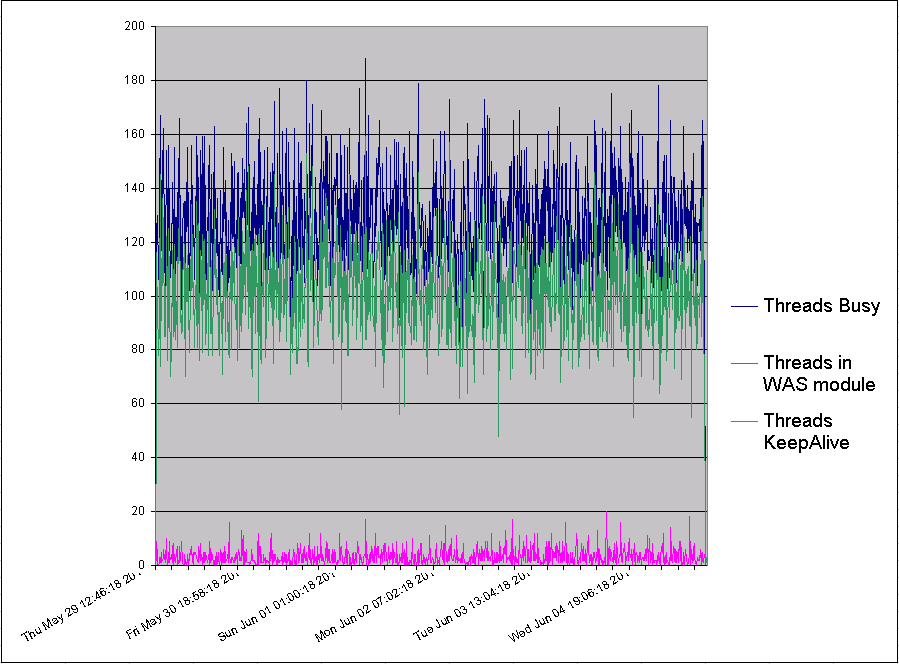 RPT Page Hit Rate
 is captured to monitor the load and help with correlation of any incidences where load changes. For purposes of this test the load is consistent.
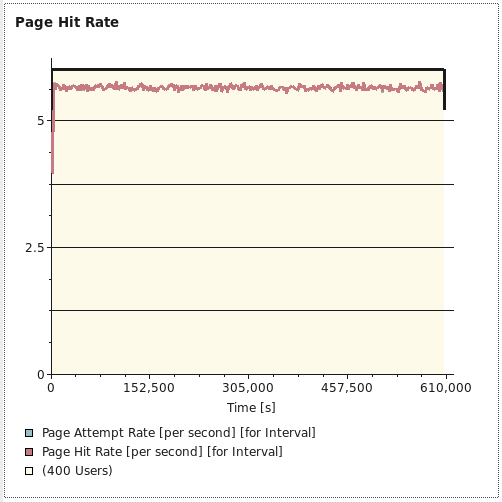
RPT Page Hit Rate
RPT Page Hit Rate is captured to monitor the load and help with correlation of any incidences where load changes. For purposes of this test the load is consistent.
 RPT Page Element Response over Time
Page Element Response Rate is captured to monitor the average page element response over time.
RPT Page Element Response over Time
Page Element Response Rate is captured to monitor the average page element response over time.
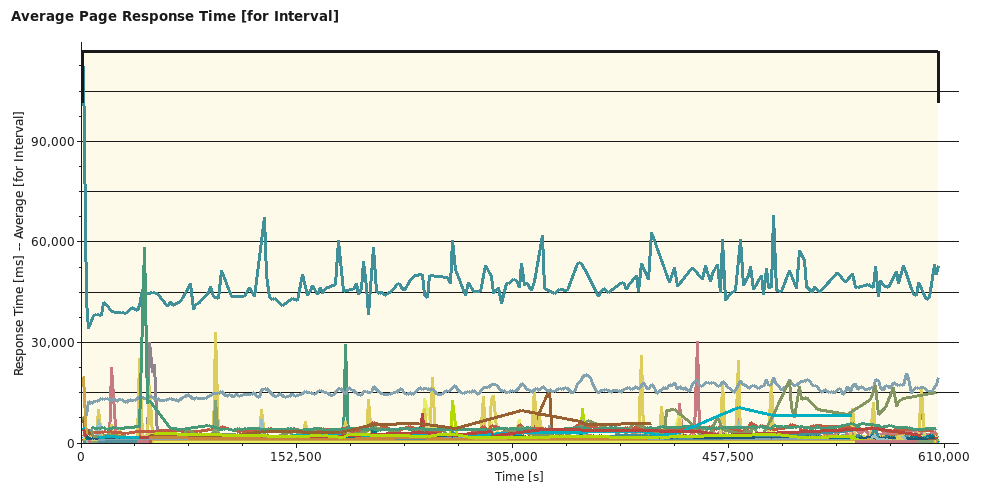
 RPT Average Page Response Time
 shows the average of all pages over time. This is very useful in determining which if/any pages are unexpectedly increasing in response time over the seven day period.
RPT Average Page Response Time
RPT Average Page Response Time shows the average of all pages over time. This is very useful in determining which if/any pages are unexpectedly increasing in response time over the seven day period.
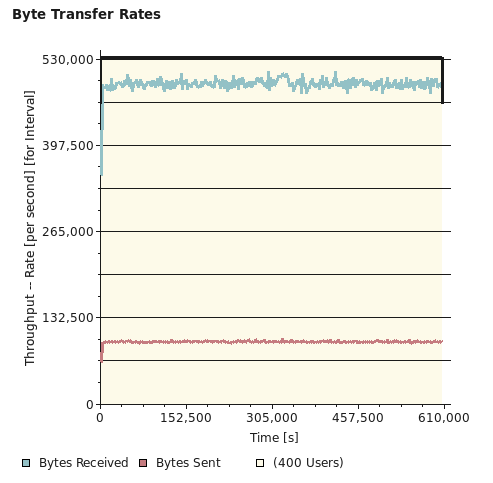
 RPT Byte Transfer Rate
 shows us if bytes being sent or received are changing over time, indicating a drop in throughput.
RPT Byte Transfer Rate
RPT Byte Transfer Rate shows us if bytes being sent or received are changing over time, indicating a drop in throughput.
Appendix A
| Product |
Version | Highlights for configurations under test |
|---|---|---|
| IBM HTTP Server for WebSphere Application Server | 8.5.5.1 | IBM HTTP Server functions as a reverse proxy server implemented
via Web server plug-in for WebSphere Application Server. Configuration details can be found from the CLM infocenter.
HTTP server (httpd.conf):
MaxClients: increase value for high-volume loads (adjust value based on user load)
|
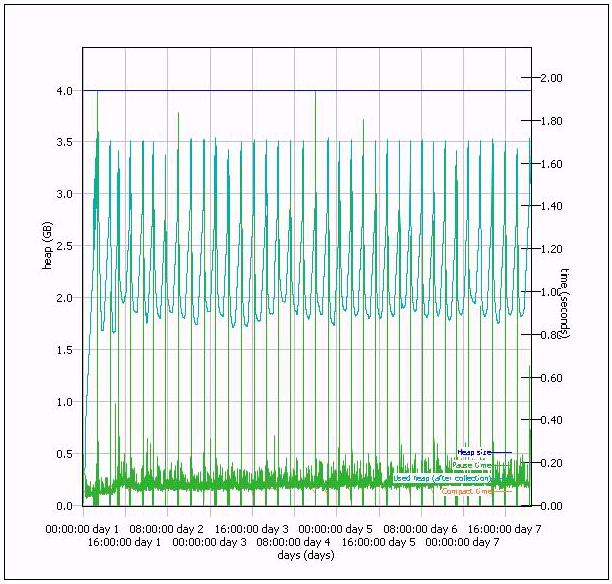
| IBM WebSphere Application Server Network Deployment for JTS, Admin, and CLMHelp applications | 8.5.5.1 | JVM settings:
-Xmx4g -Xms4g -Xmn1g -Xcompressedrefs -Xgc:preferredHeapBase=0x100000000
-Xverbosegclog:AppNodeXXX_gc.log -XX:MaxDirectMemorySize=1G
-Xgc:classUnloadingKickoffThreshold=2000 -Xgcpolicy:balanced -Xloaminimum0.02
Thread pools:
|
| IBM WebSphere Application Server Network Deployment for CCM application | 8.5.5.1 | JVM settings:
-Xmx4g -Xms4g -Xmn1g -Xcompressedrefs -Xgc:preferredHeapBase=0x100000000
-Xverbosegclog:AppNodeXXX_gc.log -XX:MaxDirectMemorySize=1G
-Xgc:classUnloadingKickoffThreshold=2000 -Xgcpolicy:balanced -Xloaminimum0.02
Thread pools:
|
| IBM WebSphere Application Server Network Deployment QM application | 8.5.5.1 | JVM settings:
-Xmx4g -Xms4g -Xmn1g -Xcompressedrefs -Xgc:preferredHeapBase=0x100000000
-Xverbosegclog:AppNodeXXX_gc.log -XX:MaxDirectMemorySize=1G
-Xgc:classUnloadingKickoffThreshold=2000 -Xgcpolicy:balanced -Xloaminimum0.02
Thread pools:
|
| IBM WebSphere Application Server Network Deployment for RM, Converter applications | 8.5.5.1 | JVM settings:
-Xmx8g -Xms8g -Xmn2g -Xcompressedrefs -Xgc:preferredHeapBase=0x100000000
-Xverbosegclog:AppNodeXXX_gc.log -XX:MaxDirectMemorySize=1G
-Xgc:classUnloadingKickoffThreshold=2000 -Xgcpolicy:balanced -Xloaminimum0.02
Thread pools:
|
| DB2 | DB2 10.5 | |
| RPT Workbench | 8.3.0.3 | Defaults |
| RPT agents | 8.3.0.3 | Defaults |
| Network | Shared subnet within test lab |
 CCM
CCM
 QM
QM
 RM
RM
For more information
About the authors
Questions and comments:
- What other performance information would you like to see here?
- Do you have performance scenarios to share?
- Do you have scenarios that are not addressed in documentation?
- Where are you having problems in performance?
Contributions are governed by our Terms of Use. Please read the following disclaimer.
Dashboards and work items are no longer publicly available, so some links may be invalid. We now provide similar information through other means. Learn more here.