Introduction
This article presents the results of our performance testing done for the RELM 5.0 release and deployment suggestions derived from the tests.
Disclaimer
The information in this document is distributed AS IS. The use of this information or the implementation of any of these techniques is a customer responsibility and depends on the customers ability to evaluate and integrate them into the customers operational environment. While each item may have been reviewed by IBM for accuracy in a specific situation, there is no guarantee that the same or similar results will be obtained elsewhere. Customers attempting to adapt these techniques to their own environments do so at their own risk. Any pointers in this publication to external Web sites are provided for convenience only and do not in any manner serve as an endorsement of these Web sites. Any performance data contained in this document was determined in a controlled environment, and therefore, the results that may be obtained in other operating environments may vary significantly. Users of this document should verify the applicable data for their specific environment.
Performance is based on measurements and projections using standard IBM benchmarks in a controlled environment. The actual throughput or performance that any user will experience will vary depending upon many factors, including considerations such as the amount of multi-programming in the users job stream, the I/O configuration, the storage configuration, and the workload processed. Therefore, no assurance can be given that an individual user will achieve results similar to those stated here.
This testing was done as a way to compare and characterize the differences in performance between different versions of the product. The results shown here should thus be looked at as a comparison of the contrasting performance between different versions, and not as an absolute benchmark of performance.
What our tests measure
We use predominantly automated tooling such as Rational Performance Tester (RPT) to simulate a workload normally generated by client software such as the Eclipse client or web browsers. All response times listed are those measured by our automated tooling and not a client.
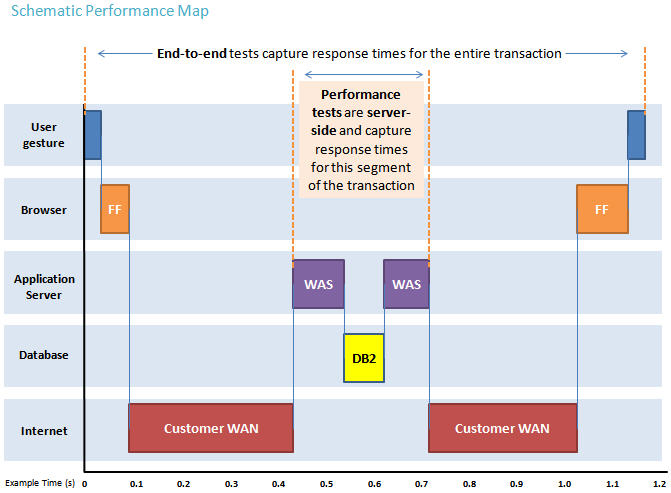
The diagram below describes at a very high level which aspects of the entire end-to-end experience (human end-user to server and back again) that our performance tests simulate. The tests described in this article simulate a segment of the end-to-end transaction as indicated in the middle of the diagram. Performance tests are server-side and capture response times for this segment of the transaction.
Performance goals
The goal of this test was to document our testing for RELM 5.0 and provide topology and base configuration suggestions. The topology and hardware used for this test simulated approximately 250 concurrent users at the tested workload.
Topology
The test environment used was the standard
(SSE-E3) Enterprise distributed Red Hat Enterprise Linux (RHEL) with DB2 topology.
The table below shows the hardware specifications used in the test.
|
Role |
Model |
Processor Type |
Number of Processors |
Processor Speed |
Memory (GB) |
OS |
Physical / Virtual |
Using Solid State Disks (SSD) YES/NO |
| RELM Server 5.0 |
IBM System X3650 M2 |
Intel ® Xeon ® X5570 |
16 |
2.99 GHz |
64 GB |
RHEL 6.1 |
Physical |
YES |
| Lifecycle Query Engine (LQE) Server 5.0 |
IBM System X3250 M4 |
Intel ® Xeon ® CPU E3-1270 V2 |
4 |
3.5 GHz |
32 GB |
RHEL 6.1 |
Physical |
YES |
| Jazz Team Server (JTS) Server 5.0 |
IBM System X3250 M4 |
Intel ® Xeon ® CPU E3-1270 V2 |
4 |
3.5 GHz |
32 GB |
RHEL 6.1 |
Physical |
NO |
| DB2 Server |
IBM System X3850 |
Intel ® Xeon |
4 |
3.17 GHz |
16 GB |
RHEL 6.1 |
Physical |
NO |
| Rational Team Concert (RTC) Server 5.0 |
IBM System X3550 M4* |
Intel ® Xeon CPU ES-26900 |
4 |
2.899 GHz |
8 GB |
RHEL 6.1 |
Virtual |
NO |
| Rational Quality Manager (RQM) Server 5.0 |
IBM System X3550 M4* |
Intel ® Xeon CPU ES-26900 |
4 |
2.899 GHz |
8 GB |
RHEL 6.1 |
Virtual |
NO |
| Rhapsody Design Manager (RDM) Server 5.0 |
IBM System X3550 M4* |
Intel ® Xeon CPU ES-26900 |
4 |
2.899 GHz |
8 GB |
RHEL 6.1 |
Virtual |
NO |
| DOORS Server 9.6.0.0 |
IBM System X3550 M4* |
Intel ® Xeon CPU ES-26900 |
4 |
2.899 GHz |
8 GB |
RHEL 6.1 |
Virtual |
NO |
| DOORS Interop Server 9.6.0.0 |
IBM System X3550 M4* |
Intel ® Xeon CPU ES-26900 |
4 |
2.899 GHz |
8 GB |
RHEL 6.1 |
Virtual |
NO |
| DOORS Web Access (DWA) Server 9.6.0.0 |
IBM System X3550 M4* |
Intel ® Xeon CPU ES-26900 |
4 |
2.899 GHz |
8 GB |
RHEL 6.1 |
Virtual |
NO |
| Rhapsody Client |
IBM System X3690 X5* |
Intel ® Xeon CPU E7-8837 |
4 |
2.659 GHz |
8 GB |
Windows 2008 |
Virtual |
NO |
| DOORS Client |
IBM System X3690 X5* |
Intel ® Xeon CPU E7-8837 |
4 |
2.659 GHz |
8 GB |
Windows 2008 |
Virtual |
NO |
Please note: SSD have been used for the RELM and LQE servers in this configuration
Network connectivity
There are two aspects to network connectivity: connectivity between the RELM application and database server and connectivity between the RELM server and the end users. The recommendation for network connectivity in dual-tier configurations of the RELM environment is to minimize latency between the application server and database server (no more than 1-2 ms) and to have the servers located on the same subnet. When using external storage solutions, the recommendation is to minimize connectivity latencies, with the optimal configuration being fibre attached Storage Area Network (SAN) storage.
Disks
For larger configuration, the use of fibre attached SAN storage is recommended but not required. For the RELM and LQE servers you could consider using SSD drives, but it depends whether your environment will easily support them. For your database server, be sure to review the recommendations from your database vendor when considering how to map the RELM database tables to storage devices.
Methodology
LQE settings
ACP Check Disabled: True
Stack Suspension Enabled: True
Suspend Timeout: 4500
Maximum Pending Writebacks: 750
Query History: 1000
Clustered LQE environment using Nginx server as a proxy, Number of Nodes: 2
LQE pre-test conditions and post-test conditions
|
Condition |
Pre-test |
Post-test |
| Size of dataset on disk, on the LQE server |
2 GB |
4 GB |
| Number of RDF elements |
203611 |
227019 |
| Number of graphs and average of the number of triples in a graph |
203611 graphs and 20 triples per graph |
227019 graphs and 20 triples per graph |
Workload characterization
The workload is broken down into three parts:
- The RELM workload
- Queries happening into LQE
- Updates happening into LQE.
The RELM workload was generated with 250 active users performing an average of 1.5 user transactions-per-second over a 10-hour period, the workload was spread across various user operations that are possible in RELM. The operations have been elaborated in the section
.
The queries happening into LQE have also been factored into the RELM workload mentioned above. The total updates happening into LQE are simulated by updates happening not only from RELM into LQE but also happening from other tools of the SSE including RTC, RQM, RDM and DOORS. Please note that the updates happening from RTC, RQM, RDM and DOORS into LQE are performed programmatically as a single user in each of these tools and not with web browsers and multiple users in these tools. In this test the total updates happening into LQE were 2150 updates/hour and the total number of queries against LQE was 4000 queries/hour.
Results
Average CPU utilization and memory
|
Server |
Total Average CPU % Usage |
Total Average Memory Usage |
| RELM |
7% |
26% |
| LQE |
10% |
53% |
| JTS |
3% |
19% |
Scenario details and average response times
The table below provides test scenario details and the average response time for the various RELM operations during the test. We used Rational Performance Tester (RPT) to simulate a workload normally generated by end-users. All response times listed are those measured by our automated tooling and not a browser client.
|
Operation |
Percentage of workload |
Scenario details |
Operations per hour |
Average resonse time in seconds |
| Products |
16% |
This scenario involved creating a product hierarchy 5 levels deep, Adding 10 artifact and 10 URL links to each level of the hierarchy, Checking in the product hierarchy, Creating a branch of the product hierarchy, Editing and adding properties to the branch and Replacing the branch. |
240 products/hour; 2400 artifacts/hour; 2400 URLs/hour |
products 4.2; artifacts 8.16; URLs 0.89 |
| Views |
36% |
The scenario involved executing a View including 20 queries. |
180 views/hour |
1.40 |
| Impact Analysis |
20% |
The scenario involved running a saved Impact Analysis diagram on an artifact resulting in 50 nodes in the impact analysis tree. |
200 IA diagrams/hour |
3.66 |
| Query |
22% |
The queries involved executing two queries 1) Find all the artifacts which have changed in the last one hour 2) Find all the artifacts owned by a user. |
220 queries/hour |
4.64 |
| Idle Users |
6% |
Users does login operations and be idle |
login operation |
|
Appendix A
The following WAS settings were configured during the tests.
|
Server |
JVM Heap Memory (min) |
JVM Heap Memory (max) |
Default threads |
Web Container Threads |
Connection Pool |
| RELM |
4 GB |
24 GB |
400 |
400 |
400 |
| LQE |
4 GB |
12 GB |
400 |
400 |
200 |
| JTS |
4 GB |
12 GB |
400 |
400 |
200 |
Appendix B: Design considerations
Tomcat and WebSphere Application Server (WAS) Configurations
While RELM is pre-configured with Tomcat out of the box, which is good for evaluation and smaller deployments, we recommend using WebSphere Application Server (WAS) for departmental and enterprise deployments. WAS does provide flexibility for creating multiple profiles, has built-in configurable reverse proxy, and provides full support for Single Sign-On (SSO) whether the applications are all in one server, or distributed amongs multiple machines for better scalability; WAS also offers an out of the box administration user interface for installing; stopping and (re)starting applications, configuring Java virtual machine properties, security, etc.
The standard (SSE-E3) Enterprise distributed Red Hat Enterprise Linux (RHEL) with DB2 topology has RELM, LQE and JTS configured on WAS.
RAM
Heap memory and native memory
The Lifecycle Query Engine (LQE) application makes use of two kinds of memory: heap memory and native memory. Heap memory is allocated via the JVM properties and is used by LQE for various heap allocations. Native memory is allocated on demand by the operating system and is used by LQE to load the index into the memory. The amount of RAM needed on a system, for efficient functioning of LQE, should be calculated based upon heap and native memory projections.
- The JVM heap size for LQE should be 4 GB or greater. For dataset sizes (sum of the size of the indexTdb and textIndex folders on the hard drive) greater than 16 GB, the heap size should be 25% of dataset size. For example if the estimated size of dataset on the disk is 20 GB, heap allocation should be at least 5 GB (25% of 20 GB)
- In addition to JVM heap allocation, there should be sufficient free memory available to load the dataset into memory. For example, if the estimated indexed dataset is 16 GB on the disk, there should be at least 16 GB of free memory available in addition to 4 GB of JVM heap allocation. In this case, the total memory reserved for LQE should be at least 20 GB.
Examples:
- Estimated dataset size on disk = 12 GB Total reserved memory for LQE = 4 GB heap + 12 GB native = 16 GB
- Estimated dataset size on disk = 20 GB Total reserved memory for LQE = 25% of 20 GB heap + 20 GB native = 25 GB
Reserved memory for LQE should be in addition to memory required by the operating system and other processes.
Estimating the size of the dataset
As discussed above, determining the amount of RAM to be allocated for LQE on a system requires estimating the size of the dataset. The size of the dataset is dependent on the amount of the data indexed by LQE. For example if a RTC Work items TRS was indexed by LQE, the indexTdb folder may take anywhere from 1.5 GB to 3 GB space on the disk depending on the amount of content in each work item. The textIndex folder may take between 500 MB and 1 GB on the disk. Thus the total size of the dataset (size of indexTdb + size of textIndex) could range from 2 GB to 4 GB on the disk.
Configuring JVM heap
- The JVM minimum heap size should be set to 1 GB using the
-Xms1G JVM property
- The JVM maximum heap size can be configured by using the
-Xmx JVM property. For example, if the estimated heap size (as determined based on the guidance above) is 4 GB, it can be configured as -Xmx4G.
Query performance and scalability
Query performance and scalability depends upon many factors: CPU processing capability, RAM capacity, hard drive read/write speeds, network latency, indexed dataset size, data complexity, and query optimization.
- Increased CPU capacity can increase query execution performance
- Increased RAM capacity can improve in-memory computations and can prevent potential memory constraints
- Solid State Drives can reduce read and write times
- Reduced network latency can improves ACP check response times
- Indexed dataset size can make a significant difference, usually due to the increased number of nodes to traverse in queries
- All queries should be optimized by reducing the result set earlier in the query structure. Query response times should target less than 100 milliseconds (ms) for optimum scaling in larger datasets. The query can be restructured for optimum efficiency by understanding the data structures.
- Having multiple nodes by setting up clustered LQE environment using Nginx server as a proxy can increase query execution performance.
Indexing Performance
Indexing performance depends on several factors: CPU processing capability, hard drive read/write speeds, and network latency. LQE is a highly concurrent web application and optimally uses multi-core CPUs for parallel processing. Since the index is written to a hard drive, the hard drive should be optimally capable of fast read/write speeds. When LQE indexes a data provider, there should be optimum networking capability for LQE and the data provider to send and receive http messages.
For best indexing performance, it is recommended:
- LQE should be deployed on servers with CPUs which have clock speeds greater than 2 GHz (faster CPUs increase indexing performance)
- LQE should be deployed on servers with multi-core CPUs to increase the capacity for concurrent processing
- LQE should be deployed on servers with Solid State Drives (SSD) drives when possible to increase indexing performance (Solid State Drives can increase indexing performance by a factor of 2 times)
- LQE should be deployed with other data providers on the same network subsystems for faster indexing performance
About the authors
Aanjan Hari is Test Lead for RELM and VVC working from India Software Labs Bangalore. He can be reached at aanjanhari@in.ibm.com
Questions and comments:
- What other performance information would you like to see here?
- Do you have performance scenarios to share?
- Do you have scenarios that are not addressed in documentation?
- Where are you having problems in performance?
Warning: Can't find topic Deployment.PerformanceDatasheetReaderComments