Rational Team Concert For IBMi Features Performance Comparison Between Releases
Authors: LuLu SuHui Date: June 30th, 2015 Build basis: Rational Team Concert for IBMi 5.0.2, 6.0, 6.0.1Introduction
This report compares the performance of RTC for IBMi features(Package, Deploy and Promotion) between releases since v5.0.2 until v6.0.1. Generally constant performance improvements are made into releases of RTC for IBMi. The objective of this report is to present the improvements. The performance data provided is obtained by benchmark test of each release. Currently the report includes only the build information.Disclaimer
The information in this document is distributed AS IS. The use of this information or the implementation of any of these techniques is a customer responsibility and depends on the customers ability to evaluate and integrate them into the customers operational environment. While each item may have been reviewed by IBM for accuracy in a specific situation, there is no guarantee that the same or similar results will be obtained elsewhere. Customers attempting to adapt these techniques to their own environments do so at their own risk. Any pointers in this publication to external Web sites are provided for convenience only and do not in any manner serve as an endorsement of these Web sites. Any performance data contained in this document was determined in a controlled environment, and therefore, the results that may be obtained in other operating environments may vary significantly. Users of this document should verify the applicable data for their specific environment. Performance is based on measurements and projections using standard IBM benchmarks in a controlled environment. The actual throughput or performance that any user will experience will vary depending upon many factors, including considerations such as the amount of multi-programming in the users job stream, the I/O configuration, the storage configuration, and the workload processed. Therefore, no assurance can be given that an individual user will achieve results similar to those stated here. This testing was done as a way to compare and characterize the differences in performance between different versions of the product. The results shown here should thus be looked at as a comparison of the contrasting performance between different versions, and not as an absolute benchmark of performance.What our tests measure
We use predominantly automated tooling such as Rational Performance Tester (RPT) to simulate a workload normally generated by client software such as the Eclipse client or web browsers. All response times listed are those measured by our automated tooling and not a client. The diagram below describes at a very high level which aspects of the entire end-to-end experience (human end-user to server and back again) that our performance tests simulate. The tests described in this article simulate a segment of the end-to-end transaction as indicated in the middle of the diagram. Performance tests are server-side and capture response times for this segment of the transaction.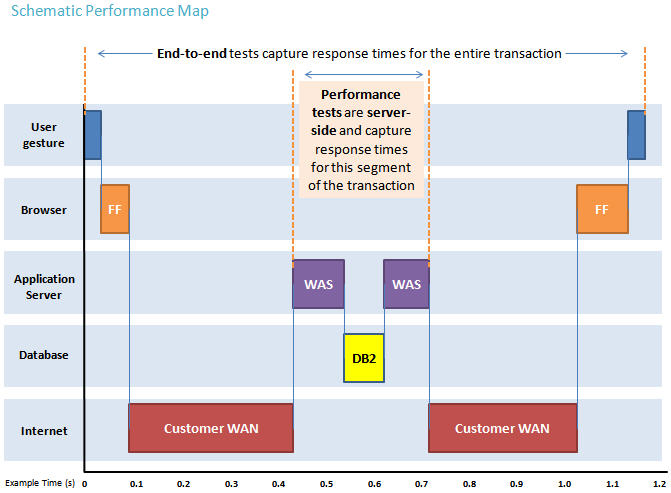
Findings
Based on following feature test data, we can get following summaries of RTC EE features from 5.0.2 to 6.0:- Performance of 'Promotion' feature has improved significantly (76%) from v5.0.2 to v6.0.
- Performance of 'Deploy' feature has improved slightly.
- Performance of 'Package' feature is stable.
*From 5.0.2 to 6.0, promotion time has improved by 80%
- 'Generating list of binaries to promote' activity is the most notable improvement of 80% in v6.0.
- 'Promote' activity is improved of 62% in v6.0.
- 'Finalize build maps' is improved of 93% in v6.0.
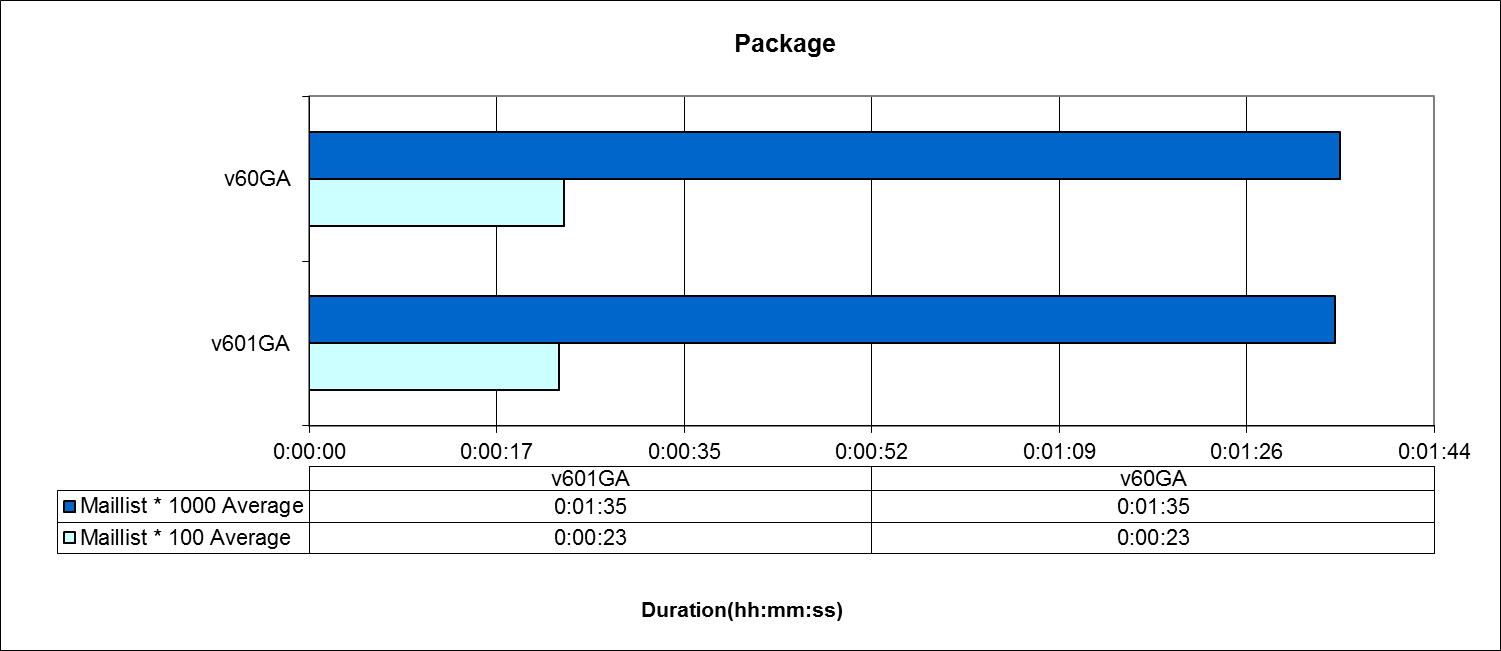
From 6.0 to 6.0.1, the performance of RTC EE features is stable.
Topology
The tests are executed in a Single Tier Topology infrastructure like the one in the following diagram:Single Tier Topology: IBMi
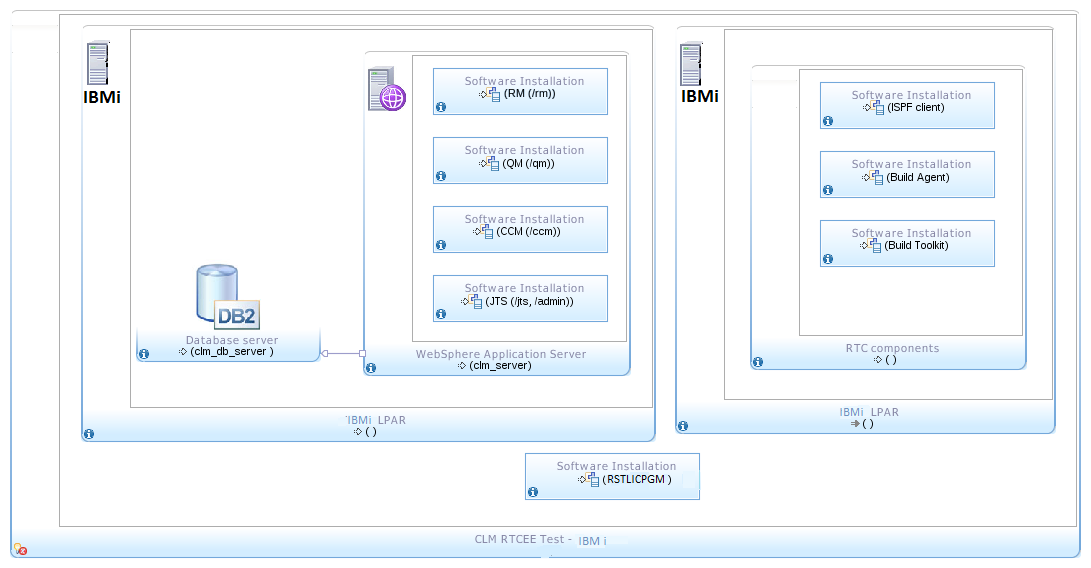 The RTC server was set up based on WebSphere and DB2 on IBMi. The build machine with Rational Build Agent was on IBMi.
| Test Environment | ||
|---|---|---|
| RTC Server | Operating System & Version: IBMi v7.1 System Resource : 4 dedicated processors, 30GB memory CLM: from 5.0.2 GA to 6.0.1 GA, 6 GB heap size DB2: DB2 for IBMi v7.1 WAS: 8.5.5.3(from 5.0.2 GA to 6.0 GA), 8.5.5.7(from 6.0GA to 6.0.1 GA) | |
| Build Forge Agent | Operating System & Version: IBMi v7.1 System Resource: 4 dedicated processors, 30GB memory Build System Toolkit: from 5.0.2 GA to 6.0.1 GA |
Methodology
Build time and individual activity time are compared by getting test start date and time. The sample projects for the test are:- Maillist Application *100
- Maillist Application *1000
| Test Data | ||
|---|---|---|
| Sample Project | Maillist *100 | Maillist *1000 |
| Assets | 500 RPGLE 200 SRVPGM 100 PGMSRC 4 DSPF 4 LF 2 PF 6 CLLE 1 * CLP |
5000 RPGLE 2000 SRVPGM 1000 PGMSRC 4 DSPF 4 LF 2 PF 6 CLLE 1 * CLP |
| Total Assets | 817 | 8017 |
Results
Note : since 6.0.1 benchmark , we have replaced our IBMi performance testing LPARs and new performance baselines are created. 6.0 benchmark have been re-run to compare on identical hardware.Run duration
Below charts show run duration comparing from 5.0.2 to 6.0, and from v6.0 to v6.0.1 of each EE feature, and each feature of EE are run twice against each release and the average time is taken for comparison. Package: From below 'Package' feature runtime chart, each release has similar runtime duration, no big improvement in this feature, but this feature is stable.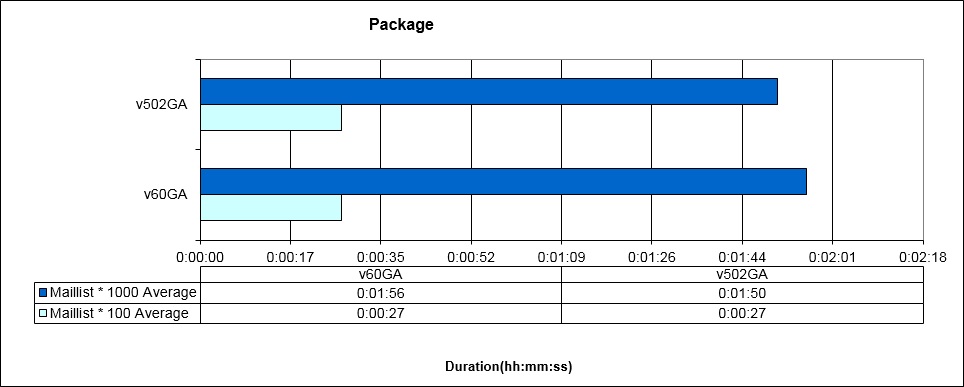
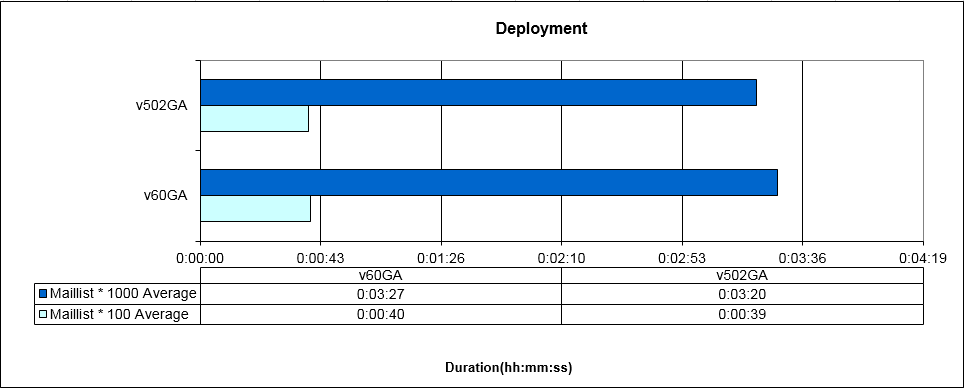
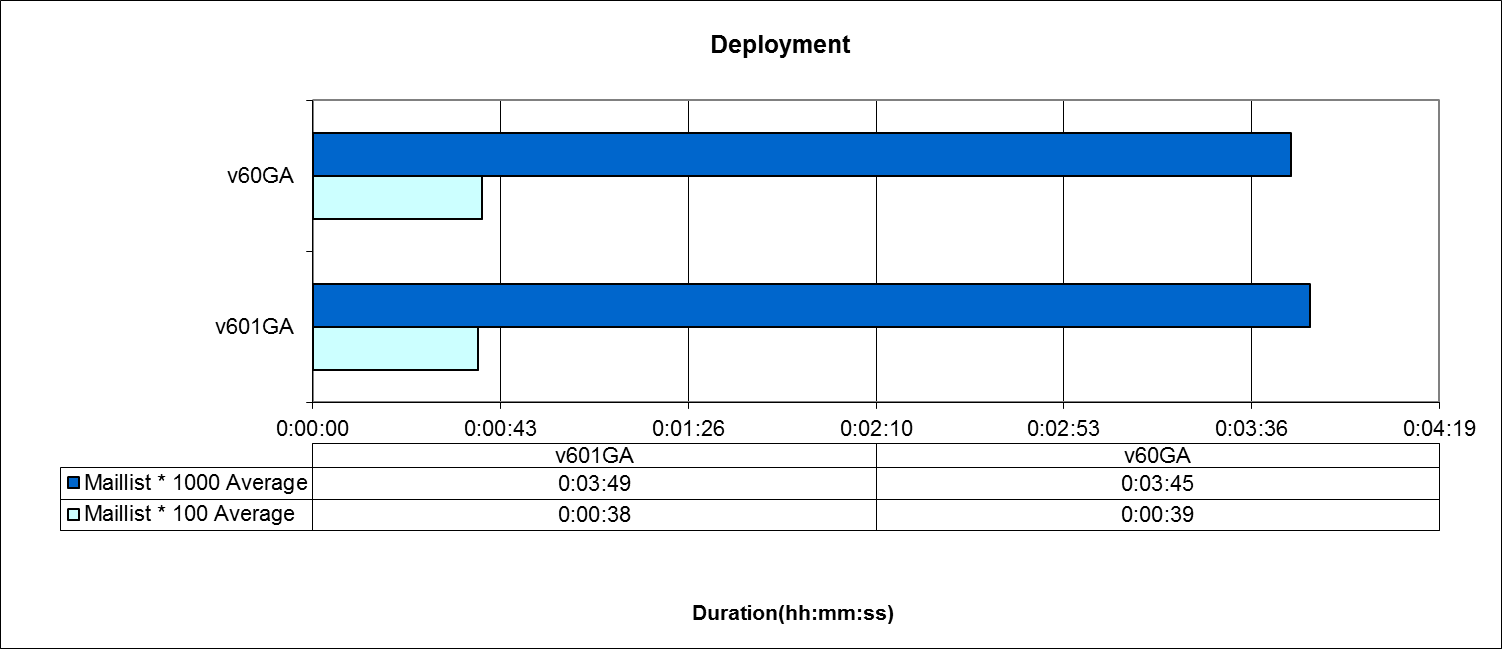
 Deploy:
From below 'Deploy' feature runtime chart, it stay consistent from v5.0.2 to v6.0.1.
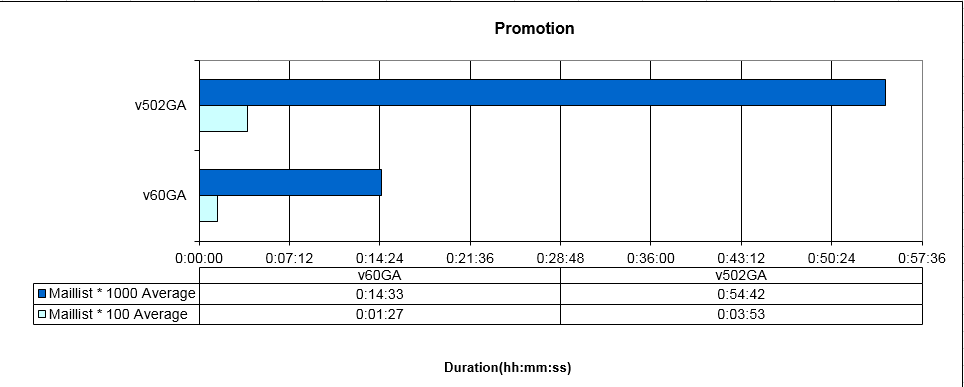
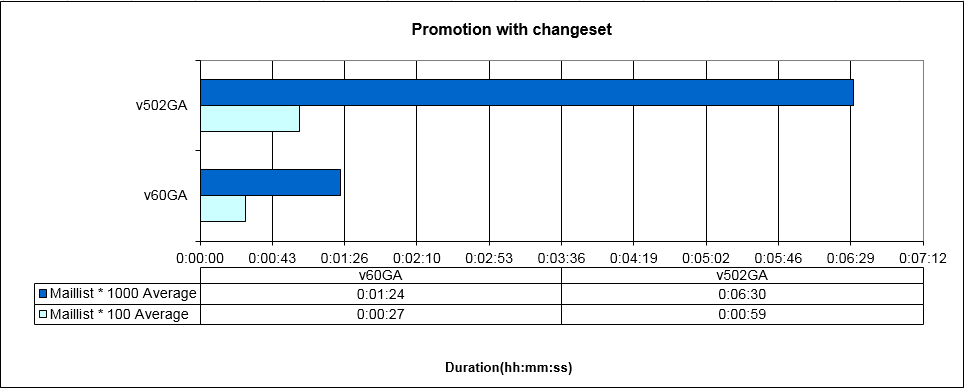
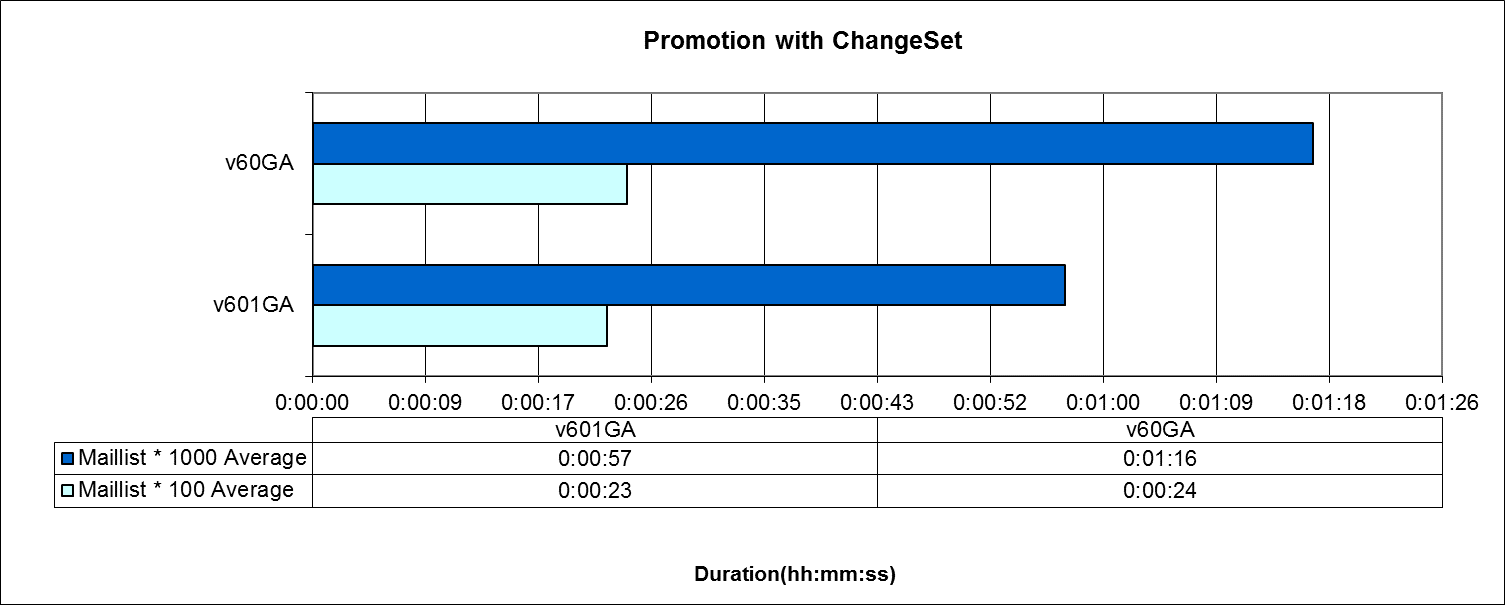
 Promotion:
From below 'Promotion' feature runtime chart, this feature is continuous improved release by release, it has been improved 80%. For the release by release comparison, it improved by 80% from 5.0.2 to 6.0.

Build Activities
Display all feature test results in one comparison table is too large, so separate into 3 comparison tables and link to other page. For EE feature test results, they are divided into following 3 comparison tables, please navigate to linked page for detailed results.Appendix A - Key Tuning Parameters
| Product |
Version | Highlights for configurations under test |
|---|---|---|
| IBM WebSphere Application Server | 8.5.5.3 (5.0.2GA to 6.0GA), 8.5.5.7(from 6.0GA to 6.0.1 GA) | JVM settings:
* GC policy and arguments, max and init heap sizes:
-Xmn768m -Xgcpolicy:gencon -Xcompressedrefs -Xgc:preferredHeapBase=0x200000000 -Xmx6g -Xms6g |
| DB2 | DB2 Enterprise Server for IBMi v7.1 | Tablespace is stored on the same machine as IBM WebSphere Application Server |
| License Server | Same as CLM version | Hosted locally by JTS server |
| Network | Shared subnet within test lab |
About the authors
LuLu, SuHuiQuestions and comments:
- What other performance information would you like to see here?
- Do you have performance scenarios to share?
- Do you have scenarios that are not addressed in documentation?
- Where are you having problems in performance?
Contributions are governed by our Terms of Use. Please read the following disclaimer.
Dashboards and work items are no longer publicly available, so some links may be invalid. We now provide similar information through other means. Learn more here.