Introduction
We have one escalation from customer that reported the DCC has serious performance issue. I setup one test environment and reproduced the problem. From my test results shown, the performance of DCC on Oracle is about 10 times slower than that on DB2. By the performance tuning and bug fix, the performance of DCC on Oracle improved about 10 times.
We should do some tuning on Oracle DB for the typical application of ETL load. ETL load is one typical behavior that delivers huge data into data base without any interrupt. We can call that as bulk loads. The large bulk load brings many challenges to the maintenance of DB and the big I/O contention.
And the DCC also consider how to improve the query to do surrogate key lookups. The most significant problem is the improper SQL where condition is null checking is used in the lookup checking. By minimizing the is null SQL checking, the performance will be improved significantly.
The DCC ETL is a typical bulk loads (A.K.A batch loads), which deliver big number of rows into the tables and indexes, that will impact the statistics info of the table and index significantly. The Statistics info is the key information to help DB to do the optimized operations. Gathering the statistics is a key tuning factor for the typical bulk loads. So we should determine what frequency of the statistics gathering is the best timeslot to reach the optimal performance.
Methodology
The testing is based on 3 CLM repositories with the same data volume which are generated using data population tool and use DCC server. The testing is target to measure the ETL duration on the specific configuration. The ETL Performance improvement means the ETL duration reduce. By tuning some configuration of OS, Oracle db and DCC configuration, we try to improve the performance of DCC on Oracle Server.
Tuning Guide
OS Part
Oracle has many prerequisites for the OS kernel. Before setup Oracle Server, I have done the responding setting on the RHLE kernel according to the Oracle installation document
http://docs.oracle.com/cd/E11882_01/install.112/e24325/toc.htm#CEGHFFGG
Oracle Part
- Avoid I/O Contention between Log File and Data file
DCC load is typical bulk loads that will have huge insert and update operations. As Insert and Update operations coming, the DB will write the Redo log first. When the commit operation happened, the DB will write the data into the data file. DCC will do the concurrent data load into the DB. There are many processes to write to Redo log and data file. The IOPS for Redo log and data file are similar. The concurrent write must bring stress to the I/O.
So we should separate the Redo Log and data file on to different storage devices. From the performance tuning, the following steps have been done:
1. Put the REDO log files and UNDO table space files onto separated disk. I put the redo log and undo table space files onto one high performance disks (RAID5(8disks), Write back policy).
2. Create more REDO LOG Group so that the redo log can get one inactive log group without waiting. From my test env, I created 6 redo log group, 200M per log file. And then I increase the LOG_BUFFER size to 50M . Make sure there is at least one REDO FILE which status is inactive anytime. The sample command:
> ALTER DATABASE ADD LOGFILE GROUP 4 ('/mnt/fileServer/OraFileLog/redo04.log') SIZE 200M;
3. Increate the Undo LOG table space size. From my test env, I created more files in the table space and increased the table space to 2G.
With synchronous I/O, when an I/O request is submitted to the operating system, the writing process is blocked until the write is confirmed as complete noticed by the OS. Then it can be continue. With asynchronous I/O, processing continues while the I/O request is submitted and processed. Use asynchronous I/O when possible to avoid bottleneck. DB application always is less response time better. Asynchronous I/O can help improve the CPU parallelism of disk write and computing.
To enable the asynchronous I/O, you should check if the host OS supports the asynchronous I/O. In this performance tuning, the host OS is
RHEL6U2, you can check the RHEL install the aio packages:
1. Check RPM package :
> rpm -qa | grep aio
2. Check Linux:
> cat /proc/slabinfo | grep kio
The 2nd and 3rd column return non-zero value.
3. Check if Oracle support AIO:
> /usr/bin/ldd $ORACLE_HOME/bin/oracle | grep libaio
libaio.so.1 => /usr/lib64/libaio.so.1 (0x00002aaaac4a9000)
> /usr/bin/nm $ORACLE_HOME/bin/oracle | grep io_getevent
Thus, you should enable the ORACLE parameter to support asynchronous I/O:
>alter system set filesystemio_options=setall scope=spfile;
>alter system set disk_asynch_io=TRUE scope=spfile;
Data Warehouse Part
- Avoid the is Null or Is not Null where condition SQL Checking
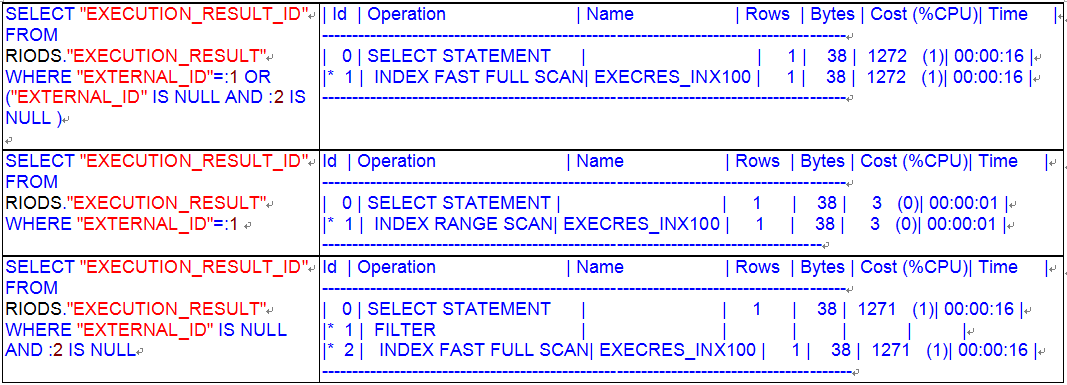
In 5.0.2 release, the problem has been fixed. From the thumb of rules, the SQL statements of Select * from table A where A.column_a is null should not happen on the data processing, even though there is one index Index_A on the column_a. In general, index wont include the key null . That situation is much worse when the column_a has little rows which value is null. When the select SQL statement executing, the DB will go through the index Index_A and try to get the null value. The explain plan of the SQL statement must be INDEX FULL SCAN. The INDEX Full Scan is very time consuming compared with Index Range scan. In our original implementation, there are huge select SQL executions, just like :
SELECT "EXECUTION_RESULT_ID" FROM RIODS."EXECUTION_RESULT" WHERE "EXTERNAL_ID"=:1 OR ("EXTERNAL_ID" IS NULL AND :2 IS NULL )
Here is the performance comparison base on my test result about the SQL without is null and SQL with is null.
- Schedule Gather Statistics Job
Automatic statistics gathering should be sufficient for most database objects which are being modified at a moderate speed. However, there are cases where automatic statistics gathering may not be adequate. Because the automatic statistics gathering runs during an overnight batch window (10:00 pm-6:00 am), the statistics on tables which are significantly modified during the day may become stale. ETL is a typical bulk loading which insert/update the table significantly in a short time. DCC has the capability to insert more than 100k per hour to the data warehouse. The automatic statistics is far enough to help the DB do the optimized operations. The performance will be degrading as time goes on.
In order to update the statistics info to support DB do the optimized operations, we have to take the frequency of statistics gathering into consideration as an important plan at the beginning.
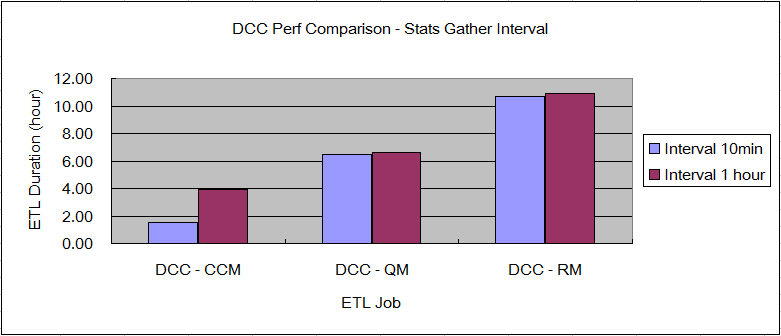
For the initial load of DCC, the data volume is huge. And the total duration will be more than 10 hours if your data set is big enough. If there is no proactive statistics gathering, the performance would be degraded significantly. You are encouraged to estimate the duration of your DCC (Initial Load and Delta Load). And set the interval of statistics gathering as 10% of total duration. From my initial load testing with huge data, the total duration of CCM part is 1.5 hours, so I set the interval as 10 minutes. Here is one sample performance comparison for the different statistics gathering interval. From the chart shown, the performance of CCM has big impact for the two different statistics gathering. The reason is the 1 hour interval is too big for the total duration of CCM data loading.
Sample steps:
1. Log on the enterprise console using sysdba
2. Open the Server tab page, and find the Jobs.
3. Create one job to run SQL Scripts:
exec dbms_stats.gather_schema_stats(ownname => 'RICALM', options=>'GATHER' ,estimate_percent =>DBMS_STATS.AUTO_SAMPLE_SIZE ,degree => DBMS_STATS.AUTO_DEGREE,cascade =>TRUE );
exec dbms_stats.gather_schema_stats(ownname => 'RIODS', options=>'GATHER' ,estimate_percent =>DBMS_STATS.AUTO_SAMPLE_SIZE ,degree => DBMS_STATS.AUTO_DEGREE,cascade =>TRUE );
4. Schedule the execution as repeating per each 10 minutes.
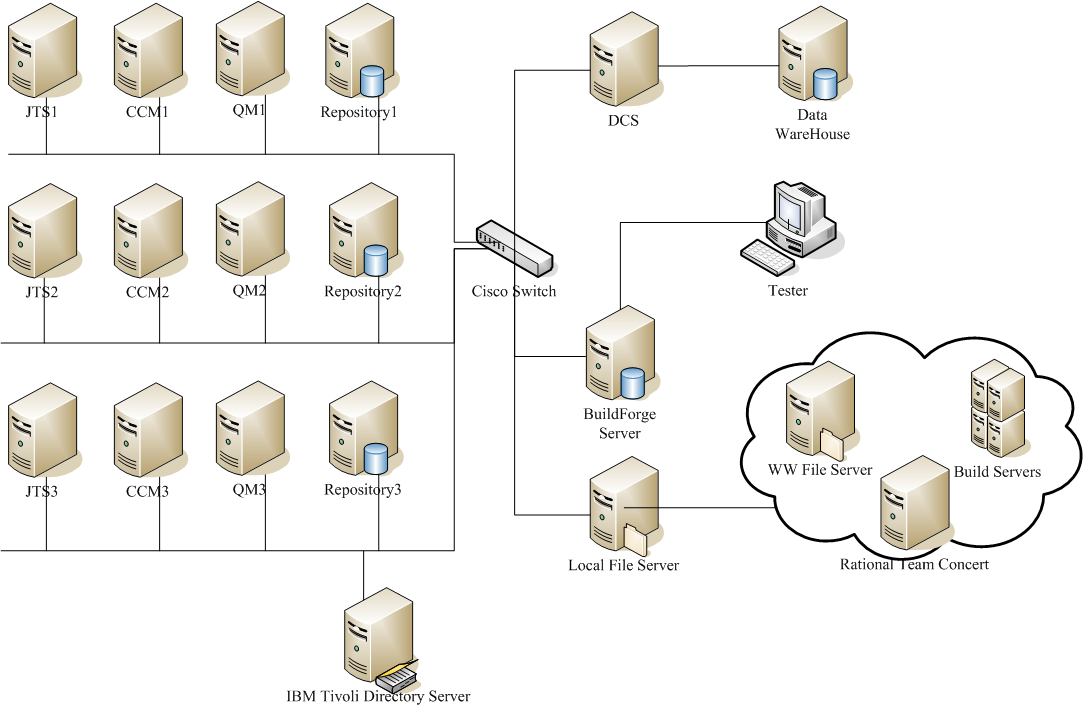
Topology
The topology under test is based on
Standard Topology (E1) Enterprise - Distributed / Linux / DB2.
The specifications of machines under test are listed in the table below. Server tuning details are listed in
Appendix A
Test data was generated using automation. The test environment for the latest release was upgraded from the earlier one by using the CLM upgrade process. Please see the system configuration in the under table.
And refer to the server tuning details listed in
Appendix A
IBM Tivoli Directory Server was used for managing user authentication.
| Function |
Number of Machines |
Machine Type |
CPU / Machine |
Total # of CPU Cores/Machine |
Memory/Machine |
Disk |
Disk capacity |
Network interface |
OS and Version |
| ESX Server |
2 |
IBM X3550 M3 7944J2A |
1 x Intel Xeon E5-2640 2.5 GHz (six-core) |
12 vCPU |
48GB |
RAID0 SAS x3 300G 10k rpm |
900G |
Gigabit Ethernet |
ESXi5.1 |
| ESX Server2 |
1 |
IBM X3650 M3 |
2 x Intel Xeon x5680 3.3GHz (six-core) |
24 vCPU |
191GB |
RAID5 SAS x8 300G 10k rpm |
2T |
Gigabit Ethernet |
ESXi5.1 |
| ESX Server3 |
1 |
IBM X3650 M4 |
2 x Intel Xeon x5680 3.3GHz (12-core) |
48 vCPU |
196GB |
RAID5 SAS x8 900G 10k rpm |
5.7T |
Gigabit Ethernet |
ESXi5.1 |
| JTS/RM Server |
3 |
VM on IBM System x3550 M3 |
|
4 vCPU |
16GB |
|
120G |
Gigabit Ethernet |
Red Hat Enterprise Linux Server release 6.2 |
| CLM Database Server |
3 |
VM on IBM System x3650 M3 |
|
8 vCPU |
16GB |
|
120G |
Gigabit Ethernet |
Red Hat Enterprise Linux Server release 6.2 |
| CCM Server |
3 |
VM on IBM System x3550 M3 |
|
4 vCPU |
16GB |
|
120G |
Gigabit Ethernet |
Red Hat Enterprise Linux Server release 6.2 |
| QM Server |
3 |
VM on IBM System x3550 M3 |
|
4 vCPU |
16GB |
|
120G |
Gigabit Ethernet |
Red Hat Enterprise Linux Server release 6.2 |
| CLM DCC Server |
1 |
VM on IBM System x3650 M4 |
|
16 vCPU |
16GB |
|
120G |
Gigabit Ethernet |
Red Hat Enterprise Linux Server release 6.2 |
| Data Warehouse Server |
1 |
VM on IBM System x3650 M3 |
|
8 vCPU |
16GB |
|
120G |
Gigabit Ethernet |
Red Hat Enterprise Linux Server release 6.2 |
Data volume and shape
The data volume listed in
Appendix B
Network connectivity
All server machines and test clients are located on the same subnet. The LAN has 1000 Mbps of maximum bandwidth and less than 0.3 ms latency in ping.
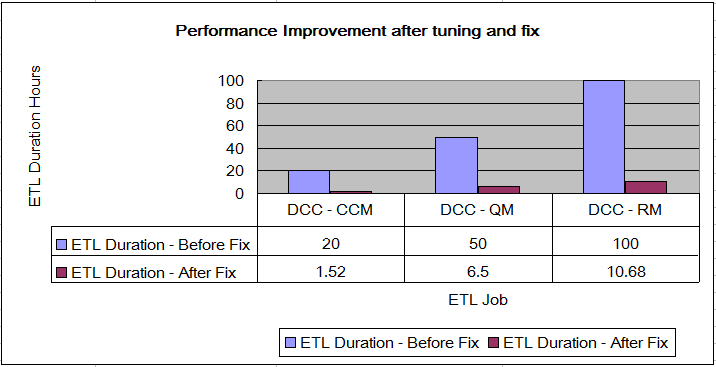
Results
After tuning and bug fix, the performance of DCC on Oracle Server has been improved about 10 times.
Appendix A - Server Tuning Details
Product
|
Version |
Highlights for configurations under test |
| DCC |
* |
DCC Data Collection Properties:
- Data Collection Thread Size = 100
- OS max number of open files set as 65536
- OS max number of processes set as 65536
|
| Data warehouse |
Oracle 11gR2 |
|
| IBM WebSphere Application Server |
8.5.0.1 |
JVM settings:
- GC policy and arguments, max and init heap sizes:
-verbose:gc -XX:+PrintGCDetails -Xverbosegclog:gc.log -Xgcpolicy:gencon
-Xmx8g -Xms8g -Xmn1g -Xcompressedrefs -Xgc:preferredHeapBase=0x100000000
-XX:MaxDirectMemorySize=1g
|
| LDAP server |
IBM Tivoli Directory Server 6.3 |
|
| License server |
|
Hosted locally by JTS server |
| Network |
|
Shared subnet within test lab |
Appendix B - Data Volume and Shape
|
Record type |
Record Per Repository |
Total Count for 3 repositories |
| CCM |
APT_ProjectCapacity |
1 |
3 |
| |
Project |
1 |
3 |
| |
APT_TeamCapacity |
0 |
0 |
| |
Build |
0 |
0 |
| |
Build Result |
0 |
0 |
| |
Build Unit Test Result |
0 |
0 |
| |
Build Unit Test Events |
0 |
0 |
| |
Complex CustomAttribute |
0 |
0 |
| |
Custom Attribute |
0 |
0 |
| |
File Classification |
3 |
9 |
| |
First Stream Classification |
3 |
9 |
| |
History Custom Attribute |
0 |
0 |
| |
SCM Component |
2 |
6 |
| |
SCM WorkSpace |
2 |
6 |
| |
WorkItem |
100026 |
300078 |
| |
WorkItem Approval |
100000 |
300000 |
| |
WorkItem Dimension Approval Description |
100000 |
300000 |
| |
WorkItem Dimension |
3 |
9 |
| |
WorkItem Dimension Approval Type |
3 |
9 |
| |
WorkItem Dimension Category |
2 |
6 |
| |
WorkItem Dimension Deliverable |
0 |
0 |
| |
WorkItem Dimension Enumeration |
34 |
102 |
| |
WorkItem Dimension Resolution |
18 |
54 |
| |
Dimension |
68 |
204 |
| |
WorkItem Dimension Type |
8 |
24 |
| |
WorkItem Hierarchy |
0 |
0 |
|
WorkItem History |
282369 |
847107 |
| |
WorkItem History Complex Custom Attribute |
0 |
0 |
| |
WorkItem Link |
101014 |
303042 |
| |
WorkItem Type Mapping |
4 |
12 |
| RM |
CrossAppLink |
136 |
408 |
| |
Custom Attribute |
2173181 |
6519543 |
| |
Requirement |
634432 |
1903296 |
| |
Collection Requirement Lookup |
0 |
0 |
| |
Module Requirement Lookup |
306000 |
918000 |
| |
Implemented BY |
0 |
0 |
| |
Request Affected |
0 |
0 |
| |
Request Tracking |
0 |
0 |
| |
REQUICOL_TESTPLAN_LOOKUP |
0 |
0 |
| |
REQUIREMENT_TESTCASE_LOOKUP |
0 |
0 |
| |
REQUIREMENT_SCRIPTSTEP_LOOKUP |
0 |
0 |
| |
REQUIREMENT_HIERARCHY |
0 |
0 |
| |
REQUIREMENT_EXTERNAL_LINK |
0 |
0 |
| |
RequirementsHierarchyParent |
31610 |
94830 |
| |
Attribute Define |
10 |
30 |
| |
Requirement Link Type |
176 |
528 |
| |
Requirement Type |
203 |
609 |
| QM |
Record type |
|
Record Per Repository |
Total Count for 3 repositories |
| TestScript | | 0 | 0 |
| BuildRecord | | 20000 | 60000 |
| Category | | 520 | 1560 |
| CategoryType | | 120 | 360 |
| Current log of Test Suite | | 6000 | 18000 |
| EWICustomAttribute | | 0 | 0 |
| EWIRelaLookup | | | |
| | CONFIG_EXECUTIONWORKITM_LOOKUP | 0 | 0 |
| | EXECWORKITEM_REQUEST_LOOKUP | 0 | 0 |
| | EXECWORKITEM_ITERATION_LOOKUP | 180000 | 540000 |
| | EXECWORKITEM_CATEGORY_LOOKUP | 0 | 0 |
| ExecResRelaLookup | | | |
| | EXECRES_EXECWKITEM_LOOKUP | 540000 | 1620000 |
| | EXECRES_REQUEST_LOOKUP | 60000 | 180000 |
| | EXECRESULT_CATEGORY_LOOKUP | 0 | 0 |
| | EXECUTION_STEP_RESULT | 0 | 0 |
| ExecStepResRequestLookup | | 0 | 0 |
| ExecutionResult | | 540000 | 1620000 |
| ExecutionStepResult | | 0 | 0 |
| ExecutionWorkItem | | 180000 | 540000 |
| Job | | 0 | 0 |
| JobResult | | 0 | 0 |
| KeyWord | | 0 | 0 |
| KeyWordTestScriptLookup | | 0 | 0 |
| LabRequestChangeState | | 0 | 0 |
| LabRequest | | 2520 | 7560 |
| LabResource | | 24000 | 72000 |
| Objective | | 0 | 0 |
| Priority | | 4 | 0 |
| RemoteScript | | 0 | 0 |
| Requirement | | 0 | 0 |
| Reservation | | 32000 | 96000 |
| ReservationRequestLookup | | 30 | 90 |
| ResourceGroup | | 0 | 0 |
| ScriptStep_Rela_Lookup | | 240000 | 720000 |
| State | | 240 | 720 |
| StateGroup | | 60 | 180 |
| TestCase | | 60000 | 60000 |
| TestCaseCustomAttribute | | 0 | 0 |
| TestCaseRelaLookup | | | |
| | TESTCASE_RemoteTESTSCRIPT_LOOKUP | 0 | 0 |
| | TESTCASE_TESTSCRIPT_LOOKUP | 60000 | 180000 |
| | TESTCASE_CATEGORY_LOOKUP | 161060 | 483180 |
| | REQUIREMENT_TESTCASE_LOOKUP | 60000 | 180000 |
| | REQUEST_TESTCASE_LOOKUP | 60000 | 180000 |
| | TestCase RelatedRequest Lookup | 0 | 0 |
| TestEnvironment | | 4000 | 12000 |
| TestPhase | | 1200 | 3600 |
| TestPlan | | 110 | 330 |
| TestPlanObjectiveStatus | | 0 | 0 |
| TestPlanRelaLookup | | | |
| | REQUIREMENT_TESTPLAN_LOOKUP | 0 | 0 |
| | TESTSUITE_TESTPLAN_LOOKUP | 6000 | 18000 |
| | TESTPLAN_CATEGORY_LOOKUP | 0 | 2 |
| | TESTPLAN_TESTCASE_LOOKUP | 60000 | 180000 |
| | TESTPLAN_OBJECTIVE_LOOKUP | 0 | 0 |
| | REQUIREMENT COLLECTION_TESTPLAN_LOOKUP | 320 | 9600 |
| | TESTPLAN_TESTPLAN_HIERARCHY | 0 | 0 |
| | TESTPLAN_ITERATION_LOOKUP | 1200 | 3600 |
| | REQUEST_TESTPLAN_LOOKUP | 0 | 0 |
| TestScript | | 60000 | 180000 |
| TestScriptRelaLookup _ Manual | | | |
| | TESTSCRIPT_CATEGORY_LOOKUP | 0 | 0 |
| | REQUEST_TESTSCRIPT_LOOKUP | 0 | 0 |
| TestScriptRelaLookup _ Remote | | 0 | 0 |
| TestScriptStep | | 240000 | 720000 |
| TestSuite | | 6000 | 18000 |
| TestSuite_CusAtt | | 0 | 0 |
| TestSuiteElement | | 90000 | 270000 |
| TestSuiteExecutionRecord | | 6000 | 18000 |
| TestSuiteLog | | 30000 | 90000 |
| TestSuiteRelaLookup | | | |
| | TESTSUITE_CATEGORY_LOOKUP | 15950 | 47850 |
| | REQUEST_TESTSUITE_LOOKUP | 0 | 0 |
| TestSuLogRelaLookup | | | |
| | TESTSUITE_TESTSUITELOG_LOOKUP | 30000 | 90000 |
| | TESTSUITELOG_EXECRESULT_LOOKUP | 213030 | 639090 |
| | TESTSUITELOG_CATEGORY_LOOKUP | 0 | 0 |
| TestSuiteExecutionRecord_CusAtt | | 6000 | 18000 |
| TSERRelaLookup | | 0 | 0 |
| | TSTSUITEXECREC_CATEGORY_LOOKUP | 0 | 0 |
| Total | | 1203023 | 3609069 |
N/A: Not applicable.
For more information
About the authors
PengPengWang
Questions and comments:
- What other performance information would you like to see here?
- Do you have performance scenarios to share?
- Do you have scenarios that are not addressed in documentation?
- Where are you having problems in performance?
Warning: Can't find topic Deployment.PerformanceDatasheetReaderComments
