LQE relational store (LQE rs) for ELM 7.0.3 is a new option for LQE storage. It is available as beta code in the initial 7.0.3 release. LQE rs can be installed in parallel to the LQE Apache Jena TBD store.
This article discusses the results of the performance testing done using the LQE relational store (LQE rs) architecture. The following topics are covered:
Here's what you can expect when adopting LQE rs:
- Improved scalability and resilience. LQE rs handles concurrent report execution more efficiently, and a single long report will no longer impact the entire LQE server.
- Equivalent or better report performance in most cases. Some reports may run longer, but there are new optimization features available for improving report performance.
- Reduced memory and CPU requirements for the LQE rs server since load shifts to the database server.
- Expect to review your database infrastructure. Ideally, deploy a new database server to support LQE rs (if your organization makes heavy use of reports).
- Incremental indexing times should be similar to LQE Jena. Full reindexing should be equivalent but may take longer depending on the load on the database server hosting LQE rs.
- The size of the LQE rs database will be roughly 50% of the size of the LQE index.
Standard disclaimer
The information in this document is distributed AS IS. The use of this information or the implementation of any of these techniques is a customer responsibility and depends on the customers ability to evaluate and integrate them into the customers operational environment. While each item may have been reviewed by IBM for accuracy in a specific situation, there is no guarantee that the same or similar results will be obtained elsewhere. Customers attempting to adapt these techniques to their own environments do so at their own risk. Any pointers in this publication to external Web sites are provided for convenience only and do not in any manner serve as an endorsement of these Web sites. Any performance data contained in this document was determined in a controlled environment, and therefore, the results that may be obtained in other operating environments may vary significantly. Users of this document should verify the applicable data for their specific environment.
Performance is based on measurements and projections using standard IBM benchmarks in a controlled environment. The actual throughput or performance that any user will experience will vary depending upon many factors, including considerations such as the amount of multi-programming in the users job stream, the I/O configuration, the storage configuration, and the workload processed. Therefore, no assurance can be given that an individual user will achieve results similar to those stated here.
This testing was done as a way to compare and characterize the differences in performance between different versions of the product. The results shown here should thus be looked at as a comparison of the contrasting performance between different versions, and not as an absolute benchmark of performance.
Architectural changes in 703
The Jazz Reporting Service is the default reporting option for the IBM® Engineering solutions. You can quickly and easily consolidate data from a variety of sources across your tools and project areas. It consists of three components: Report Builder, Data Collection Component, and Lifecycle Query Engine (LQE). This performance report focuses on the use of LQE and Report Builder.
LQE implements a Linked Lifecycle Data Index over data provided by one or more lifecycle tools. A lifecycle tool makes its data available for indexing by exposing its Linked Lifecycle Data via a Tracked Resource Set. With this index, you can build sophisticated traceability reports to understand relationships between your data (for example, find all requirements that are associated with failing test cases).
When LQE was introduced, it stored index data using
Apache Jena TDB. Reports were implemented using
SPARQL queries. The architecture is shown below:
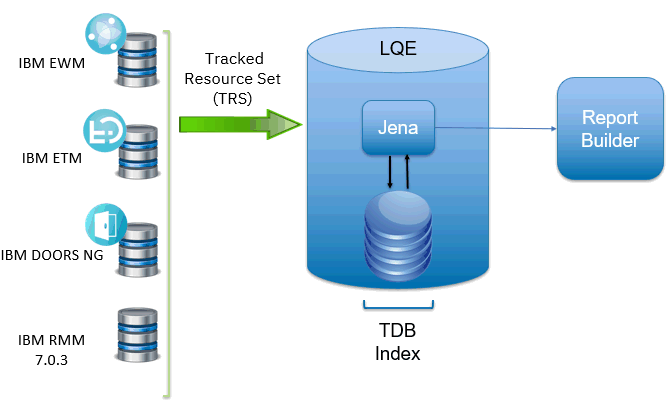
This architecture has several disadvantages for large indexes:
- The TDB index must be local to the LQE server machine, which prevents addressing scale issues through clustering
- Large Jena indexes must be almost entirely cached in memory for performance reasons, so that LQE servers require large amounts of RAM (as well as large Java heaps)
- Jena does not have a sophisticated query optimization engine, so complex traceability reports can be slow, and there are limited options to tune SPARQL queries to perform better.
An additional limitation of the Jena architecture is how it deals with load. A single long-running query can severely impact the performance of the entire LQE system. There are two reasons this happens.
- There is contention for internal resources within Jena when running queries. Too many simultaneous queries will interfere with each other, and a bottleneck is likely to form when some of those queries take a long time to run (minutes).
- Workloads that involve both query execution and indexing create contention for resources in LQE. If a query is running when indexed data is written to disk, the updated data is temporarily stored in a journal file. Jena can combine the data in the main database with the updates in the journal to present a consistent view of the state of the database at the time the query started. The journal is merged into the main database once there are no reads pending.
There are some problems with this approach. First, the journal will continue to grow as long as there are queries running. And queries will be running if the reports are slow, or if the report workload is high (i.e., many users are running reports frequently). A busy LQE server may not be idle very often, which means that the journal keeps growing. LQE tries to limit the impact by suspending indexing when the number of pending journal updates reaches a threshold, but that means that reports will include stale data until the indexing resumes.
Additionally, queries get slower as the journal grows, since Jena has to do more work to identify the correct dataset for a given report. This means there is a feedback loop where slow queries cause the journal to grow, which in turn causes the queries to be slower and then prevents the journal from being merged into the main database. This feedback loop can even be triggered by a single slow query.
Because of these disadvantages, Jena is being replaced over time with a relational database (see below).
The LQE performs several activities to build and make available its engineering knowledge graph:
- Periodically read the OSLC Tracked Resource Set (TRS) feed of each application (DOORS Next, Workflow Management, Test Management, etc.) to gather the initial set of resources from each application, as well as changes over time.
- Fetch any new or changed resources from the application.
- Store the resources in the LQE data store.
- Calculate a unified type system metamodel for all sources and data.
- Accept queries from Report Builder, Engineering Insights, or other clients and provide the requested data from the LQE data store.
LQE rs changes these activities in the following ways.
- For step 3, resources are stored in a relational database.
- For step 5, LQE rs no longer accepts queries. Queries are executed against the relational database.
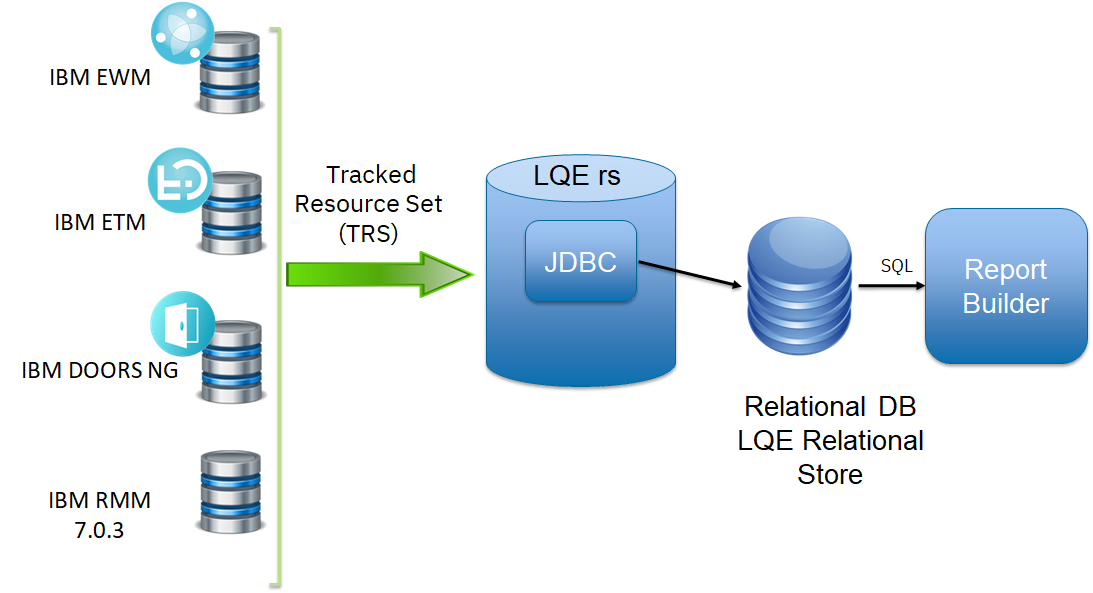
This improves the scalability of the LQE solution in several ways.
- Database optimization engines are more sophisticated than Jena, allowing for improved query execution.
- There are more options for tuning the performance of SQL queries than for SPARQL queries.
- Relational databases are designed for high data volumes
- Relational databases are much better at dealing with concurrent reading and writing. While locking is still needed, the locking usually happens at the row level. Lock escalation to the table level is not frequent, so one slow SQL query will not disrupt the entire server.
- Since query processing shifts from the LQE server to the database server in this architecture, the LQE server requires less RAM. RAM freed up from LQE can be moved to the database server where it can be used more efficiently.
- Data is represented more efficiently in the database compared to Apache Jena TDB files, saving storage space.
- Clustering becomes possible through standard database solutions like Oracle RAC
Deployment recommendations
Topology
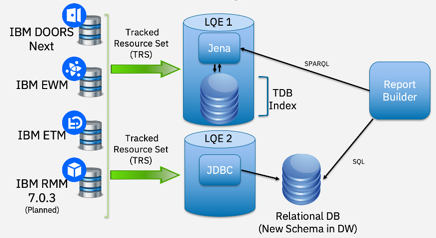
For customers with existing data, IBM's recommendation is to deploy the two LQE architectures side-by-side, keeping the LQE Jena system as is while adding an additional system to host LQE rs. A Report Builder can be configured to run both Jena and SQL queries, and even to compare the queries for correctness and performance. This allows you to transition to LQE rs with the least amount of risk. The LQE Jena system can be decommissioned after the transition is completed.
For customers just starting out with the ELM solution, IBM's recommendation is to deploy LQE rs only.
Since report execution is shifting from the LQE server to the database server, customers are advised to assess the capacity of their database servers prior to LQE rs adoption. IBM recommends deployment of a new database server that can be dedicated to hosting the LQE rs database, as LQE rs can add significant load to an existing database server (and additional memory will be required depending on the size of the LQE rs index).
Sizing recommendations
The recommendations below are based on
operating system metrics collected while applying a multi-user workload to an LQE rs system (which includes Report Builder).
| Parameter |
Minimum |
Recommended |
| LQE rs server - RAM |
48G |
96G |
| LQE rs - JVM heap |
32G |
64G |
| Report Builder server - RAM |
16G |
32G |
| Report Builder server - JVM heap |
8G |
24G |
| Report Builder server - processors |
12 |
24 |
| Database server RAM |
64G |
20% of index DB size |
| Database server processors |
16 |
32 |
| Database cache |
5% DB disk size |
10% of index DB disk size |
| Database disk size |
500G |
1TB |
The LQE rs server requires much less memory than LQE Jena. LQE Jena needed enough RAM to cache all of its indices in memory, which could be terabytes of RAM. That is not required for LQE rs, which has minimal memory and CPU usage for report execution. However, LQE rs will still use memory during indexing (and especially for reindexing), so we recommend having a JVM heap size of 64G (and 96G of total RAM).
The load on the Report Builder system does not change when using LQE rs. Report Builder now routes queries to the database instead of LQE Jena, but this does not change the Report Builder load profile.
With respect to the database, the LQE rs architecture does place more load on the database server, and the database needs to be sized appropriately. For memory, use the size of the LQE rs database on disk and allocate 10% of that to the database buffer cache (and double that to estimate the total RAM needed for the database). You can use the size of the LQE Jena index to estimate the size of the LQE rs database; the LQE rs database will be roughly 50% of the size of the Jena index. So, for a 1 terabyte Jena index, expect that the LQE rs database will be 500G, require 50G of buffer cache and a total of 100G total memory for the database.
CPU usage is driven by the number of reports executed per second. In the IBM load tests, the CPU usage on the database server was roughly 20% (for a 40-processor database). Different workloads may result in higher usage, so 32 processors is the IBM recommendation for deployments where there may be 32 reports running concurrently. You can determine your existing concurrent reporting profile by reviewing the "Running Queries" tab (go to LQE's Health Monitoring->Queries page).
IBM also recommends that you monitor the database and LQE servers and make adjustments based on actual system resource usage for your workload.
Db2 tuning recommendations
IBM recommends that you disable self-tuning memory on Db2 for best performance and instead allocate a fixed size buffer pool. When self-tuning memory is enabled, it is possible for Db2 to shrink the buffer pool to a very small size. Report execution then slows down until the buffer pool expands, since a small buffer pool means more disk I/O. Self-tuning memory can therefore lead to variable report performance.
Oracle tuning recommendations
The following initialization parameters should be set on Oracle:
- optimizer_adaptive_plans = false
- optimizer_adaptive_reporting_only = false
- optimizer_adaptive_statistics = false
- _optimizer_use_feedback= false
- _optimizer_push_pred_cost_based = false
- parallel_degree_policy=manual
- CURSOR_SHARING=EXACT
These settings disable Oracle's adaptive features. Those features introduce performance variability into report execution, since the report SQL can be complex and variable enough that Oracle cannot easily converge on a stable (and well-performing) execution plan.
The setting for parallel_degree_policy disables parallel execution plans. IBM does not recommend the use of parallel execution plans for high user loads, as this can overload the Oracle database.
Performance test results
Report performance (single user)
This section compares report execution times for LQE rs and LQE Jena. The comparisons use the "Compare query results" feature to run test reports against identical datasets. These measurements are executed using a single user, so there is no other load on the system.
Oracle results
Most reports run as fast (or faster) when using LQE rs with Oracle.
Out of 101 standard test reports:
- 35 have equivalent performance (where equivalent is defined as running with less than a 1 second difference between Jena and Oracle)
- 57 are more than 1 second faster on Oracle
- 9 are slower on Oracle, but the slowest is at most 5 seconds slower
Note that some of these reports were tuned using the
Oracle hints described later in this article.
Db2 results
Most reports run as fast (or in some cases, much faster) when using Db2.
Out of 101 standard test reports:
- 20 have equivalent performance (where equivalent is defined as running with less than a 1 second difference between Jena and Db2)
- 52 are more than 1 second faster on Db2
- 29 are slower on Db2. There is one outlier that is 390 seconds slower on Db2.
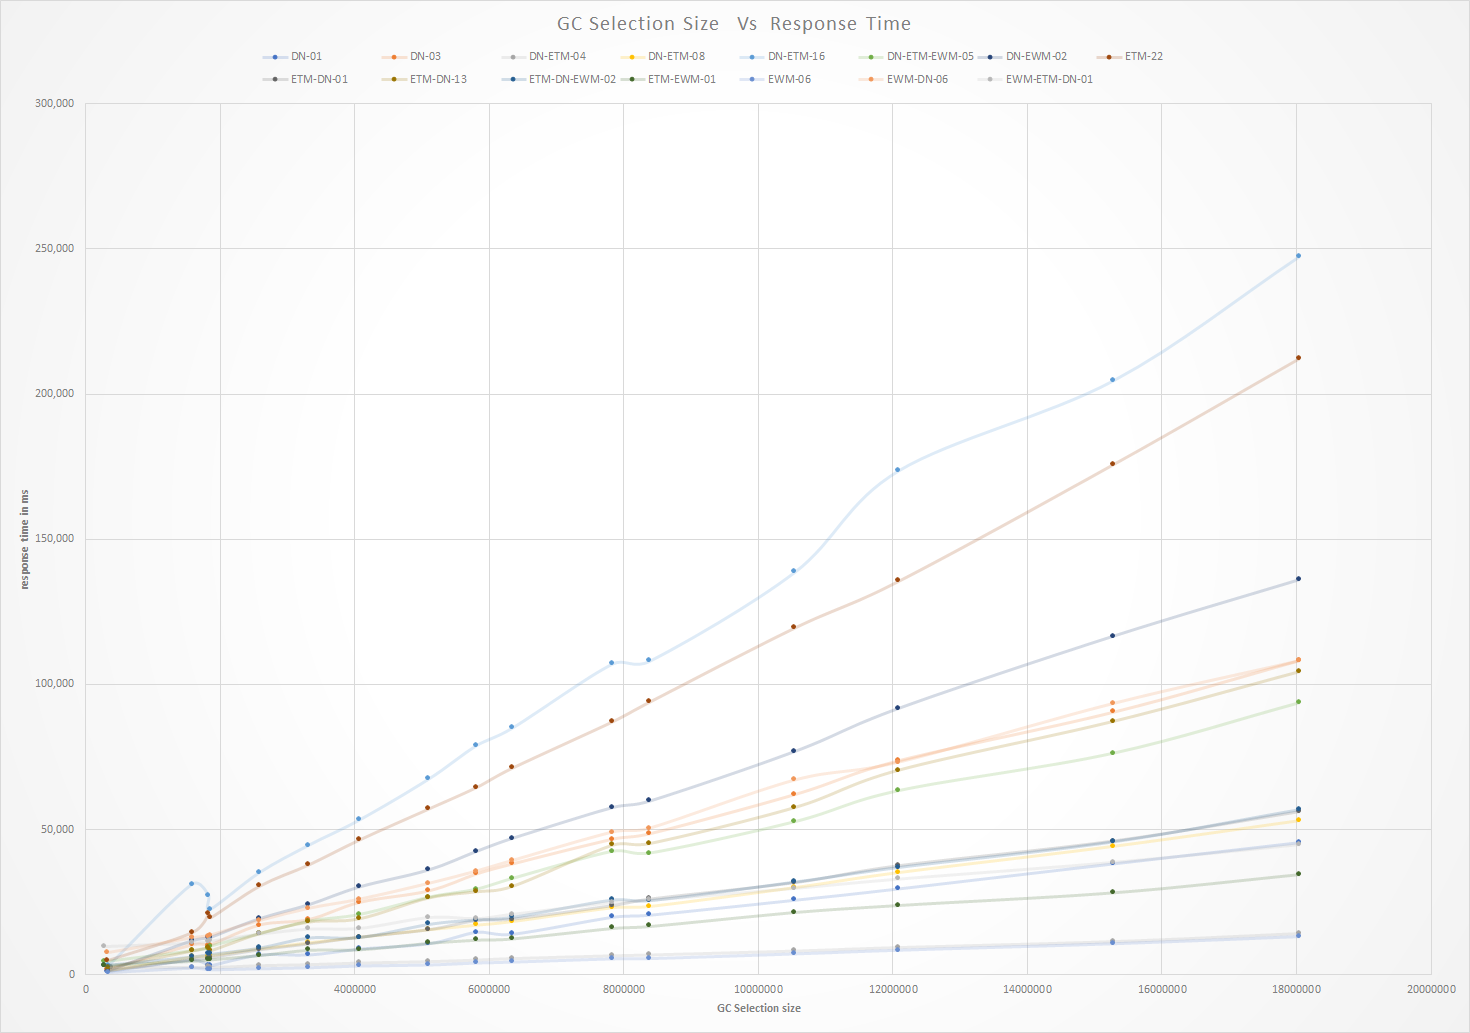
Impact of selection size
For configuration-aware reports, you specify a global configuration as a filter to limit the artifacts that the report will display. The number of versions in the global configuration will impact report performance, with reports taking longer to execute as the total number of versions in the global configuration increases.
The following chart shows how the time to execute a report changes as the number of versions increases for LQE rs with a DB2 backend.
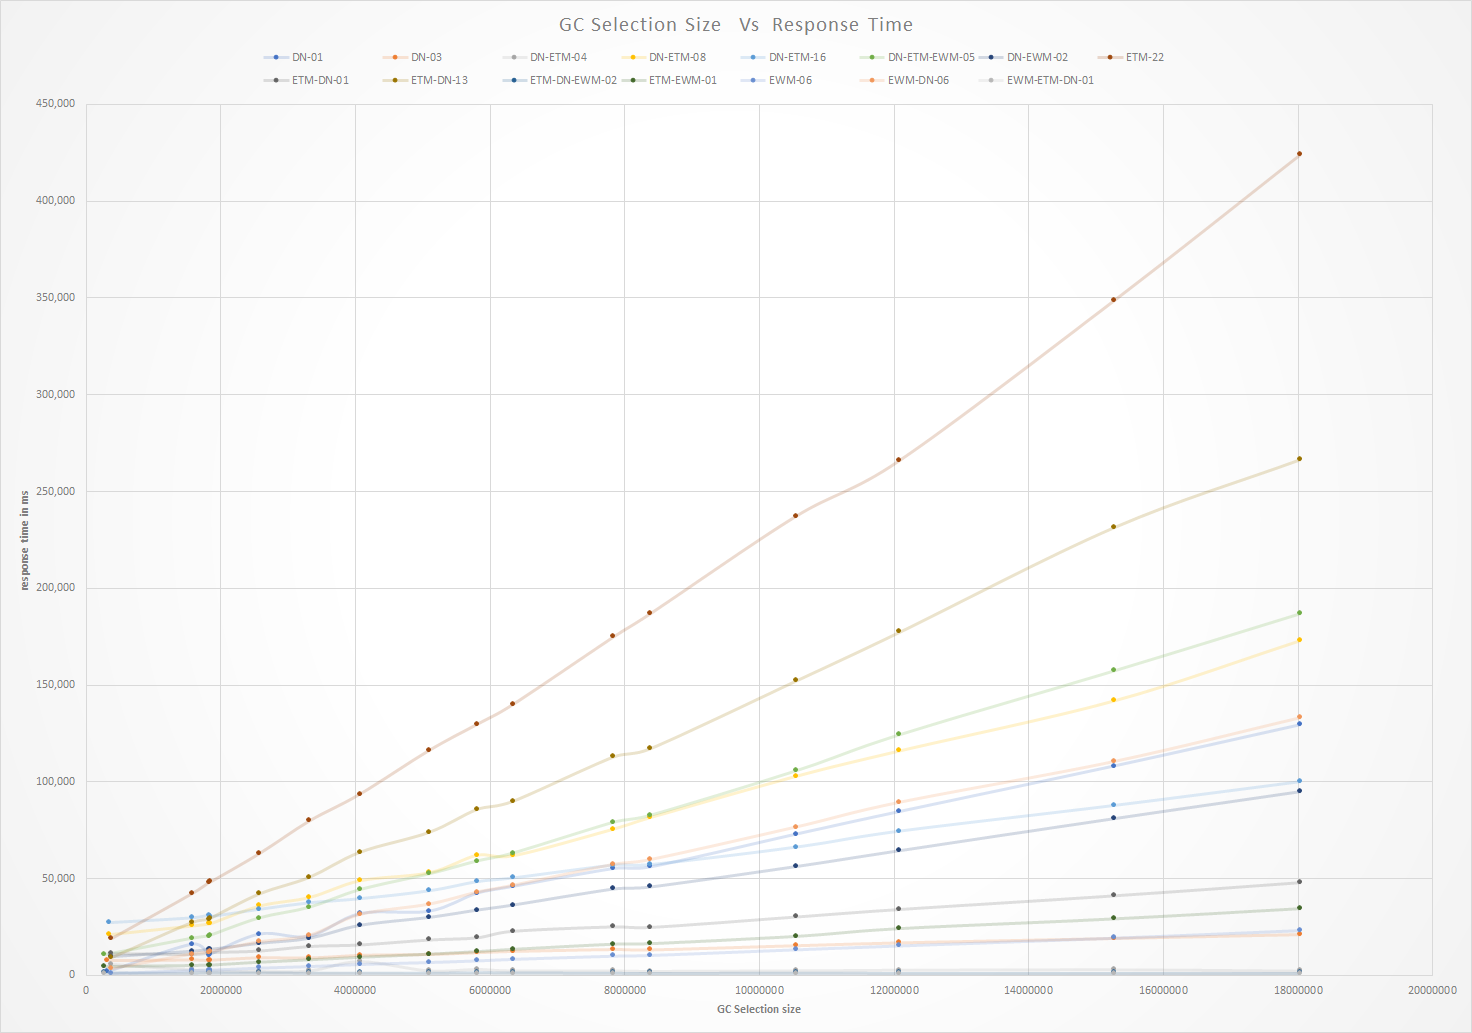
The following chart shows how the time to execute a report changes as the number of versions increases for LQE rs with an Oracle backend.
Report performance (multi-user)
This section describes the results of the load tests conducted against LQE rs. These tests simulate the activities of users running reports, and are focused on report execution. The test automation runs reports using the data service API (which is the same API that would be used for integrating a report into Excel the API that you see when selecting Export->Export the report to Microsoft Excel). Each simulated user selects a test report randomly from a pool of 100 standard reports and executes the report. The simulated user waits for 1 minute and then repeats the process. Note that the automation does not exercise all parts of the Report Builder UI, or parts of the Report Builder interface that look up report definitions from dashboards. Those areas have not changed in 7.0.3; the main changes concern report execution.
Each simulated user runs a single report, which is different from the use case where reports are executed from dashboards. Dashboards may run several reports per user, so we use a 5:1 factor to convert our user loads to dashboard users. 5000 simulated users is roughly equivalent to 1000 dashboard users.
The automation ramps up to 5000 users in stages:
- Ramp up to 1250 users (adding 1 user every 2 seconds). This is followed by a 5 minute settle period.
- Stage 1: 1250 user steady state (for 15 minutes)
- Ramp up to 2500 users (adding 1 user every 2 seconds), followed by a 5 minute settle period.
- Stage 2: 2500 user steady state (for 15 minutes)
- Ramp up to 3750 users (adding 1 user every 2 seconds), followed by a 5 minute settle period.
- Stage 3: 3750 user steady state (for 15 minutes)
- Ramp up to 5000 users (adding 1 user every 2 seconds), followed by a 5 minute settle period.
- Stage 4: 5000 user steady state (for 15 minutes)
Caching in Report Builder
After executing a report, Report Builder caches the result for a period of time (300 seconds by default). If another request for the same report arrives, Report Builder will return the cached results to avoid making database calls. The lifetime of cached data can be controlled in two places:
- A default lifetime (applicable to all reports) is specified in Report Builders configuration file (app.properties) - query.results.dw.timeout is the parameter, and has a default value of 300 seconds.
- You can override the cache lifetime in each individual report. Set Result timeout in seconds in the Name and Share section of the report.
Keep this caching in mind when interpreting the load test results, as this impacts response times. Executing a cached report will be faster than if Report Builder needs to run SQL, so average response times will be skewed downward.
Load test results - Oracle
Report response times for LQE rs on Oracle are stable across user levels, up to the maximum tested load of 5000 simulated users. Resource utilization on the Oracle server is stable across all user loads. CPU utilization on the Report Builder server increases as load increases.
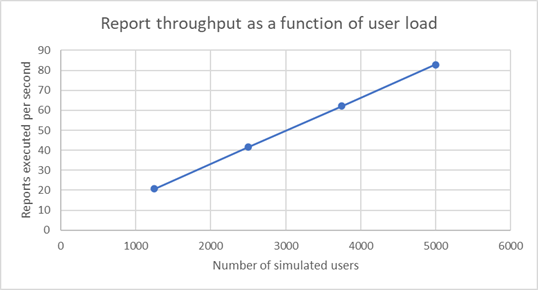
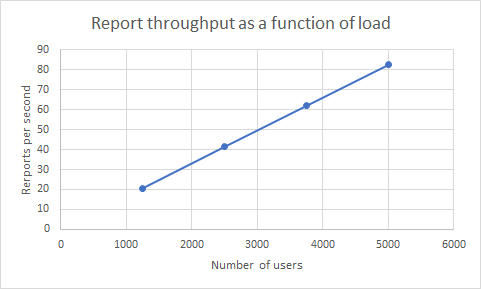
Throughput
The number of reports executed per second increases linearly as the number of simulated users increases. Report Builder was able to handle 83 reports per second for a workload of 5000 simulated users (which corresponds to 1000 dashboard users).
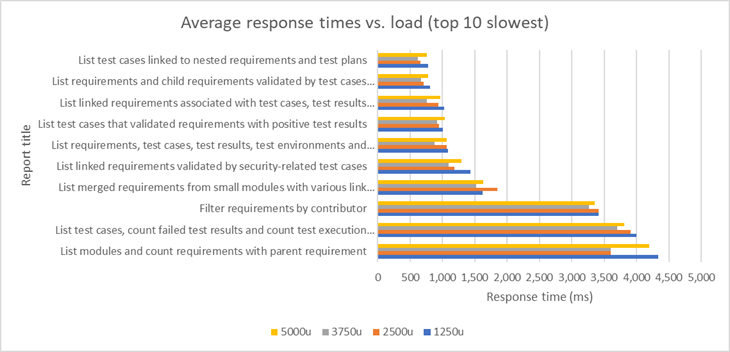
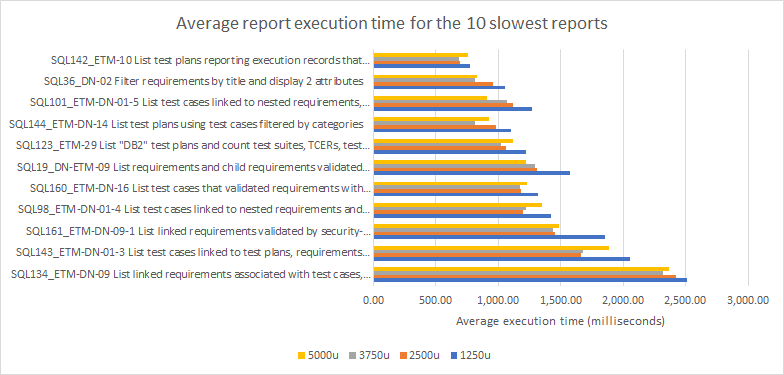
Response times
The average time to execute reports is stable at all user levels. The chart below shows the average response time for the reports with the 10 largest averages. Each bar is a different user load (from 1250 to 5000). Note that the average includes times for both cached and uncached reports.
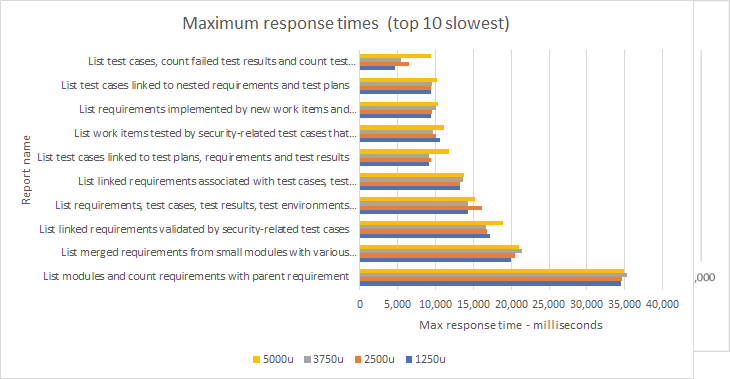
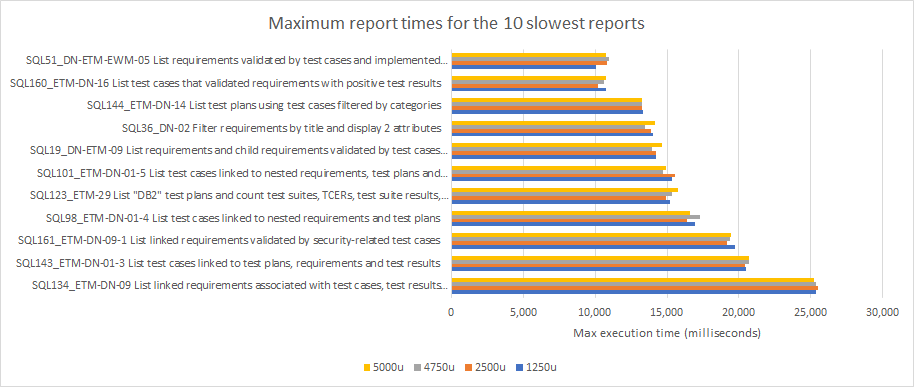
Averages can be misleading because of caching, so it is useful to look at the maximum time to execute a report at each user level. The maximums (which would be uncached times resulting from SQL execution) are also stable across all load levels. The 10 reports with the largest maximums are shown in the chart below; each bar is a different user load (from 1250 to 5000).
CPU utilization for Report Builder server
CPU utilization on the Report Builder server increases as the workload increases.
Disk utilization on the Report Builder server is negligible.
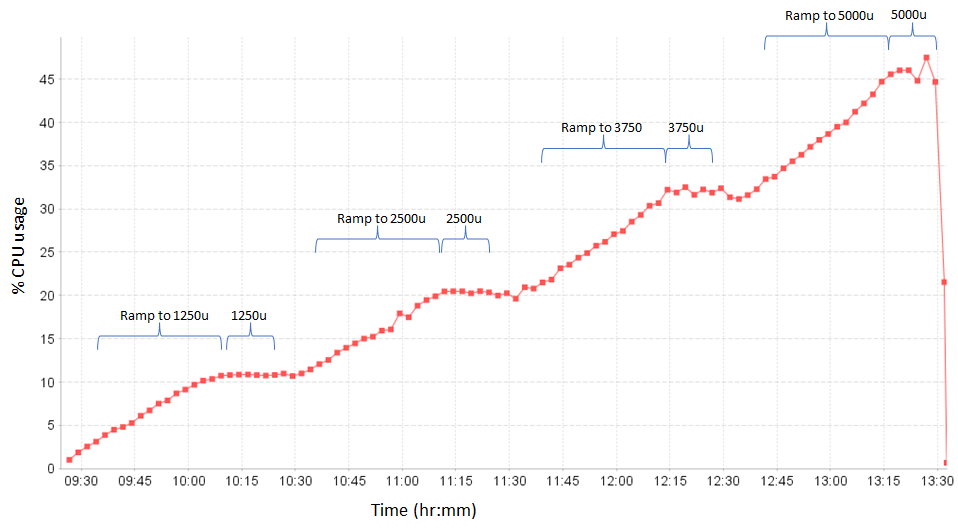
Load on the Oracle server
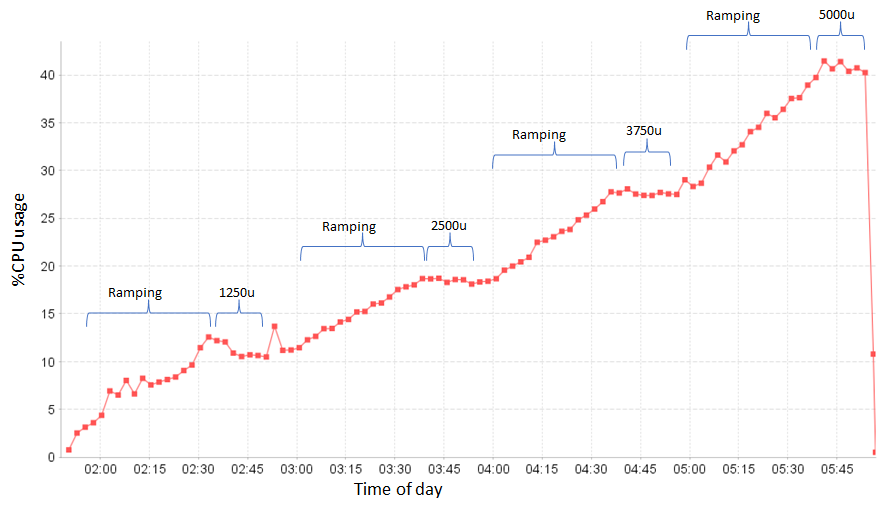
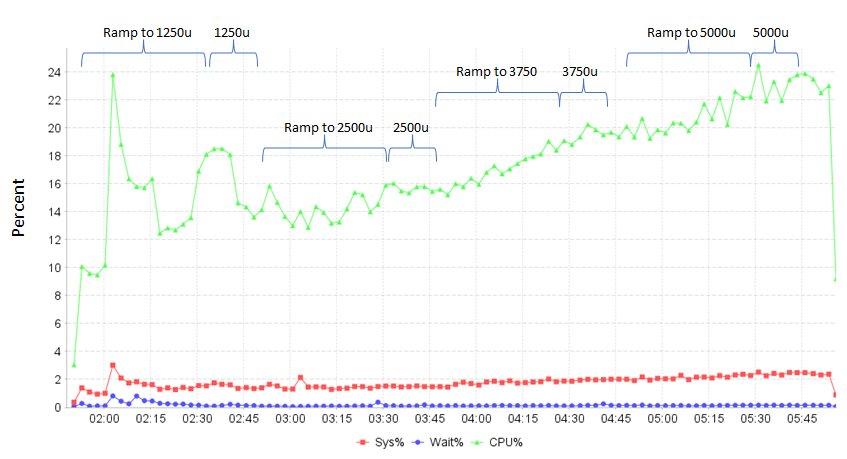
CPU and disk utilization on the Oracle server are low, and increase only slightly as the report workload increases. Most requests are handled by Report Builder, with relatively few requests resulting in execution of SQL statements for reports on the database server. When Report Builder was processing 83 reports per second, Oracle was executing only 2.1 reports per second.
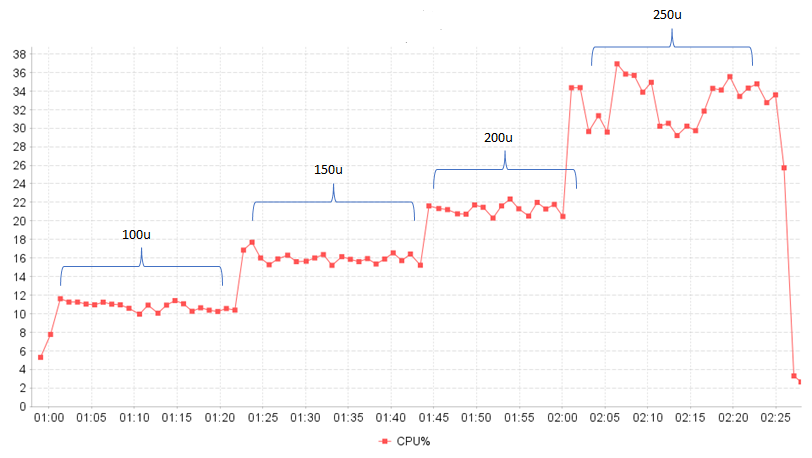
The CPU usage on Oracle during the load test is shown below, where the X axis is a timestamp and the Y axis shows percentage CPU usage.
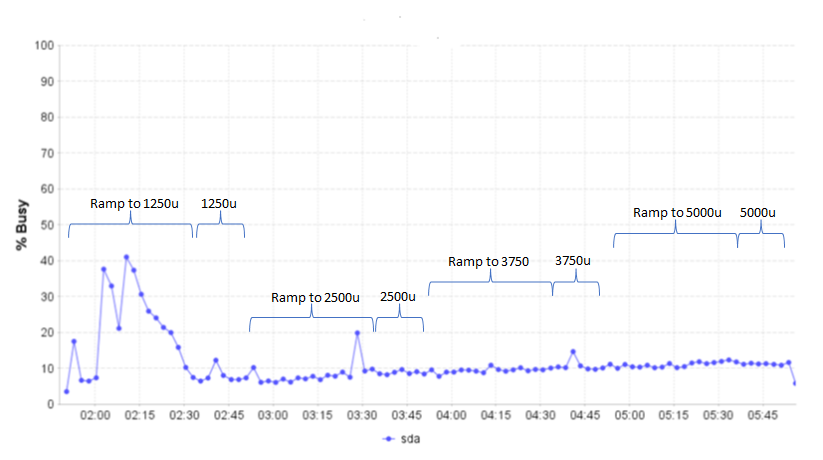
The disk utilization on Oracle during the load test is shown below, where the X axis is a timestamp and the Y axis shows the disk busy percentage. The disk utilization increases slight as user load increases. Disk activity is higher during the initial ramp-up, as rows are loaded into Oracle's buffer cache from disk.
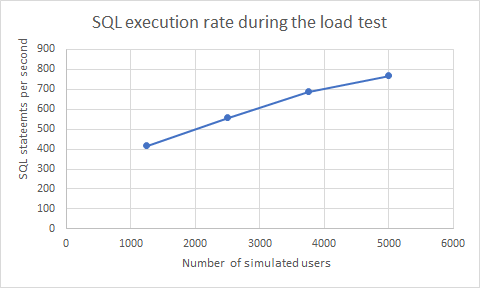
The number of SQL statements processed by Oracle increases with load (see chart below). These SQL statements are executed by Report Builder to get information about the report, and are inexpensive (under 1 millisecond). The slight increase in CPU usage on the Oracle server comes from this.
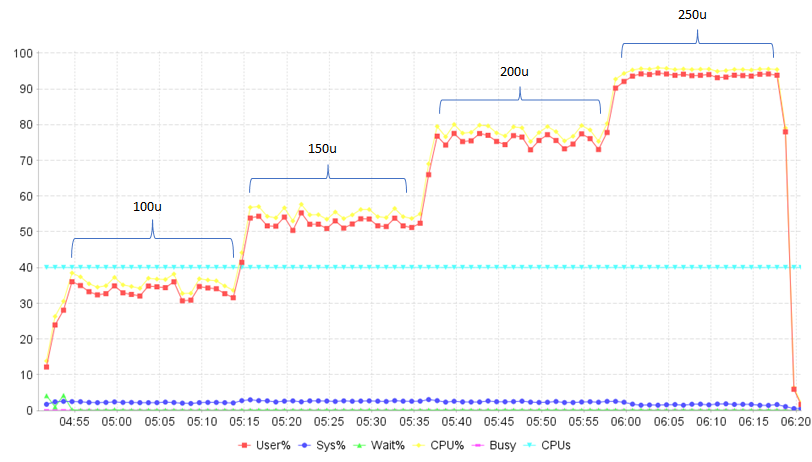
Load test results on Oracle - caching disabled
The load tests were repeated with caching disabled, to simulate a "worst case" reporting workload. Without caching, more load is placed on the database server and as a consequence, the workload has to be reduced. At 250 users, the CPU usage on the Oracle server was in the range of 30-35%.
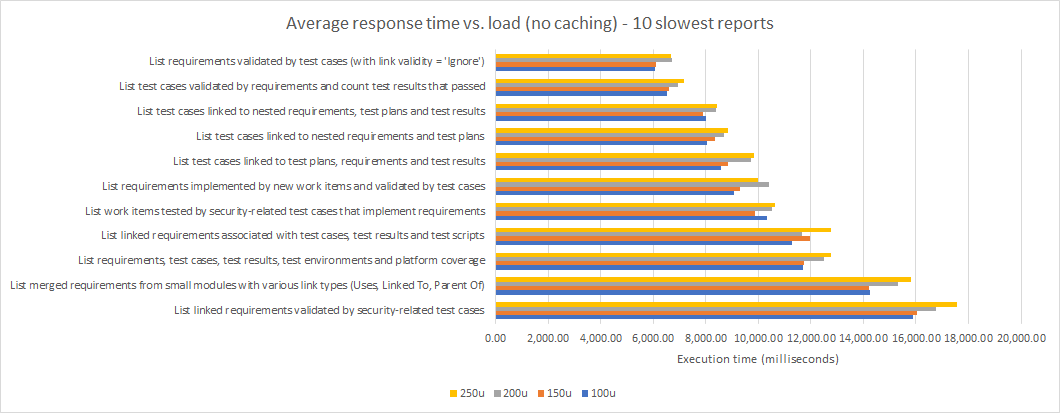
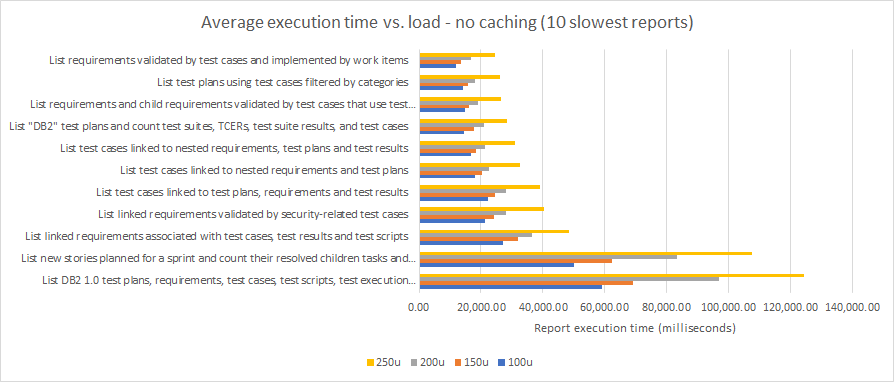
Report response times were increasing as the user load increased:
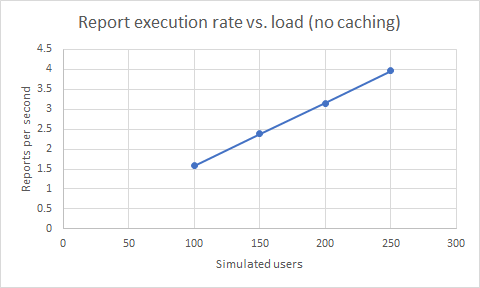
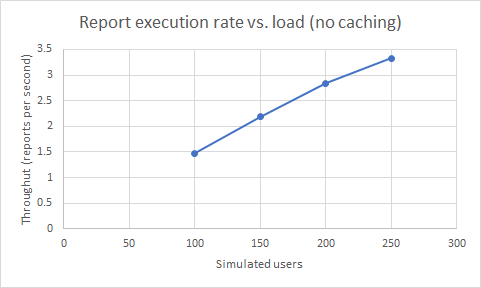
Reporting throughput increased linearly up to the maximum tested load of 250 users (4 reports per second at 250 users).
Disk I/O on the Oracle server was negligible. CPU utilization on the Report Builder server was negligible.
Load test results - DB2
Report response times for LQE rs on Db2 are stable across user levels, up to the maximum tested load of 5000 simulated users. Resource utilization on the Oracle server is stable across all user loads. CPU utilization on the Report Builder server increases as load increases.
Throughput
The number of reports executed per second increases linearly as the number of simulated users increases. Report Builder was able to handle 83 reports per second for a workload of 5000 simulated users (which corresponds to 1000 dashboard users).
Response times
The time to execute reports is stable at all user levels. The chart below shows the average response time for the reports with the 10 largest averages. Each bar is a different user load (from 1250 to 5000).
Averages can be misleading because of caching, so it is useful to look at the maximum time to execute a report at each user level. The maximums (which would be uncached times resulting from SQL execution) are also stable across all load levels. The 10 reports with the largest maximums are shown in the chart below; each bar is a different user load (from 1250 to 5000).
CPU utilization for Report Builder server
CPU utilization on the Report Builder server increases as the workload increases.
Disk utilization on the Report Builder server is negligible.
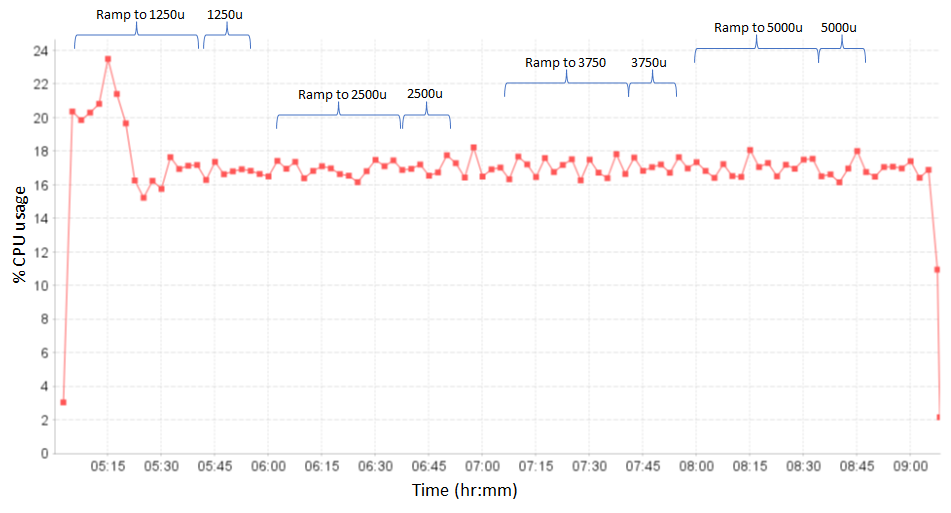
Load on the Db2 server
CPU and disk utilization on the Db2 server are low and increase only slightly as the report workload increases. Most requests are handled by Report Builder, with relatively few requests resulting in execution of SQL statements for reports on the database server.
The CPU usage on Db2 during the load test is shown below, where the X axis is a timestamp and the Y axis shows percentage CPU usage.
The disk utilization on Db2 during the load test is negligible. For these tests, the LQE rs tables are cached in the Db2 buffer pool, so data is available in memory.
Load test results on Db2 - caching disabled
The load tests were repeated with caching disabled, to simulate a "worst case" reporting workload. Without caching, more load is placed on the database server and as a consequence, the workload has to be reduced. At 250 users, the CPU usage on the Db2 server was close to 100%.
Report response times were increasing as the user load increased:
Reporting throughput increased linearly up to 200 users but was starting to fall off at 250 users (since the Db2 server was becoming overloaded). At 250 users, throughput was 3.3 reports per second.
Disk I/O on the Oracle server was negligible. CPU utilization on the Report Builder server was negligible.
Load test results - Jena
The LQE Jena architecture has scale limitations for certain load profiles, especially those that include long-running queries. Long-running queries create contention for LQE Jena resources, and that contention creates a bottleneck that degrades performance. If indexing operations are also running, the bottleneck can become worse and performance can degrade even further. The LQE rs architecture eliminates those bottlenecks. So while it is possible to achieve high levels of concurrency for LQE Jena (even up to 5000 simulated users), that is only possible if the Jena reports are all fast. Even a single slow report will create a bottleneck and degrade performance for all queries.
When running the standard reporting workload against LQE Jena, performance degrades at 50 users. The same workload will support 5000 users with LQE rs (on both Db2 and Oracle).
The table below compares report response times for Db2 vs Jena, for the 10 slowest reports.
| Report |
Db2 (ms) |
Jena (ms) |
| List requirements with child requirements validated by test cases with deferred test results reported on test plans |
3,064.30 |
1,202,440 |
| List "DB2" test plans and count test suites, TCERs, test suite results, and test cases |
9,221.70 |
540,805 |
| Count test plans, test cases, test scripts and test script steps |
1,696.10 |
526,921 |
| Count nested requirements with various link types (Uses, Link From, Parent Of) |
3,132 |
493,384 |
| Count requirements from small modules with various link types (Uses, Linked To, Parent Of) |
2,491.60 |
470,642 |
| Count requirements from small modules with various link types (Uses, Child Of) |
2,545.90 |
434,982 |
| List modules and count requirements used and child requirements not validated by test cases |
1,828.20 |
422,183 |
| Filter test cases by user and test results by verdict |
2,767.40 |
383,658 |
| List requirements implemented by new work items and validated by test cases |
2,338.70 |
357,394 |
| Filter test scripts by date and test cases by weight |
2,283 |
353,771 |
| List requirements and child requirements validated by test cases that use test scripts executed by test suite execution records |
5,042.20 |
353,062 |
Indexing performance
Indexing performance was not a focus for the LQE rs architecture. You should expect reindexing to take about as long as it did with LQE Jena (plus or minus 10%). The results of indexing tests in the IBM lab are showing below.
| Data source |
Oracle |
Jena |
Resources indexed |
| ETM resources (reindex) |
8 days 8 hours |
8 days 6 hours |
19,510,186 |
| EWMresources (reindex) |
16.5 hours |
15 hours |
3,788,721 |
In these tests, 90% the time was spent in retrieving information from ETM or EWM. Relatively little time was spent in inserting data into the relational database.
Some customers reported longer indexing times during the LQE rs beta program. Those tests, however, were for topologies that added LQE rs to database servers that were hosting other ELM applications. IBM
does not recommend this topology, since the additional database load generated by LQE rs can create competition for database resources between ELM applications.
When indexed, the LQE database sizes are:
- Jena LQE: 1277G
- LQE rs Oracle: 698G
- LQE rs Db2: 665G
LQE rs requires significantly less disk space for its index than LQE Jena.
Improving query performance
Report Builder allows you to build reports of arbitrary complexity. Report definitions are transformed into SQL queries which are then executed by the database server. The database will optimize the SQL query so that it executes efficiently, and in most cases, this results in queries that perform well. But in some cases, especially for complex traceability reports, the database may need a little help.
If you do discover that one of your reports runs slowly, Report Builder gives you some options to change the way the SQL query is constructed. You can experiment with these alternatives to see if they improve performance. You can find these options in the Format Results tab by expanding the Advanced tab:
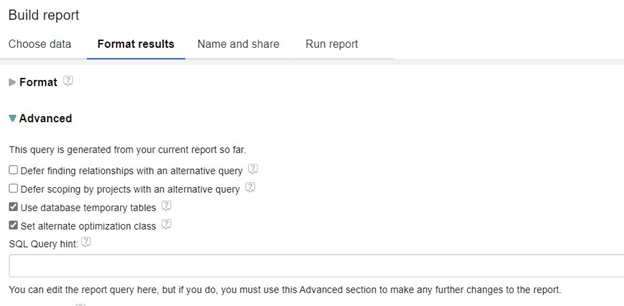
Additional details on these options are provided below.
Use database temporary tables (Db2 only)
Configuration-aware reports identify the versions that are relevant to the configuration specified by the report by querying against the RITRS.SELECTIONS_SELECT table. If you select the option to Use database temporary tables, the results of the selection query are stored in a global temporary table. The global temporary table is then used in the report SQL. This can improve performance for larger configurations (e.g. those with hundreds of thousands of versions).
This option only applies to configuration-aware reports for an LQE rs using Db2. The option has no effect on reports without configuration scoping, or on LQE rs servers using Oracle.
Set alternative optimization class (Db2 only)
If this option is selected, the SQL is executed using the following optimization guideline:
/* <OPTGUIDELINES> <QRYOPT VALUE="2"/> </OPTGUIDELINES> */
This tells Db2 to use optimization class 2 rather the default (which would normally be optimization class 5). This can improve performance for reports that specify many relationships, have complex conditions, or many result columns.
This option has no effect on LQE rs servers using Oracle.
For more information on optimization classes, refer to the
IBM Db2 documentation.
SQL query hints
Both Db2 and Oracle allow you to override the behavior of the database optimizer by providing hints. You can supply a hint to be used when executing a report by adding the hint text into the "SQL Query hint" field.
Note that this hint will override the QRYOPT hint injected when Set alternative optimization class is selected. This hint will also override any global hints that might have been specified in the Report Builders app_runtime.properties file (via the queryHint parameter).
Useful hints on Oracle
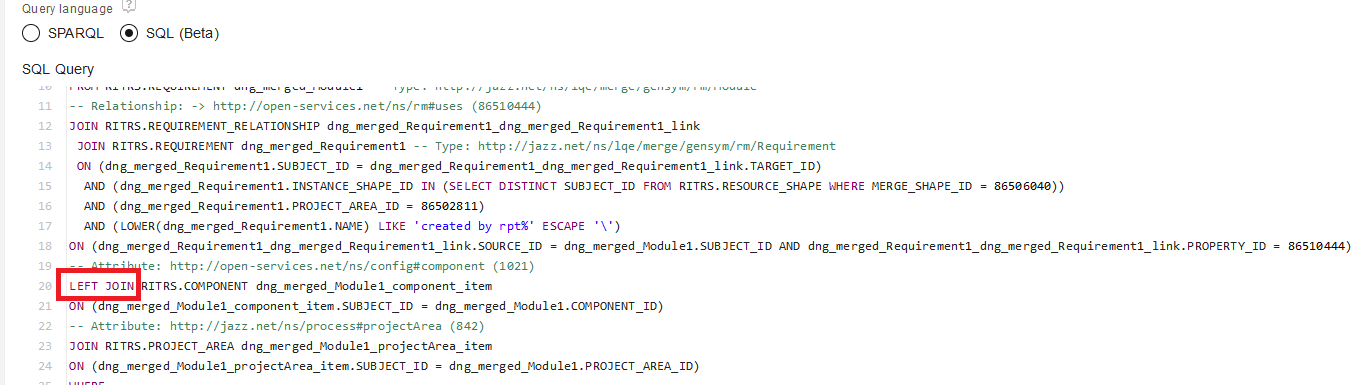
Performance of reports that involve left outer joins may be improved with the following hint:
/*+ OPT_PARAM('_optimizer_ansi_join_lateral_enhance', 'false') */
This hint is always added to if you don't have a global hint specified and did not use custom hint per given report.
That hint suppresses a view transformation that maps a left outer join to a decorrelated lateral view. If you see left join in the SQL query section of the reports Format Results->Advanced section, then this hint may improve performance.
Note: In some conditions this hint can cause performance degradation. Try running the report with the following hint to override :
/*+ OPT_PARAM('_optimizer_ansi_join_lateral_enhance', 'true') */
Some reports can be improved by using a LEADING hint to tell Oracle to start joining using the first table in the query. Find the table alias from the SQL query section, then specify the hint as follows:
/*+ LEADING(table_alias) */
For example, in the following report, the alias of the first table in the SQL (which will immediately follow the FROM keyword) is rqm_merged_QM_20Test_20Plan1.
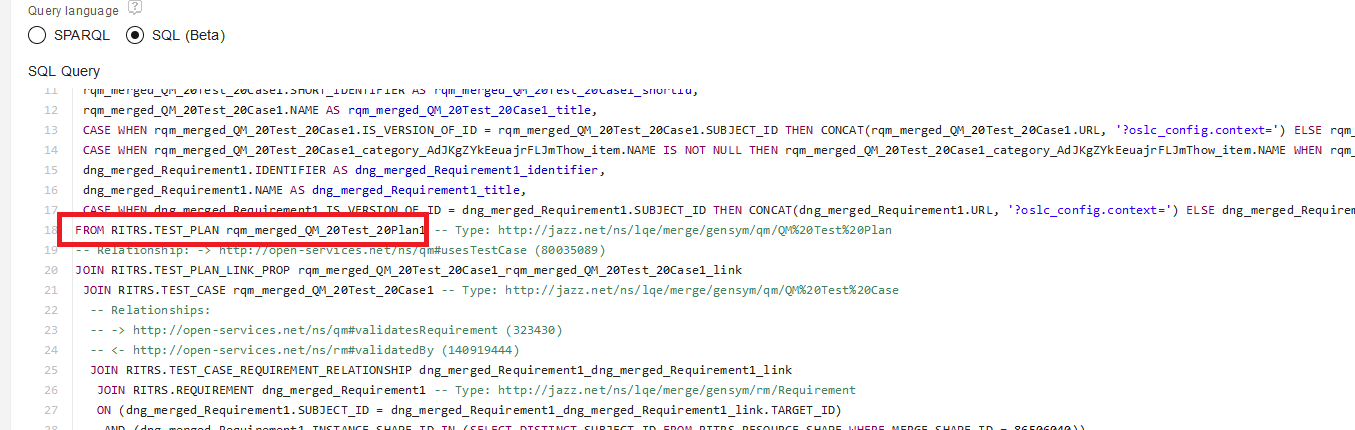
The leading hint would therefore be:
/*+ LEADING(rqm_merged_QM_20Test_20Plan1) */
For troubleshooting, use the following hint:
/*+ MONITOR */
This will force the SQL statement to appear in Oracle's real-time SQL monitor, which then allows you to examine the execution plan in more detail.
You should disable statistics feedback on your Oracle server by setting the initialization parameter "_optimizer_use_feedback" to false. You can also specify that as a hint:
/*+ OPT_PARAM('_optimizer_use_feedback', 'false') */
That prevents Oracle from trying to optimize execution plans if it detects problems with its cardinality estimates. In our experience, Oracle does not usually converge on an optimized execution plan, so allowing it to attempt to optimize only contributes to instability in the execution plans (and inconsistent performance).
For reports that run infrequently but may take more than 60 seconds to run, you can try enabling parallel execution:
/*+ PARALLEL(4) */
This is not recommended for reports that are frequently executed, as this will consume more CPU on the Oracle server. IBM recommends limiting the number of parallel threads to 4 or less, but if your Oracle server has a large number of CPUs (and CPU usage is not high), you can experiment with higher thread counts.
SQL optimization is a complex topic, and you can read more about it in the
Oracle documentation.
Useful hints on Db2
Please refer to the
IBM Db2 documentation for detailed information on influencing the Db2 optimizer using hints.
Performance test details
The performance test environment consists of 3 different LQE servers:
- An LQE server using a Jena index
- An LQE rs server using Oracle as the backend database
- An LQE rs server using Db2 as the backend database
All three of these servers were configured to index a single ELM deployment. That deployment was populated with roughly 85 million artifacts of various types. All three LQE servers therefore had identical indexes.
In addition, two Report Builder servers were set up. One was configured to report against both Jena and LQE rs Db2. The other was configured to report against both Jena and LQE rs Oracle. Both Report Builders were populated with an identical set of test reports. This allowed for easy comparison of report performance (and functionality) between the Jena and relational store technologies.
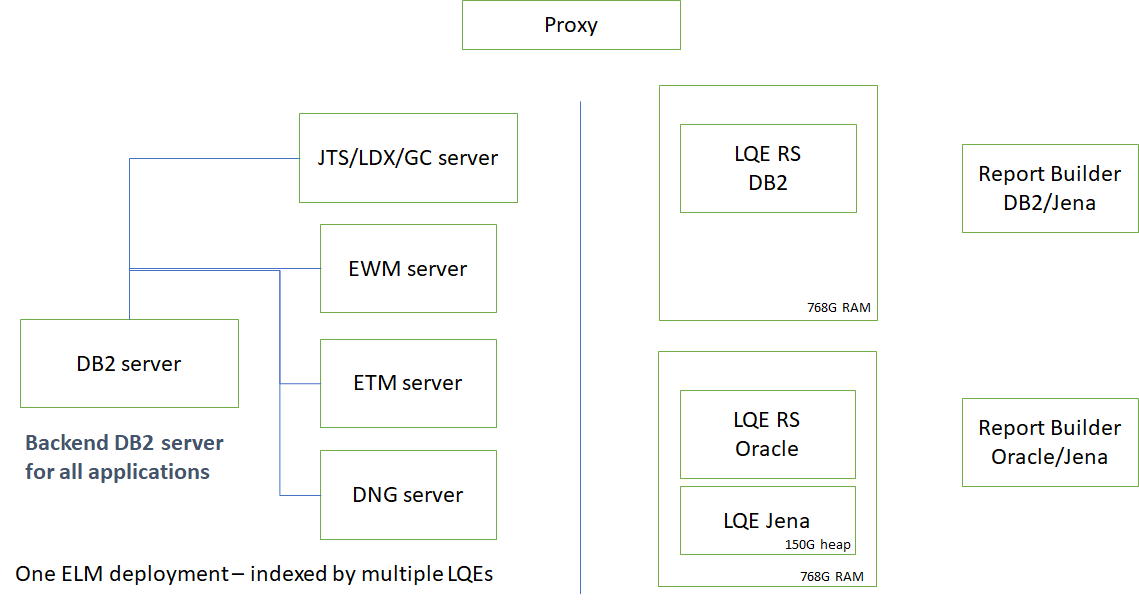
Deployment topology
The test topology (including hardware specifications are shown below). There are two large physical servers that comprise the primary LQE test environment.
- One server hosts LQE Jena, LQE rs for Db2, and the Db2 database
- One server hosts LQE rs for Oracle, as well as the Oracle database
In an ideal topology, the database would be hosted on a server that is separate from LQE. But in this case, the servers have enough CPU and memory to allow for performance testing without concern about interaction between the components. Additionally, the LQE rs architecture does not put stress on the LQE rs application during load testing (since report execution has shifted to the database in the LQE rs architecture). LQE rs only adds load for indexing.
The servers in the topology are all physical servers. The hardware specifications are listed below.
| Role |
Server |
Machine type |
Processor |
Total processors |
Memory |
Storage |
OS and version |
| Proxy Server |
IBM HTTP Server and WebSphere Plugin |
IBM System x3550 M3 |
2 x Intel Xeon X5667 3.07 GHz (quad-core) |
16 |
16 GB |
RAID 5 279GB SAS Disk x 2 |
RHEL 7 |
| DNG |
WebSphere Liberty |
IBM System x3550 M4 |
2 x Intel Xeon E5-2640 2.5GHz (six-core) |
24 |
64 GB |
RAID 5 279GB SAS Disk x 4 |
RHEL 7 |
| JTS/GC/LDX |
WebSphere Liberty |
IBM System x3550 M4 |
2 x Intel Xeon E5-2640 2.5GHz (six-core) |
24 |
32 GB |
RAID 5 279GB SAS Disk x 4 |
RHEL 7 |
| ETM |
WebSphere Liberty |
IBM System x3550 M4 |
2 x Intel Xeon E5-2640 2.5GHz (six-core) |
24 |
32 GB |
RAID 5 279GB SAS Disk x 4 |
RHEL 7 |
| EWM |
WebSphere Liberty |
IBM System x3550 M4 |
2 x Intel Xeon E5-2640 2.5GHz (six-core) |
24 |
32 GB |
RAID 5 279GB SAS Disk x 4 |
RHEL 7 |
| LQE rs Oracle/Jena |
Oracle 19c |
IBM System SR650 |
2 x Xeon Silver 4114 10C 2.2GHz (ten-core) |
40 |
768 GB |
RAID 10 900GB SAS Disk x 16 |
RHEL 7 |
| LQE rs Db2 |
Db2 11.5 |
IBM System SR650 |
2 x Xeon Silver 4114 10C 2.2GHz (ten-core) |
40 |
768 GB |
RAID 10 900GB SAS Disk x 16 |
RHEL 7 |
| Report Builder - Db2 |
WebSphere Liberty |
IBM System x3550 M4 |
2 x Intel Xeon E5-2640 2.5GHz (six-core) |
24 |
64 GB |
RAID 5 279GB SAS Disk x 4 |
RHEL 7 |
| Report Builder - Oracle |
WebSphere Liberty |
IBM System x3550 M4 |
2 x Intel Xeon E5-2640 2.5GHz (six-core) |
24 |
64 GB |
RAID 5 279GB SAS Disk x 4 |
RHEL 7 |
Abbreviations:
- JTS = Jazz Team Server
- GC = Global configuration application
- LDX = Link index provider
- DNG = DOORS Next Generation
- EWM = Engineering Workflow Management
- ETM = Engineering Test Management
- LQE rs = Lifecycle Query Engine - Relational Store
- RHEL = Red hat Enterprise Linux
Data shape
The test deployment includes the following kinds of artifacts:
- DOORS Next: 10 million requirements and 60 million links. 5 million links have link validity.
- EWM: 2 million work items
- ETM: 5 million total test artifacts
- Global configurations: 1000 total components
Workload
Automation was developed to compare the LQE rs reports to their Jena equivalents. This automation exercises the same code path accessible in the Report Builder UI via Compare query results. This was an easy way to compare the performance of LQE rs and LQE Jena, as well as to validate that LQE rs was returned the results expected.
Finally, a multi-user simulation was developed that ran the standard test reports. This automation exercised the API that is available in the Report Builder UI through Export->Export the report to Microsoft Excel. A URL similar to the one below will run a report in the context of a given configuration:
https://rtpclmperf13.rtp.raleigh.ibm.com:9443/rs_db2/query/29/dataservice?report=29
&oslc_config.context=https%3A%2F%2Frtpclmperf13.rtp.raleigh.ibm.com%3A9443%2Fgc%2Fconfiguration%2F1438
&pName=497dc95cc240c74f053c77926343e265&pVal=https%3A%2F%2Frtpclmperf13.rtp.raleigh.ibm.com%3A9443%2Fqm%2Fservice%2Fcom.ibm.rqm.integration.service.IIntegrationService%2Fresources%2FETMProject1%2Fcategory%2Furn%3Acom.ibm.rqm%3Acategory%3A_Ac-LYZYkEeuajrFLJmThow%23
&basicAuthenticationEnabled=true
Revision history
- 8/8/2023: Added results from load tests with Report Builder caching disabled, for Oracle and DB2.
- 9/1/2023: Add section on the impact of global configuration size on report performance
- 9/5/2023: Add /*+ PARALLEL(4) */ hint to the list of Oracle hints
- 3/10/2025: Added information, that '_optimizer_ansi_join_lateral_enhance is a default hint
- 7/17/2025: Added one more query hint in Oracle tuning recommendations, _optimizer_push_pred_cost_based

