"A journey of a thousand miles begins with a single step" - Lao-Tzu
This is the first step of your journey to troubleshoot performance issues in your Jazz environment. It may seem simplistic to some readers, but these are the basic steps and basic information that you should have as a baseline for working on any performance issue in your Jazz environment. When working on performance issues, it is critical that you have a solid foundation of information to work with.
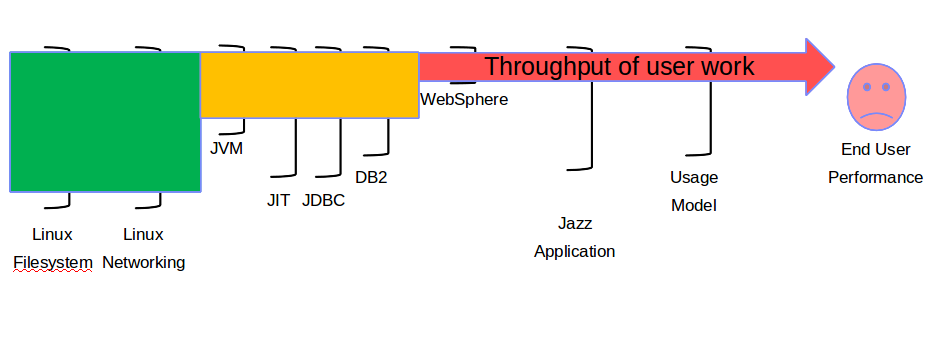
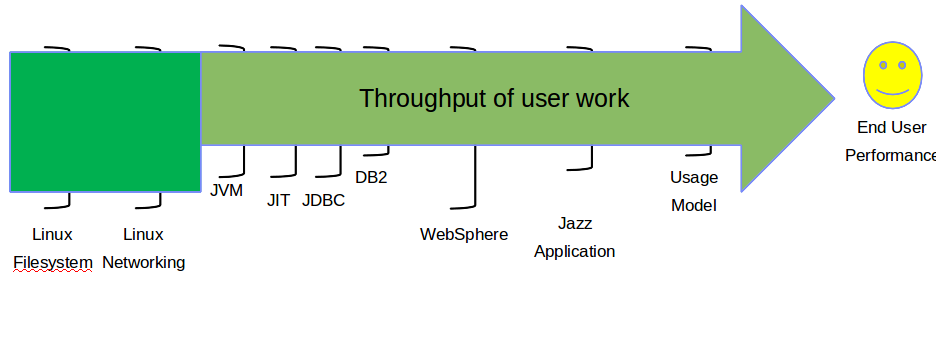
 Using this example, as you work through issues, you may adjust some configuration settings or address hardware issues that are related to the performance bottleneck imposed by the JVM. Even though you found a valid issue that will impact performance, the existing performance bottleneck imposed by your WAS configuration will make it appear that nothing has changed. Once the WAS issue is addressed, performance will improve, and your performance might be expressed by this diagram:
 So don't despair when you make changes and see no resulting improvement in performance. Also keep in mind that as you remove performance bottlenecks and improve performance in these various areas, other areas will become the new bottleneck. Some have equated this to squeezing a balloon filled with water. As you squeeze one end, it will cause the balloon to expand on the other end. In this scenario, as you relieve performance pressure from one area of your architecture, other areas will feel increased stress.
Philosophy
You are reading this section because you are trying to address a performance issue. In actuality, you probably have multiple performance issues, of various dimensions with a variety of impacts to your jazz performance. Think of Jazz performance as a series of logical/physical tiers of performance. Your current performance might be expressed by this diagram: Using this example, as you work through issues, you may adjust some configuration settings or address hardware issues that are related to the performance bottleneck imposed by the JVM. Even though you found a valid issue that will impact performance, the existing performance bottleneck imposed by your WAS configuration will make it appear that nothing has changed. Once the WAS issue is addressed, performance will improve, and your performance might be expressed by this diagram:
 So don't despair when you make changes and see no resulting improvement in performance. Also keep in mind that as you remove performance bottlenecks and improve performance in these various areas, other areas will become the new bottleneck. Some have equated this to squeezing a balloon filled with water. As you squeeze one end, it will cause the balloon to expand on the other end. In this scenario, as you relieve performance pressure from one area of your architecture, other areas will feel increased stress.
Troubleshooting basics
There are some very basic rules to keep in mind when doing troubleshooting. Most software professionals are familiar with these, but we state them here to make sure that we all have a common base of understanding.- Record your measured performance prior to making changes, and write down the changes that you make. Be explicit, write down the exact syntax and commands used. Then record your measured performance after you have made changes. You need to be able to assess the impact of your actions, potentially rollback your changes, and share what was done with other people.
- You are working in an environment with thousands of variables. Only make one change at a time when trying to address performance issues. Change one variable so you can assess the impact of that single change on the performance of your Jazz solution. When changing multiple variables, it is impossible to determine how much impact each of the changes has had. It can also lead to unexpected consequences and pressures elsewhere on the system.
- BE CAREFUL WHEN WORKING WITH PRODUCTION ENVIRONMENTS! You should be testing potential fixes for performance issues in some sort of isolated test environment, before you begin making modifications to your production environment.
Investigating issues
The source of the performance issues that you see will often be a good indicator of where to begin looking for the source of the performance issues. When looking at performance issues, it is important to keep in mind what you are spending your time looking at. Some issues are best found by going through the entire sequence of initial steps listed below, and then taking a high level look at the data, trying to identify patterns of errors and warning from the various tiers of your Jazz solution. Some issues can be spotted rather quickly, and you can then drill down and find the root cause rather quickly, without wasting time doing the remaining steps. The trick is in realizing when you are going down a "blind alley", and drilling down into non-issues, or relatively minor performance concerns. With either approach, it is critical to have an understanding of time. Know when your performance issue occurred, and then understand how to correlate this with the time stamps found in the various logfiles. I have seen people waste time chasing issues that were completely unrelated to the performance issues that they wanted to address, because they did not pay attention to time stamps and the relative timing of various events in their environment.User-reported issues
Most often, users will ask "Why do my response times vary so much?" or "Why is my performance time so slow?" While these questions obviously indicate that there may be a performance issue, good investigation skills will help us define where the problem lays within the application and therefore, lead us to some more intelligent troubleshooting to ensure no time is wasted in determining root cause. It is important to ask questions to the user to help narrow down the issue to a certain component or application, as well as identify if there are any patterns as to when the behaviour occurs. Each one of these questions needs to be asked when users report poor performance. Care needs to be exercised not to jump to conclusions based on the answers to the initial questions. A full appraisal of the situation needs to be done. This will allow teams to avoid spending time chasing non-existent issues, and projects a professional image of the Jazz Administration team. This can be key in giving adopting teams confidence in the solution.Questions for your user
Ask your end user some basic questions, to get an idea of the scope of your performance issue.- Is there a specific action whereby you are receiving poor response?
- If it is more than one action, are others from your team also experiencing issues?
- Is this problem isolated to a specific project or multiple projects?
- Do you access projects on more than one Jazz server?
- Do you have this issue in other projects on other Jazz servers?
- Do you receive any error messages?
- Has this issue occurred previously, or is this the first time?
- If it is the first time, when did the problem start?
Fact finding
Go out and validate what your user is telling you. If you cannot validate the issue, then that is another data point for you to consider.- Given the details provided by the end user, attempt the same action as the end user (if possible).
- If the issue is overall performance problems for the Jazz application, then the problem will be handled differently.
- Is the problem site specific (for instance: only users at that location are having problems?) (if possible)
- Try this action from the impacted site as well as other sites for comparison purposes. Do you see the same behavior at all sites?
Administrator-discovered issues
Each one of these questions needs to be asked when an Administrator detects poor performance. Care needs to be exercised not to jump to conclusions based on the answers to the initial questions. Get ALL of the information below, before you start an analysis and decide which areas require further investigation. Administrator discovered issues may be detected before you get end-user complaints, but often you will get end-user complaints which are related to your performance issue.Fact finding
Go out and gather some basic information. Make sure that you keep a log of what you find, some data which may appear to be "normal" may end up providing important information.- Is the problem site specific (for instance; only users at one location are having problems?) (if applicable)
- Try this action from the impacted site as well as other sites for comparison purposes. Do you see the same behavior at all sites?
- Evaluate if there are batch processes that occur during the detected performance degradation time frame.
- Sometimes other Jazz operations can impact performance, sometimes other non-Jazz applications can impact performance due to a saturation of shared infrastructure resources.
- Evaluate network performance during the detected performance degradation time frame. (if possible)
- On the Jazz server where the build accessed the Jazz infrastructure, open up the Jazz application log file, in the /logs subdirectory.
- Look for errors in the range of times associated with the issue. Identify any error conditions and anything that may be contributing to the issue. Make note of ANY errors or suspicious warnings.
- Check the CRJAZxx log codes, and find out what the underlying cause of the issue could be. Make note of error codes and explanations.
- Check the WAS system.out logfile.
- Look for errors during the range of times associated with the issue. Identify any error conditions and anything that may have contributed to the issue. Make note of ANY errors or suspicious warnings
- Check the WAS systemErr.log.
- Look for errors during the range of times associated with the issue. Identify any error conditions and anything that may have contributed to your issue. Make note of ANY errors or suspicious warnings.
- Check the IHS plugin log (/opt/IBM/httpserver/Plugins/config/
/systemOut.log and http_plugin.log) - Look for errors during the range of times associated with the issue. Identify any error conditions and anything that may be contributing to the issue. Make note of ANY errors or suspicious warnings
- For any lib_httpresponse errors discovered, look at TCP/IP connections and logs to determine if network connectivity or database connectivity has been compromised.
- Check the IHS server logs
- Look for errors during the range of times associated with the issue. Identify any error conditions and anything that may have contributed to the issue. Make note of ANY errors or suspicious warnings.
Related topics: How to start a troubleshooting assessment, Performance troubleshooting, Browser performance
External links:
Additional contributors: StephanieBagot
Contributions are governed by our Terms of Use. Please read the following disclaimer.
Dashboards and work items are no longer publicly available, so some links may be invalid. We now provide similar information through other means. Learn more here.