Load testing for ELM on Hybrid Cloud v1.0
Authors: VaughnRokosz, SameerkumarKalaria, RamnarayanKumar, JayrajsinhGohil, PriyankaKarande, AjayTaranBuild basis: 7.1
Introduction
IBM® Engineering Lifecycle Management (ELM) consists of a set of interconnected web applications on multiple physical or virtual server instances. Engineering Lifecycle Management on Hybrid Cloud v1.0 provides containers of ELM applications coupled with an operator that offers the ability to quickly deploy ELM on any of the following environments:- Red Hat® OpenShift® cluster platform (on-premise)
- Red Hat OpenShift cluster on IBM Cloud®
- IBM Cloud Kubernetes Services
- Other OpenShift or Kubernetes services in private clouds, or on-premises
- Verify container sizes for small and medium deployments per the ELM 7.1 sizing overview
- Identify bottlenecks
Summary of results
The supported user loads for the applications are shown below. In this table, the "Model" column is the number of users defined for the small and medium deployments in the ELM 7.1 sizing overview. The "Actual" column is the user loads that could be handled during the testing. Higher user loads can be tolerated but response times will be degraded. The limiting factor is the number of CPUs assigned to the container. Once the CPU usage reaches 100%, response times degrade. For Report Builder, disk speed is also a bottleneck.
Abbreviations:
The limiting factor is the number of CPUs assigned to the container. Once the CPU usage reaches 100%, response times degrade. For Report Builder, disk speed is also a bottleneck.
Abbreviations: - JTS: Jazz Team Server
- JAS: Jazz Authorization Server
- GCM: Global Configuration Management
- EWM: Engineering Workflow Management
- CCM: Change and Configuration Management
- ERM: Engineering Requirements Management DOORS Next
- RM: Requirements Management
- ETM: Engineering Test Management
- QM: Quality Management
- Jazz Reporting components
- DCC: Data Collection Component (part of Jazz Reporting Service)
- RB: Report Builder (part of Jazz Reporting Service)
- LQE rs: Lifecycle Query Engine (Relational store)
- LDX rs: Link Index Provider (Relational store) - service provided by LQE in ELM on HC v1.0
- PUB: PUB Document Builder
- ENI: Engineering Lifecycle Optimization - Engineering Insights
Standard disclaimer
The information in this document is distributed AS IS. The use of this information or the implementation of any of these techniques is a customer responsibility and depends on the customers ability to evaluate and integrate them into the customers operational environment. While each item may have been reviewed by IBM for accuracy in a specific situation, there is no guarantee that the same or similar results will be obtained elsewhere. Customers attempting to adapt these techniques to their own environments do so at their own risk. Any pointers in this publication to external Web sites are provided for convenience only and do not in any manner serve as an endorsement of these Web sites. Any performance data contained in this document was determined in a controlled environment, and therefore, the results that may be obtained in other operating environments may vary significantly. Users of this document should verify the applicable data for their specific environment. Performance is based on measurements and projections using standard IBM benchmarks in a controlled environment. The actual throughput or performance that any user will experience will vary depending upon many factors, including considerations such as the amount of multi-programming in the users job stream, the I/O configuration, the storage configuration, and the workload processed. Therefore, no assurance can be given that an individual user will achieve results similar to those stated here. This testing was done as a way to compare and characterize the differences in performance between different versions of the product. The results shown here should thus be looked at as a comparison of the contrasting performance between different versions, and not as an absolute benchmark of performance.Test environment
The high level architecture for Engineering Lifecycle Management on Hybrid Cloud is shown below.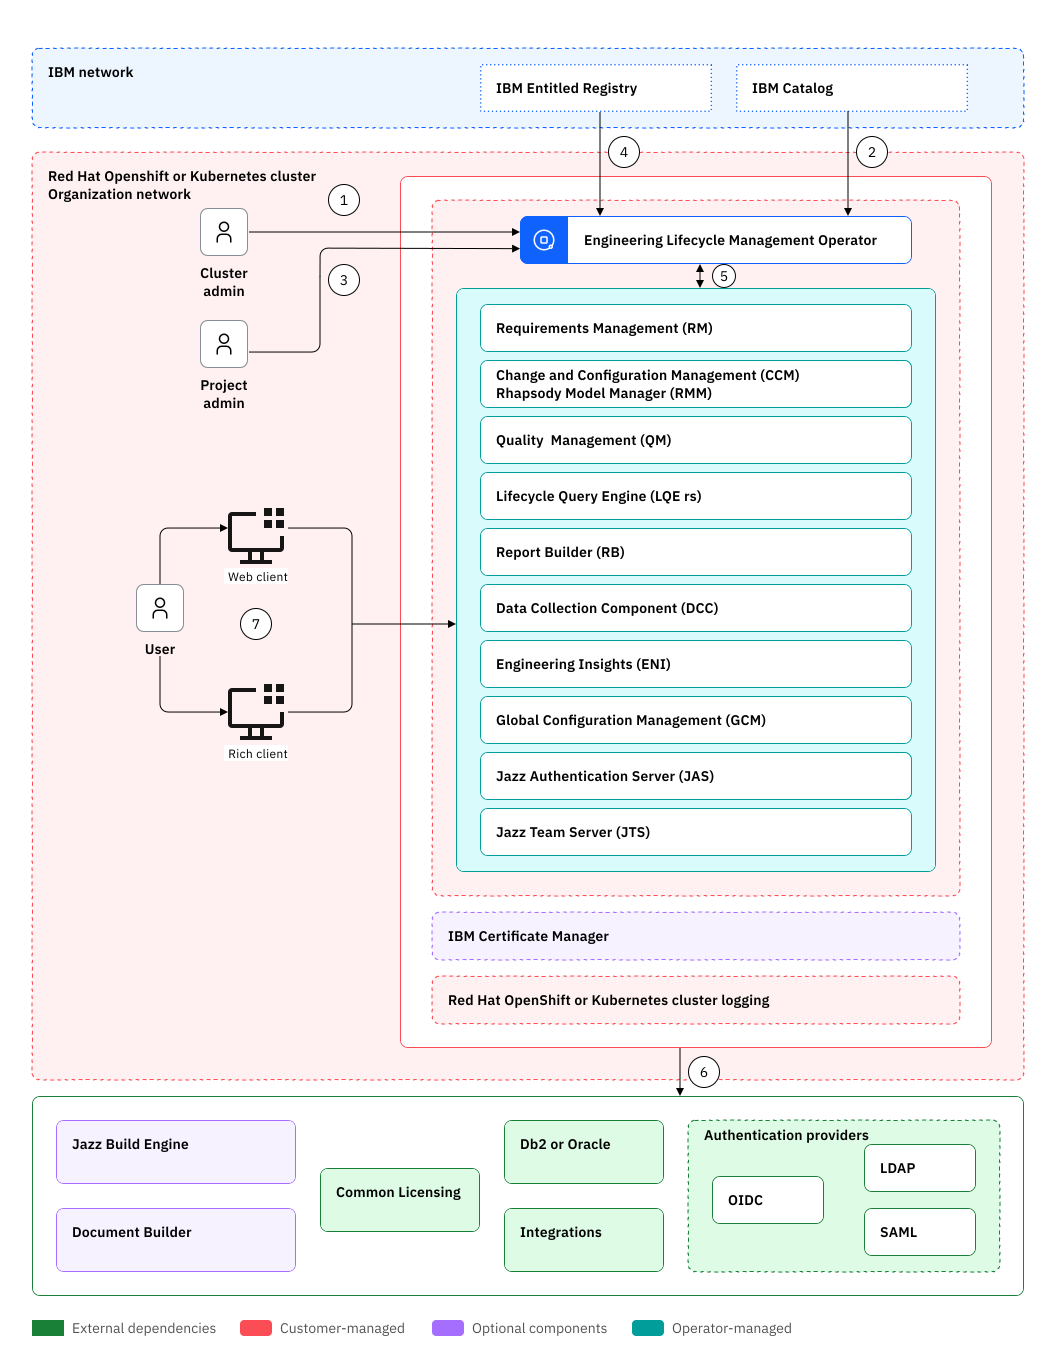 The performance test environment was an instance of this architecture hosted in the IBM Cloud, using the IBM Cloud Kubernetes service. The Kubernetes cluster was configured with 8 worker nodes. Each worker node was configured with 32 CPU and 128G of RAM.
A bare metal database server running Oracle 19c was used for the application databases. This server was configured with 1 terabyte of RAM and 96 CPUs. A RAID array of 16 NVME drives was used for the Oracle storage subsystem.
The performance tests focused on the ELM application containers, and applied load to containers of different sizes. The tests did not explicitly test the ELM operator or other parts of the IBM Cloud infrastructure.
The performance test environment was an instance of this architecture hosted in the IBM Cloud, using the IBM Cloud Kubernetes service. The Kubernetes cluster was configured with 8 worker nodes. Each worker node was configured with 32 CPU and 128G of RAM.
A bare metal database server running Oracle 19c was used for the application databases. This server was configured with 1 terabyte of RAM and 96 CPUs. A RAID array of 16 NVME drives was used for the Oracle storage subsystem.
The performance tests focused on the ELM application containers, and applied load to containers of different sizes. The tests did not explicitly test the ELM operator or other parts of the IBM Cloud infrastructure.
Test data
The repositories used for testing were of medium size:- 1 million RM artifacts
- 1 million QM artifacts
- 100,000 CCM work items
| Application | Database size (GB) |
|---|---|
| RM | 240 |
| LQE | 203 |
| CCM | 98 |
| QM | 67 |
RM container testing
This section provides analysis of the performance testing conducted for IBM Engineering Requirements Management DOORS Next. Two configurations were tested:- A small container (4 CPUs, 8G RAM)
- A medium container (8 CPUs, 16G RAM)
Workload description
Two workloads were used in the testing:- A standard workload that simulates a wide range of RM operations
- A views-only workload that simulates opening module views with varying filters
Summary of results
The test results are summarized below:| Workload | Link Validity | Small (4CPU, 8G RAM) | Medium (8CPU, 16G RAM) |
|---|---|---|---|
| Standard | Enabled | 25 users | 125 users |
| Standard | Disabled | 50 users | 200 users |
| Views only | Enabled | 25 users | 50 users |
| Views only | Disabled | 50 users | 100 |
The bottleneck is CPU. Adding more CPUs allows the container to support a higher user load.
Note that the workloads simulate opening module views that display link columns. If link validity is enabled, there is additional CPU load and the max user load is slightly lower than when link validity is disabled.
Small container
The small RM container was configured with 4 CPUs and 8G of RAM.Performance analysis - standard workload
The test results from executing the standard workload are shown below.- Performance Stability
- Performance degrades (sometimes significantly) when the user load exceeds 25-50 users
- With link validity disabled, the system performs well until 50-75 users
- CPU Utilization
- CPU reaches 100% between 75 and 100 users
- Response Time
- Response time increases significantly between 25 and 50 users
- Response time increases significantly between 50 and 75 users when link validity is disabled
- Throughput
- Maximum throughput is 20 transactions per second
- Conclusion
- The small environment can handle workloads up to 25 users (50 users when link validity is disabled). The bottleneck is CPU.