In this report, RQM performance is evaluated repeatedly when the size of the repository has increased linearly, up to 10 million test artifacts in total: it finds out that, in the standard performance regression lab, some read operations tend to become slower as the data volume grows, while most write operations are not impacted. The report also compares the system resource usage and observes that with the same performance load, the CPU utilization on the database server is fast approaching its full capacity. Both of the test and analysis methodologies used in the report are consistent with our traditional regressions; the data in the results has a tolerance of +/-5% margin of error. The report provides a summary of results, and can be drilled down further into more detail. It also highlights the significant performance improvements made in the RQM 604 release.
Use the page content section on the right hand side to navigate. We can provide details of raw results upon requests.
Introduction
This report evaluates the performance and scalability of
Rational Quality Manager (RQM) 6.0.3 release.
The test methodology involves these steps:
- Proportionally increase the number of the artifacts of one single project area in the QM repository using the standard datashape (see Data volume and shape ); each repository under test includes 100 thousand, 200 thousand, 300 thousand ... and 1 million test cases, respectively
- Repeat the same standard one-hour performance test load against each sized repository
- Compare the page performance results and the server statuses
Disclaimer
The information in this document is distributed AS IS. The use of this information or the implementation of any of these techniques is a customer responsibility and depends on the customers ability to evaluate and integrate them into the customers operational environment. While each item may have been reviewed by IBM for accuracy in a specific situation, there is no guarantee that the same or similar results will be obtained elsewhere. Customers attempting to adapt these techniques to their own environments do so at their own risk. Any pointers in this publication to external Web sites are provided for convenience only and do not in any manner serve as an endorsement of these Web sites. Any performance data contained in this document was determined in a controlled environment, and therefore, the results that may be obtained in other operating environments may vary significantly. Users of this document should verify the applicable data for their specific environment.
Performance is based on measurements and projections using standard IBM benchmarks in a controlled environment. The actual throughput or performance that any user will experience will vary depending upon many factors, including considerations such as the amount of multi-programming in the users job stream, the I/O configuration, the storage configuration, and the workload processed. Therefore, no assurance can be given that an individual user will achieve results similar to those stated here.
This testing was done as a way to compare and characterize the differences in performance between different versions of the product. The results shown here should thus be looked at as a comparison of the contrasting performance between different versions, and not as an absolute benchmark of performance.
Summary of results
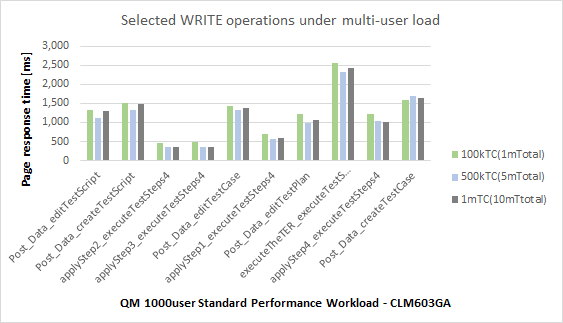
A series of load tests was conducted in the lab that showed consistent scalability trend as we increased the artifact numbers. To illustrate the performance characteristics, in this report, we extracted and compared the test data from the tests against repositories containing 100,000 Test Cases (total of 1 million Test Artifacts), 500,000 Test Cases (total of 5 million Test Artifacts), and 1 million Test Cases (total of 10 million Test Artifacts), respectively. In general, the average test results observed have an estimated +/-5% margin of error statistically. Here is the summary of findings:
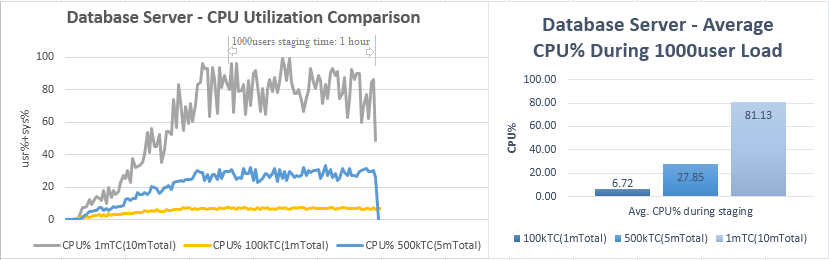
- We increased the repository size up to one million test cases (or ten million QM artifacts in total); the one-hour performance tests against each sized repository were run smoothly in the lab, while the servers remained healthy during the course of the load tests.
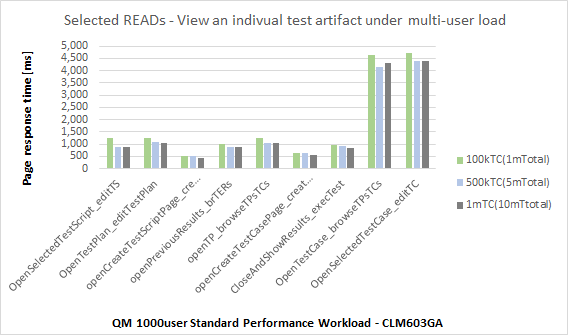
- There are pages of which the performance is sensitive to the growth of the artifacts, under the pre-defined datashape. Loading these pages, measured by page response time, will take longer as the number of artifacts in the repository continues to increase. These pages include the viewing, sorting, and searching of all test artifacts per artifact type. For instance, under the traditional regression test load, the browsing/sorting/searching of test plans, test cases, test scripts, and test execution records degrade as their total counts grow, as seen in the chart below.
Browsing/sorting/searching artifacts: response time increases as function of repository size, some pages degrade faster due to the more rapid growth of the artifact counts
| 
*TC: Test Case, TER: Test Case Execution Record. Every 100k Test Cases denotes 1M Test Artifacts in total. |
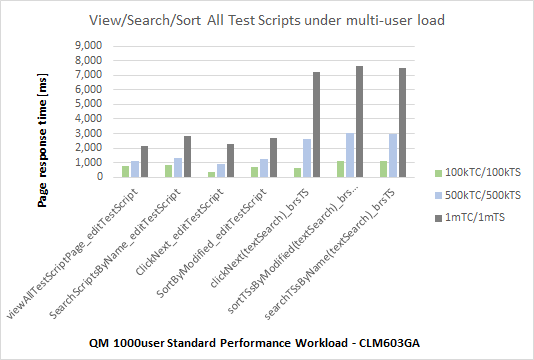
**TC: Test Case, TS: Test Script |
| 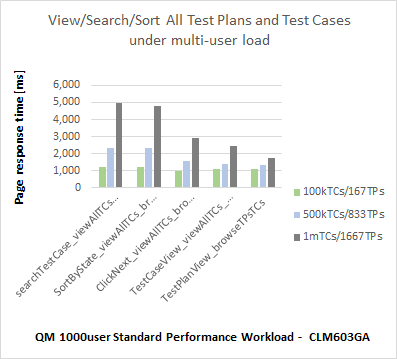
**TC: Test Case, TP: Test Plan |
Topology, network, and data volume
The topology under test is based on
Standard Topology (E1) Enterprise - Distributed / Linux / DB2.
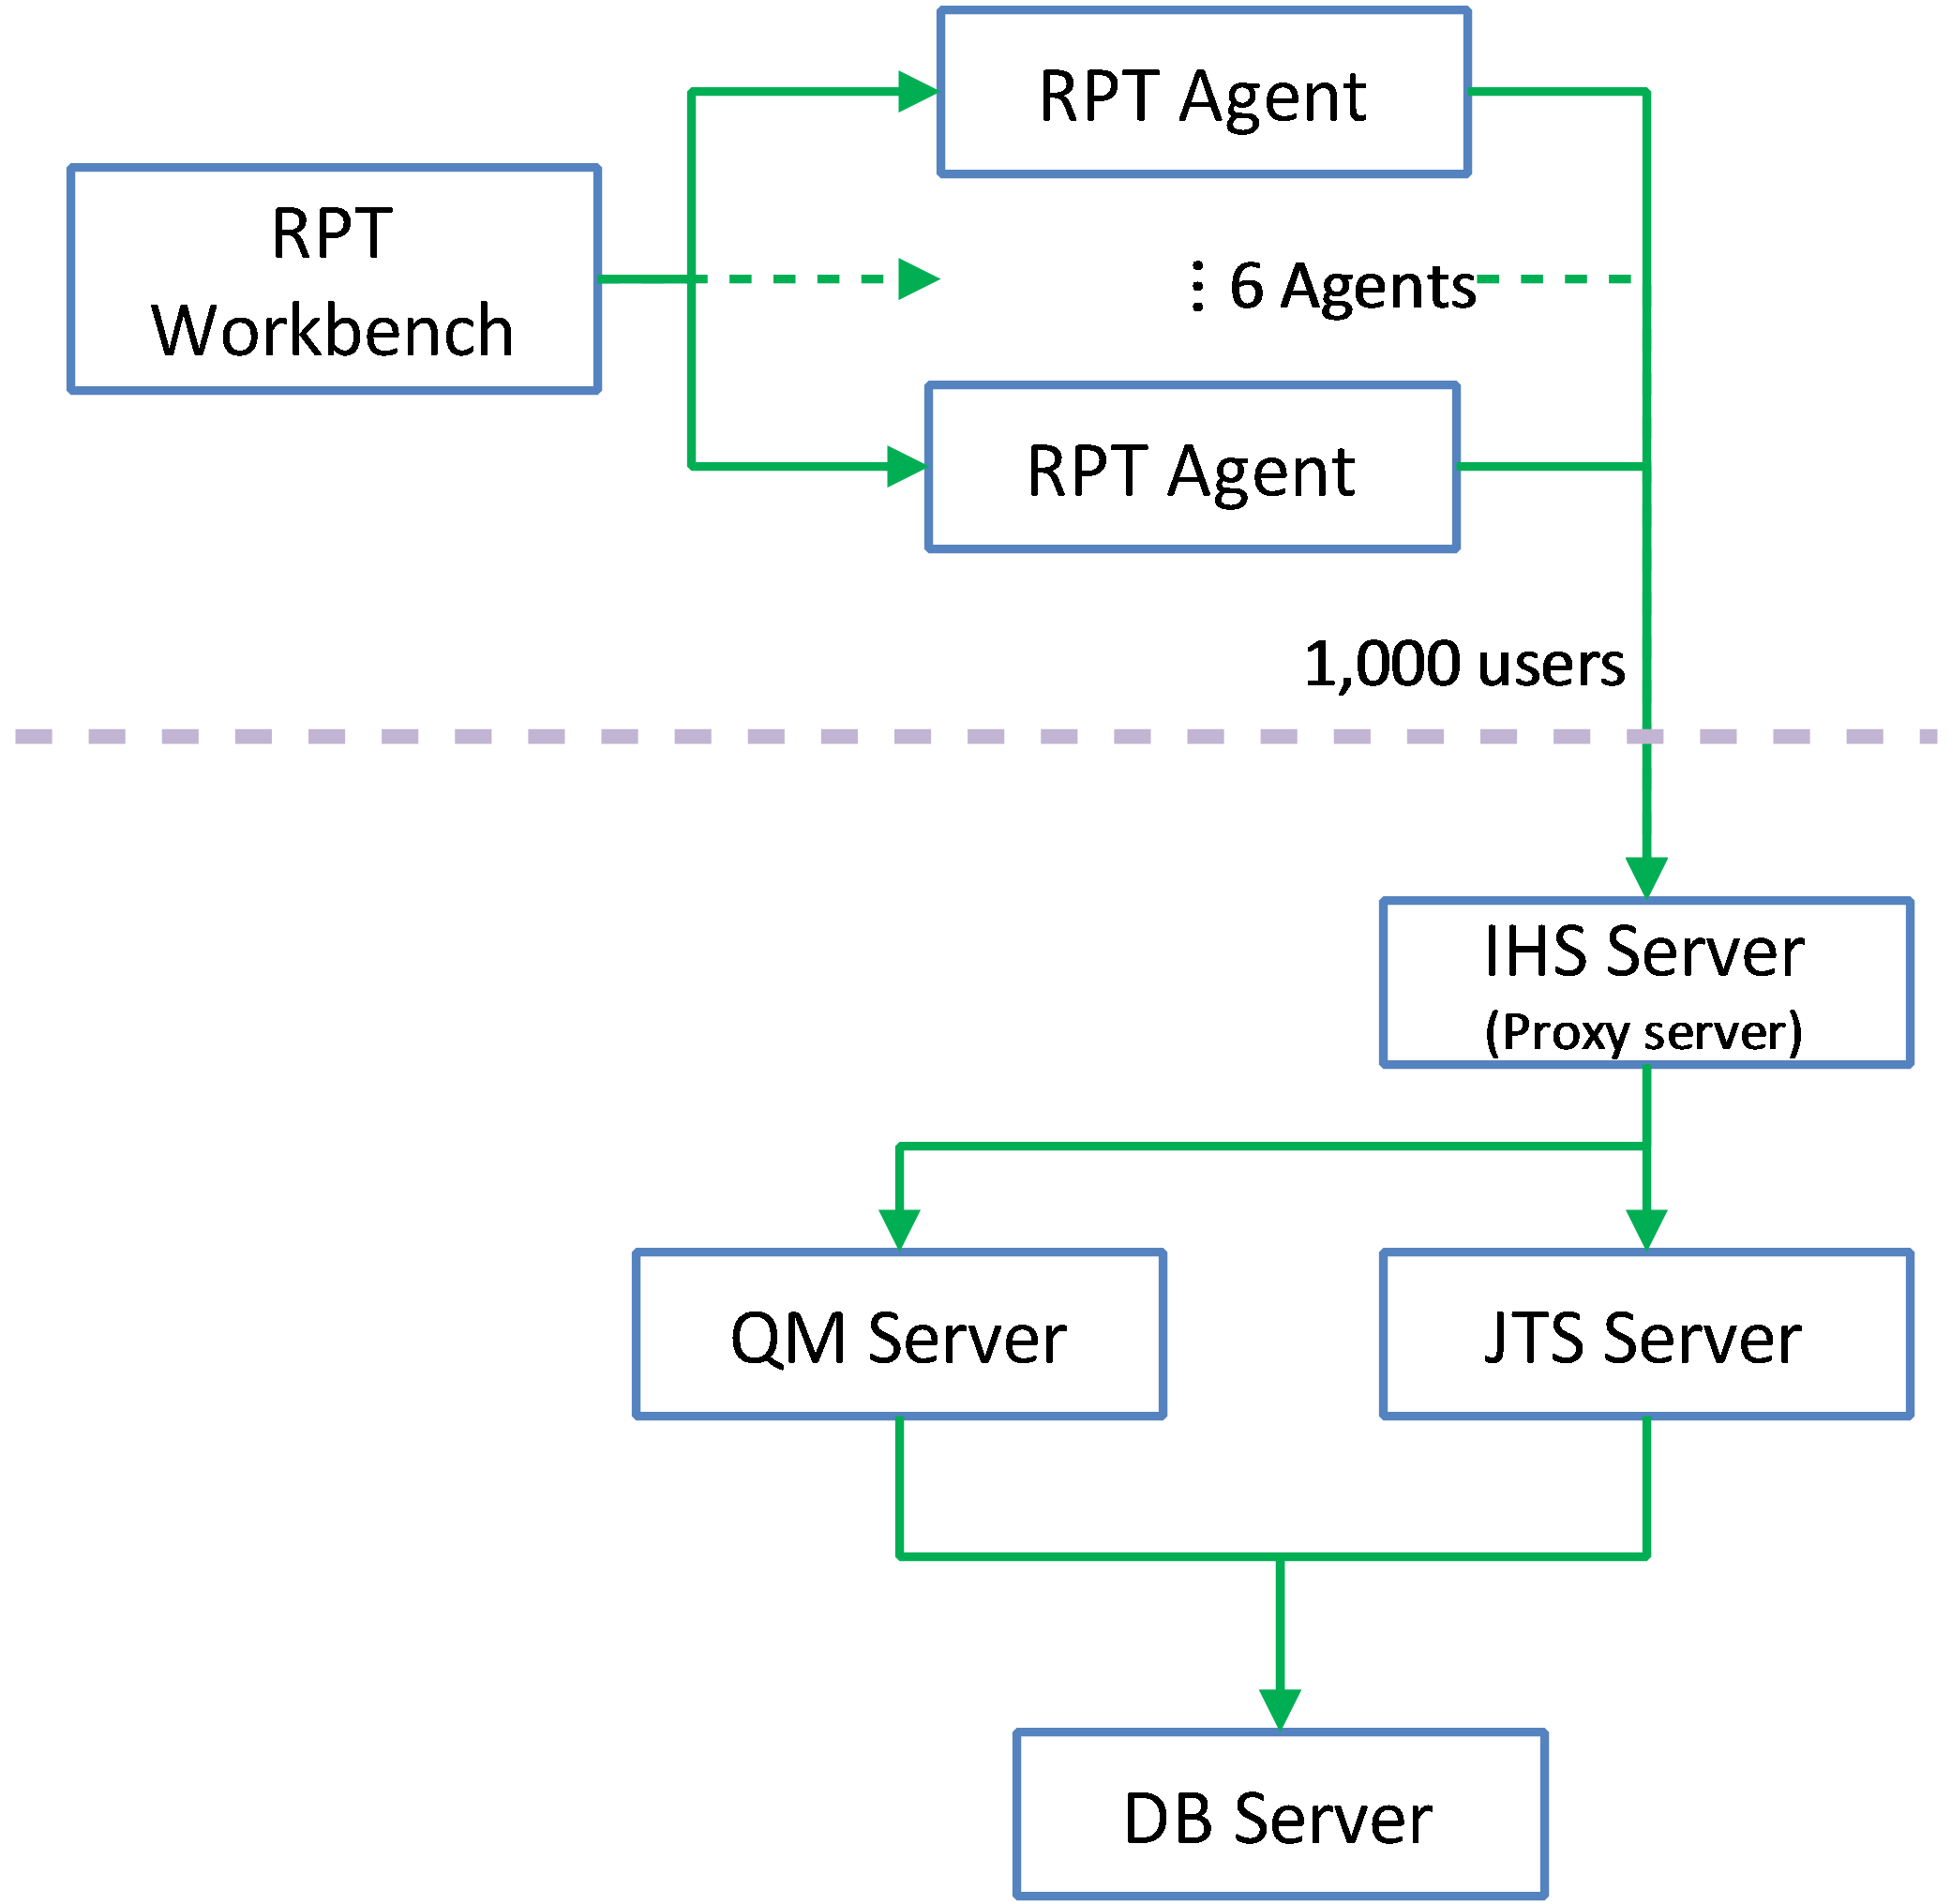
The specifications of machines under test are listed in the table below. Server tuning details listed in
Appendix - Key configuration parameters
| Function |
Number of Machines |
Machine Type |
CPU / Machine |
Total # of CPU vCores/Machine |
Memory/Machine |
Disk |
Disk capacity |
Network interface |
OS and Version |
| Proxy Server (IBM HTTP Server and WebSphere Plugin) |
1 |
IBM System x3250 M4 |
1 x Intel Xeon E3-1240 3.4GHz (quad-core) |
8 |
16GB |
RAID 1 -- SAS Disk x 2 |
299GB |
Gigabit Ethernet |
Red Hat Enterprise Linux Server release 6.5 |
| JTS Server |
1 |
IBM System x3550 M4 |
2 x Intel Xeon E5-2640 2.5GHz (six-core) |
24 |
32GB |
RAID 5 -- SAS Disk x 2 |
897GB |
Gigabit Ethernet |
Red Hat Enterprise Linux Server release 6.5 |
| QM Server |
1 |
IBM System x3550 M4 |
2 x Intel Xeon E5-2640 2.5GHz (six-core) |
24 |
32GB |
RAID 5 -- SAS Disk x 2 |
897GB |
Gigabit Ethernet |
Red Hat Enterprise Linux Server release 6.5 |
| Database Server |
1 |
IBM System x3650 M4 |
2 x Intel Xeon E5-2640 2.5GHz (six-core) |
24 |
64GB |
RAID 5 -- SAS Disk x 2 |
2.4TB |
Gigabit Ethernet |
Red Hat Enterprise Linux Server release 6.1 |
| RPT workbench |
1 |
IBM System x3550 M4 |
2 x Intel Xeon E5-2640 2.5GHz (six-core) |
24 |
32GB |
RAID 5 -- SAS Disk x 2 |
897GB |
Gigabit Ethernet |
Red Hat Enterprise Linux Server release 6.4 |
| RPT Agents |
6 |
VM image |
4 x Intel Xeon X5650 CPU (1-Core 2.67GHz) |
1 |
2GB |
N/A |
30GB |
Gigabit Ethernet |
Red Hat Enterprise Linux Server release 6.5 |
| Network switches |
N/A |
Cisco 2960G-24TC-L |
N/A |
N/A |
N/A |
N/A |
N/A |
Gigabit Ethernet |
24 Ethernet 10/100/1000 ports |
N/A: Not applicable.
vCores = Cores with hyperthreading
Network connectivity
All server machines and test clients are located on the same subnet. The LAN has 1000 Mbps of maximum bandwidth and less than 0.3 ms latency in ping.
Data volume and shape
The artifacts were created and increased gradually using the datagen utility. Every increase of 100,000 Test Cases in the repository is consisted of the following increase per artifact type:
- 167 test plans
- 100,000 test scripts
- 100,000 test cases
- 400,000 test case execution records
- 400,000 test case results
- 10,000 test suites
- 667 test environments
- 2,000 test phases
- 20 build definitions
- 4,747 execution sequences
- 10,000 test suite execution records
- 50,000 test suite execution results
- 3,333 build records
- QM Database size increase on disk ~ 31 GB
The artifact maintains the following associations:
- each test plan is linked to 600 unique test cases, and 600 unique test scripts
- each test suite contains 500 test cases
In addition, there are 5,000 work items (defects) in the CCM project area. The CCM repository size remains unchanged.
In this test, the
Configuration Management is not enabled.
Methodology
Rational Performance Tester(RPT) was used to simulate the workload created using the web client. Each user completed a random use case from a set of
available use cases. A Rational Performance Tester script is created for each use case. The scripts are organized by pages and each page represents a user action.
The work load is role based as each of the areas defined under sequence of actions which are separated into individual user groups within an RPT schedule.
The settings of the RPT schedule is shown below:

User roles, test cases and workload characterization
User Roles
| Use role |
% of Total |
Related Actions |
| QE Manager |
8 |
Test plan create, Browse test plan and test case, Browse test script, Simple test plan copy, Defect search, View dashboard |
| Test Lead |
19 |
Edit Test Environments, Edit test plan, Create test case, Bulk edit of test cases, Full text search, Browse test script, Test Execution, Defect search |
| Tester |
68 |
Defect create, Defect modify, Defect search, Edit test case, Create test script, Edit test script, Test Execution, Browse test execution record |
| Dashboard Viewer |
5 |
View dashboard(with login and logout) |
Test Cases
| Use Role |
Percentage of the user role |
Sequence of Operations |
| QE Manager |
1 |
Test plan create:user creates test plan, then adds description, business objectives, test objectives, 2 test schedules, test estimate quality objectives and entry and exit criteria. |
| 26 |
Browse test plans and test cases: user browses assets by: View Test Plans, then configure View Builder for name search; open test plan found, review various sections, then close. Search for test case by name, opens test case found, review various sections, then close. |
| 26 |
Browse test script: user search for test script by name, open it, reviews it, then closes. |
| 1 |
Simple test plan copy: user search test plan by name, then select one, then make a copy. |
| 23 |
Defect search: user searches for specific defect by number, user reviews the defect (pause), then closes. |
| 20 |
View Dashboard: user views dashboard |
| Test Lead |
8 |
Edit Test Environment: user lists all test environments, and then selects one of the environments and modifies it. |
| 15 |
Edit test plan: list all test plans; from query result, open a test plan for editing, add a test case to the test plan, a few other sections of the test plan are edited and then the test plan is saved. |
| 4 |
Create test case: user create test case by: opening the Create Test Case page, enters data for a new test case, and then saves the test case. |
| 1 |
Bulk edit of test cases: user searches for test cases with root name and edits all found with owner change. |
| 3 |
Full text search: user does a full text search of all assets in repository using root name, then opens one of found items. |
| 32 |
Browse test script: user search for test script by name, open it, reviews it, then closes. |
| 26 |
Test Execution: selects View Test Execution Records, by name, starts execution, enters pass/fail verdict, reviews results, sets points then saves. |
| 11 |
Defect search: user searches for specific defect by number, user reviews the defect (pause), then closes. |
| Tester |
8 |
Defect create: user creates defect by: opening the Create Defect page, enters data for a new defect, and then saves the defect. |
| 5 |
Defect modify: user searches for specific defect by number, modifies it then saves it. |
| 14 |
Defect search: user searches for specific defect by number, user reviews the defect (pause), then closes. |
| 6 |
Edit test case: user searches Test Case by name, the test case is then opened in the editor, then a test script is added to the test case (user clicks next a few times (server size paging feature) before selecting test script), The test case is then saved. |
| 4 |
Create test script: user creates test case by: selecting Create Test Script page, enters data for a new test script, and then saves the test script. |
| 8 |
Edit test script: user selects Test Script by name. test script then opened for editing, modified and then saved. |
| 42 |
Test Execution: selects View Test Execution Records, by name, starts execution, enters pass/fail verdict, reviews results, sets points then saves. |
| 7 |
Browse test execution record: user browses TERs by: name, then selects the TER and opens the most recent results. |
| Dashboard Viewer |
100 |
View dashboard(with login and logout): user logs in, views dashboard, then logs out. This user provides some login/logout behavior to the workload |
Response time comparison
The page performance is measured as mean value (or average) of its response time in the result data. For the majority of the pages under tests, there is little variation between runs, and the mean values are close to median in the sample for the load.
Detailed performance results
Average page response time comparison breakdown
NOTE
For all usecase comparison charts, the unit is millisecond, and for the data, smaller is better.
Browse Test Plans & Test Cases
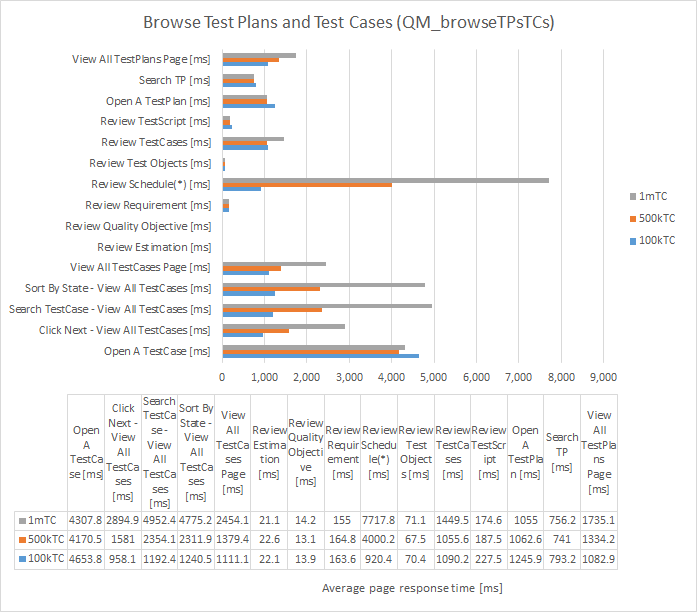
*Page will be improved in 604, see Performance enhancement highlights in 604
Back to Test Cases & workload characterization
Browse Test Scripts
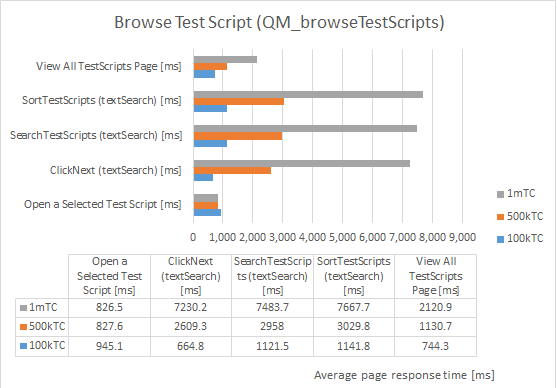 Back to Test Cases & workload characterization
Test Execution Record Browsing
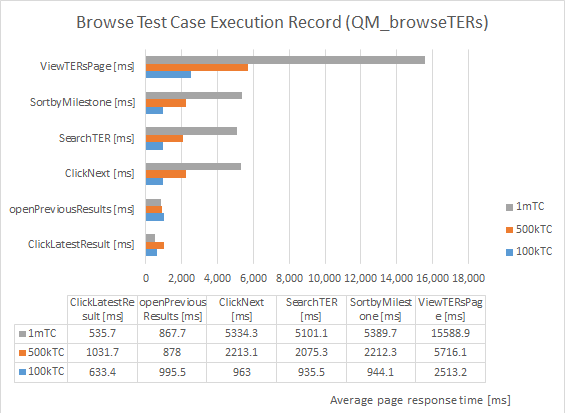 Back to Test Cases & workload characterization
Create Defect
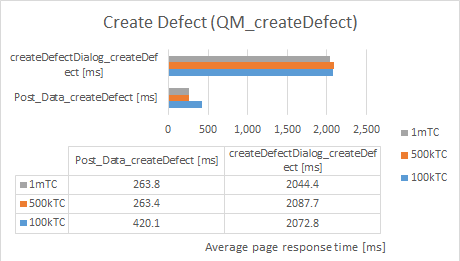 Back to Test Cases & workload characterization
Create Test Plan

*Page will be improved in 604, see Performance enhancement highlights in 604
Back to Test Cases & workload characterization
Create Test Case
 Back to Test Cases & workload characterization
Create Test Script
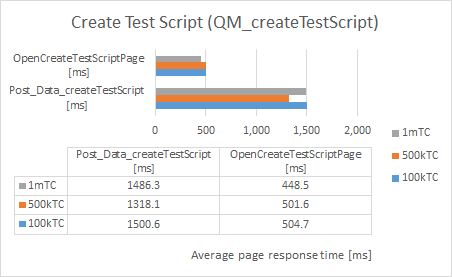 Back to Test Cases & workload characterization
Edit Test Case
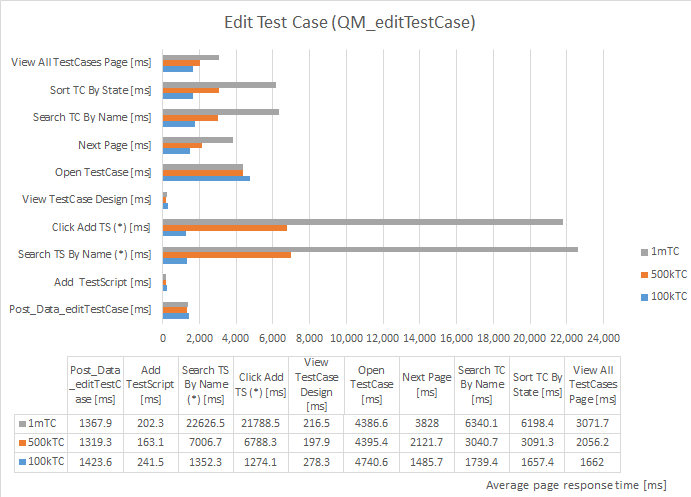
*Page will be improved in 604, see Performance enhancement highlights in 604
Back to Test Cases & workload characterization
Edit Test Environment
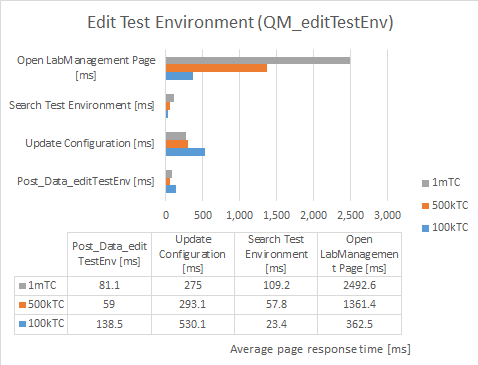 Back to Test Cases & workload characterization
Edit Test Plan
 Back to Test Cases & workload characterization
Edit Test Script
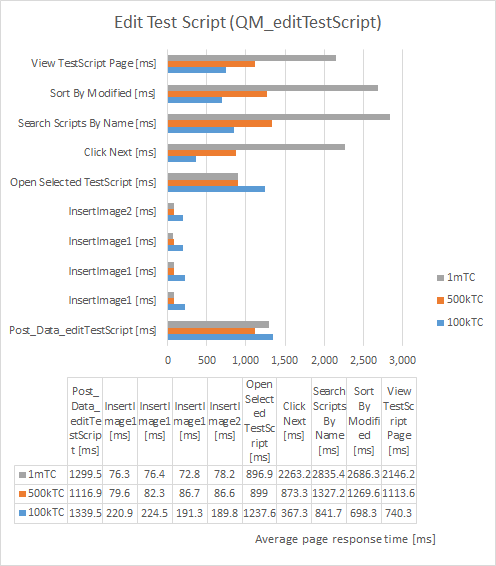 Back to Test Cases & workload characterization
Test Execution For 4 Steps
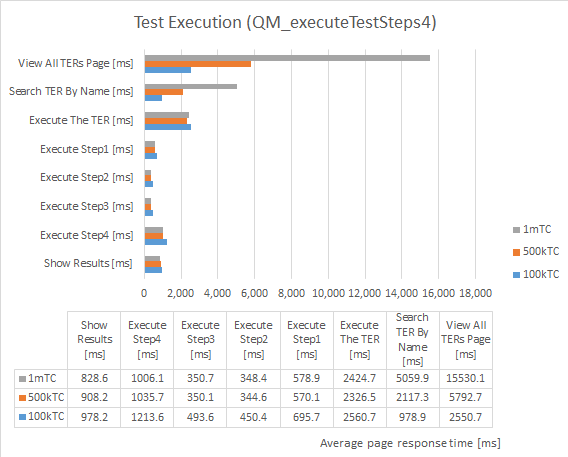 Back to Test Cases & workload characterization
Simple Test Plan Copy
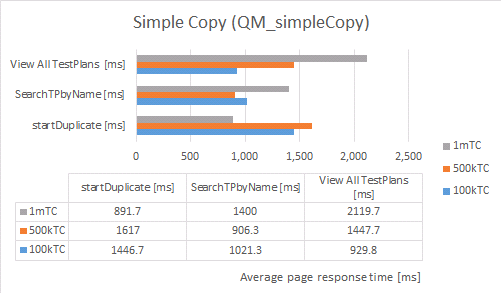 Back to Test Cases & workload characterization
Bulk Edit of Test Cases
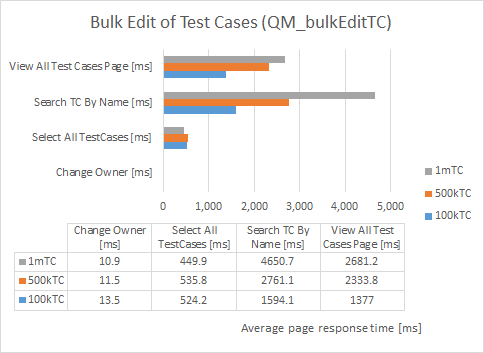 Back to Test Cases & workload characterization
Full Text Search
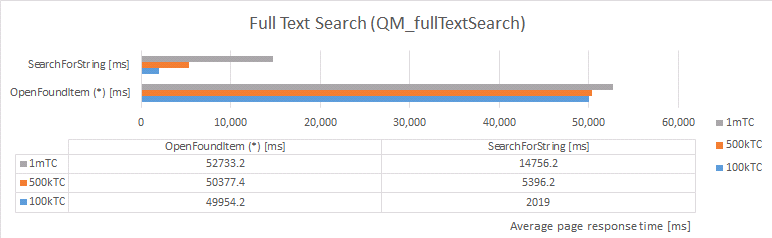
*Page will be improved in 604, see Performance enhancement highlights in 604
Back to Test Cases & workload characterization
Defect Search
 Back to Test Cases & workload characterization
Defect Modify
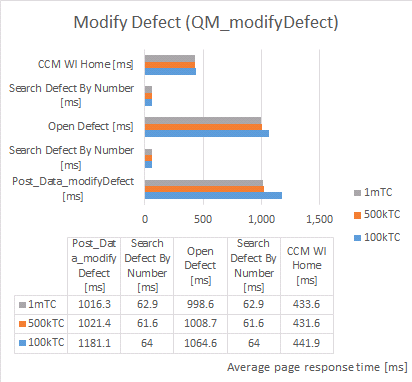 Back to Test Cases & workload characterization
RPT network transfer comparison

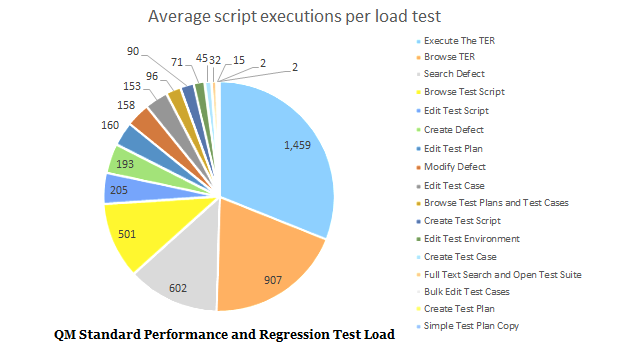
RPT script executions
RPT script average executions during staging
Resource utilization
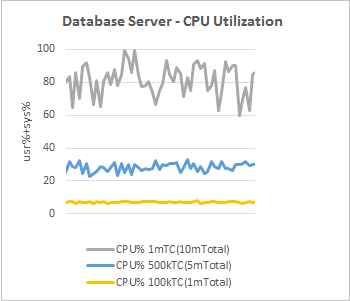
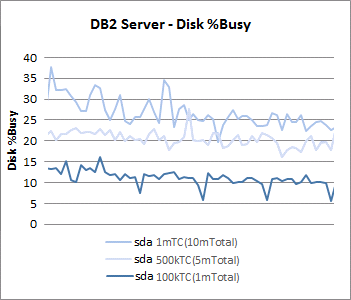
DB2 Server resource utilization comparison:
| |
1000users performance load against 100kTestCases vs 1mTestCases based repository |
| CPU |
 |
Disk |
 |
| Memory |
 |
Network |
 |
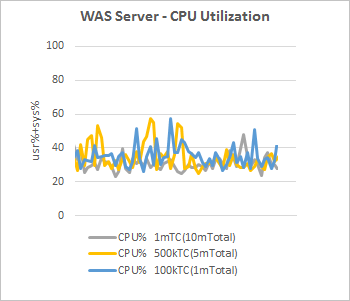
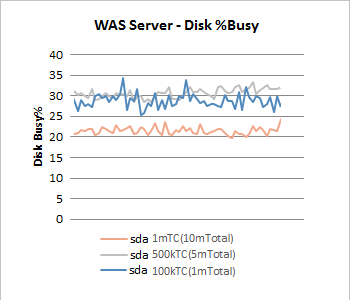
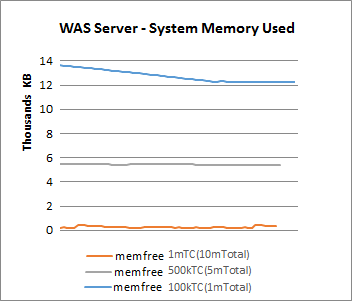
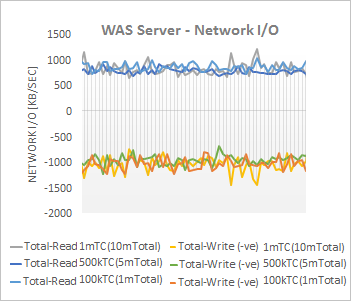
WAS Server resource utilization comparison:
| |
1000users performance load against 100kTestCases vs 1mTestCases based repository |
| CPU |
 |
Disk |
 |
| Memory |
 |
Network |
 |
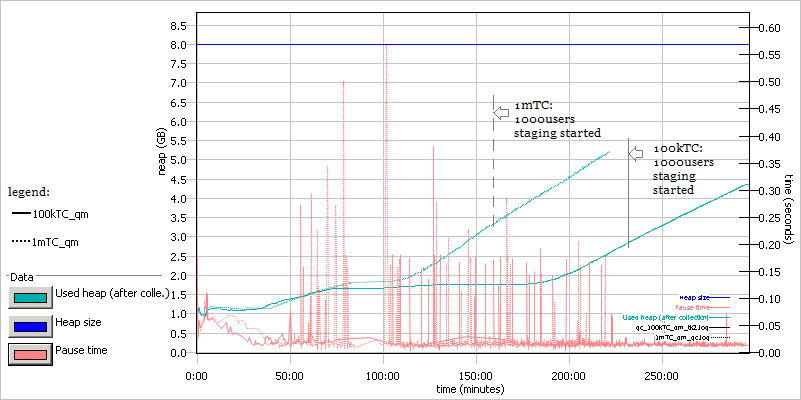
Garbage collection - JVM GC Chart
For JVM parameter please refer to
Appendix - Key configuration parameters
Verbose garbage collection is enabled to log the GC activities. These GC logs showed very little variation between runs. There is also no discernible difference between versions. Below is one example of the output from the GC log for each application.
WAS JVM Garbage Collections
| |
same load against 1mTestCases vs 100kTestCases based repository |
| QM |
 |
| JTS |
 |
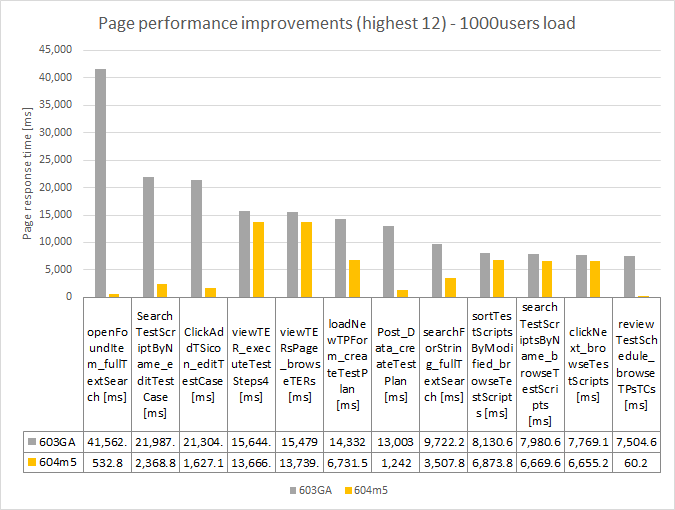
Highlight of performance improvements in RQM 6.0.4 release
Performance enhancements have been made into the 6.0.4 release; for details please refer to article
Collaborative Lifecycle Management Performance Report RQM 604 Release
Appendix - Key configuration parameters
Product
|
Version |
Highlights for configurations under test |
| IBM HTTP Server for WebSphere Application Server |
8.5.5.9 |
IBM HTTP Server functions as a reverse proxy server implemented via Web server plug-in for WebSphere Application Server.
Configuration details can be found from the CLM infocenter.
HTTP server (httpd.conf):
OS Configuration:
- max user processes = unlimited
|
| IBM WebSphere Application Server Base | 8.5.5.9 | JVM settings:
- GC policy and arguments, max and init heap sizes:
 -Xgcpolicy:gencon -Xmx8g -Xms8g -Xmn2g -Xss786K -Xcompressedrefs -Xgc:preferredHeapBase=0x100000000
 -verbose:gc -Xverbosegclog:gc.log -XX:MaxDirectMemorySize=1G
SDK version:
- IBM WebSphere SDK for Java Technology Edition Version 7.1.3.40
Thread pools:
- Maximum WebContainer = Minimum WebContainer = 500
OS Configuration:
System wide resources for the app server process owner:
- max user processes = unlimited
- open files = 65536
|
| DB2 |
ESE 10.1.0.5 |
|
| LDAP server |
|
|
| License server |
|
N/A |
| RPT workbench |
8.3.0.3 |
Defaults |
| RPT agents |
8.3.0.3 |
Defaults |
| Network |
|
Shared subnet within test lab |
About the authors:
HongyanHuo is a performance engineer focusing on the performance test & analysis of products in the Collaborative Lifecycle Management family.
Questions and comments:
- What other performance information would you like to see here?
- Do you have performance scenarios to share?
- Do you have scenarios that are not addressed in documentation?
- Where are you having problems in performance?
Warning: Can't find topic Deployment.PerformanceDatasheetReaderComments

