 Migration guide for Rational DOORS Next Generation 6.0
Authors: GustafSvensson, VaughnRokosz Date: May 29, 2015
Build basis: Rational Doors Next Generation (RDNG) 6.0
Introduction
This document summarizes the results of our performance testing of the upgrade to IBM® Rational® DOORS® Next Generation (RDNG) 6.0. We look at the time required to upgrade from RDNG 5.0.2 to 6.0 in a variety of configurations, and identify the factors that most influence upgrade time, including:- the total number of artifacts in the repository
- the number of comments and links
- the impact of baselines in the 5.0.x data
- the network latency to the database server
- using Oracle vs. DB2
We also look at how the size of the database is impacted by the upgrade.
Upgrade times in your environments may be different that what we observed. Please be sure to review our standard disclaimer.
Summary of test results
General considerations
There are two general considerations for upgrade performance:- Keeping the database statistics updated
- Adjusting the heap size for the repotools-rm command
Database statistics
Because there are significant changes to the schema of the DNG database for the 6.0 release, it is important to be sure that the database statistics are kept up to date. Some of the new DNG tables will start out empty and then grow during upgrade. This change in table size can degrade performance of the SQL queries that are executed during upgrade if your database is not configured to update statistics automatically.If you update your database statistics manually, you may need to update the statistics during the upgrade process. You can use the following commands:
DB2
DB2 REORGCHK UPDATE STATISTICS ON TABLE ALL
Oracle
EXEC DBMS_STATS.gather_schema_stats('RMSCHEMA');
(where RMSCHEMA is the name of the RM database).
Repotools JVM heap size
For larger repositories (> 100K artifacts), the default heap size in the repotools-rm command is too small. The upgrade will fail unless you raise the heap size from the default of 4G to 8G. Our tests also suggest that the 8G heap size can improve upgrade performance by 20%, for smaller repositories.
The repotools script was updated with the following line; VMARGS="$VMARGS -Xmx8G"
Impact of repository size and shape
The main factor that impacts upgrade time is the total number of artifacts of the following types: requirements, comments, and links. It takes roughly 5 minutes per 100K artifacts to upgrade with no baselines present. In our largest test with 4.9 million total requirements, comments, and links, the migration time for those artifacts was 4 hours.
A secondary factor that impacts upgrade time is the number of artifacts with comments. There is an additional upgrade step which deals with comments. In our largest test, we migrated 1.6 million comments associated with 551,000 artifacts and this took 71 minutes. The total upgrade time for this configuration was 5 hours and 26 minutes.
Baselines and reviews will add additional cost. There are several factors that determine the time it takes to migrate baselines and reviews. The number of artifacts included in baselines and reviews do not impact the migration time but the number of artifacts with revisions do. Each baseline and review also adds extra processing time.
When we upgraded a repository with 2 baselines per module (where each baseline included 10% of the module artifacts), the time to upgrade doubled.
Database growth during upgrade
You can expect the DNG database to grow at least 10% during the upgrade process. The 6.0 release introduces several major new features, and these features involve changes to the database schema. In our testing the database size grew with 1GB for every 300,000 artifacts. In our most extreme result (with almost 5 million artifacts), the size of the DNG database nearly doubled (from 22G to 40G). Customer data shows this ratio can vary.
Impact of network latency to the database server
We looked at the impact of increasing the network latency between the system where we ran the upgrade to the database server. There is a linear increase in total upgrade times as the network latency increases, and the upgrade times double for each additional 2 milliseconds of network latency.
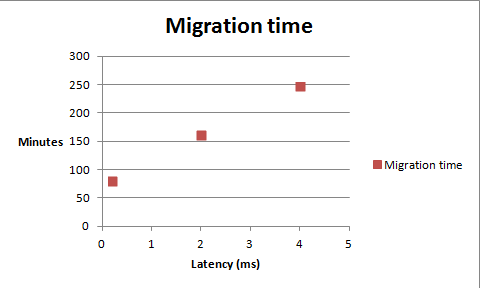
For best upgrade performance, be sure that the network connection to the database service is fast.
Comparing Oracle and DB2
We compared the upgrade times for two systems: one using DB2 and one using Oracle. There was no significant difference in upgrade times.
Appendix A: Standard disclaimer
The information in this document is distributed AS IS. The use of this information or the implementation of any of these techniques is a customer responsibility and depends on the customer’s ability to evaluate and integrate them into the customer’s operational environment. While each item may have been reviewed by IBM for accuracy in a specific situation, there is no guarantee that the same or similar results will be obtained elsewhere. Customers attempting to adapt these techniques to their own environments do so at their own risk. Any pointers in this publication to external Web sites are provided for convenience only and do not in any manner serve as an endorsement of these Web sites. Any performance data contained in this document was determined in a controlled environment, and therefore, the results that may be obtained in other operating environments may vary significantly. Users of this document should verify the applicable data for their specific environment.
Performance is based on measurements and projections using standard IBM benchmarks in a controlled environment. The actual throughput or performance that any user will experience will vary depending upon many factors, including considerations such as the amount of multi-programming in the user’s job stream, the I/O configuration, the storage configuration, and the workload processed. Therefore, no assurance can be given that an individual user will achieve results similar to those stated here.
This testing was done as a way to compare and characterize the differences in performance between different versions of the product. The results shown here should thus be looked at as a comparison of the contrasting performance between different versions, and not as an absolute benchmark of performance.
Appendix B: Summary of all test runs
The test results
|
Repository |
Database vendor |
Total migration time |
Artifacts with comments / time to migrate |
Time to migrate 10,000 artifacts with comments |
Total number of artifacts |
Time to migrate 100,000 artifacts |
Database size before/after migration |
Database size change GB/% |
Database size increase for 100,000 artifacts |
Latency |
|
1 project shape 1 |
DB2 10.1 |
40 minutes |
85,930 / 11 minutes |
1 minute 17 seconds |
823,441 versions took 27 minutes |
3 minutes 17 seconds |
4.9GB / 7.98GB |
3.08GB / 63% |
0.374GB |
0.2 ms |
|
6 projects shape 1 |
DB2 10.1 |
5 hours 26 minutes |
550,580 / 71 minutes |
1 minuted 17 seconds |
4,940,678 versions took 4 Hours |
4 minutes 51 seconds |
22.24GB / 40.28GB |
18.04GB / 81% |
0.365GB |
0.2 ms |
|
1 project shape 2 |
DB2 10.1 |
1 hour 15 minutes |
80,625 / 13 minutes |
1 minute 37 seconds |
634,101 versions took 1 hour 7 minutes |
9 minutes 28 sec |
9.61GB / 11.95GB |
2.34GB / 24% |
0.369GB |
0.2 ms |
|
3 projects shape 2 |
DB2 10.1 |
3 hours 38 minutes |
170,555 / 28 minutes |
1 minute 39 sec |
1,483,437 took 2 hours 38 minutes |
10 minutes 39 seconds |
23.19GB / 28.55GB |
5.36GB / 23% |
0.361GB |
0.2 ms |
|
Comparing DB2 and Oracle |
||||||||||
|
1 project shape 2 |
DB2 10.1 |
2 hours 6 minutes |
65,555 / 13 minutes |
1 minute 59 seconds |
552,106 took 1 hours 45 minutes |
19 minutes |
8.95GB / 11.13GB |
2.18GB / 24% |
0.395GB |
0.2 ms |
|
1 project shape 2 |
Oracle 12c |
1 hour 47 minutes |
69,889/ 8 minutes 41 seconds |
1 minute 15 seconds |
704,488 took 1 hours 36 minutes |
13 minutes 36 seconds |
8.94GB / 10.82GB |
1.88GB / 21% |
0.267GB |
0.2 ms |
|
Latency tests |
||||||||||
|
1 project shape 2 |
DB2 10.1 |
1 hour 21 minutes |
80,625 / 4 minutes 45 seconds |
35 seconds |
633,750 versions took 1 hour 15 minutes |
11 minutes 50 seconds |
10.18GB / 12.22GB |
2.04GB / 20% |
0.322GB |
0.2 ms |
|
1 project shape 2 |
DB2 10.1 |
2 hours 43 minutes |
80,625 / 9 minutes 18 seconds |
1 minute 12 seconds |
633,750 versions took 2 hours 31 minutes |
23 minutes 50 seconds |
10.18GB / 12.22GB |
2.04GB / 20% |
0.322GB |
2 ms |
|
1 project shape 2 |
DB2 10.1 |
4 hours 8 minutes |
80,625/ 14 minutes 58 seconds |
1 minute 51 seconds |
633,750 versions took 3 hours 51 minutes |
36 minutes 27 seconds |
10.18GB / 12.22GB |
2.04GB / 20% |
0.322GB |
4 ms |
|
Migrations done using customer data |
||||||||||
|
Customer A |
DB2 10.1 |
48 minutes |
9,385 / 1 minute |
1 minute |
100,357 versions took 44 minutes |
43 minutes 51 sec |
17.6GB / 19.1GB |
1.5GB / 9% |
1.494GB |
0.22 ms |
|
Customer B |
DB2 10.1 |
46 minutes |
0 comments |
Not applicable |
513,371 versions took 42 minutes |
8 minutes 11 sec |
8.6GB / 9.2GB |
0.6GB / 7% |
0.117GB |
0.22 ms |
Data volume and shape
For our migration tests we used the following project types
|
Artifact type |
Project shape 1 |
Project shape 2 |
Customer A |
Customer B |
|
Modules |
52 |
52 |
161 |
452 |
|
Folders |
119 |
119 |
3743 |
774 |
|
Requirement artifacts |
1,118 |
86,171 |
19,659 |
40,005 |
|
Module artifacts |
85,000 |
85,000 |
5,201 |
123,792 |
|
Comments |
260,582 |
244,132 |
9,385 |
0 |
|
Links |
304,029 |
151,195 |
20,425 |
93,174 |
|
Collections |
14 |
14 |
285 |
37 |
|
Tags |
300 |
350 |
546 |
10 |
|
Views |
100 |
200 |
1026 |
23 |
|
Terms |
238 |
238 |
521 |
601 |
|
Reviews |
0 |
0 |
342 |
0 |
|
Baselines |
0 |
115 |
57 |
0 |
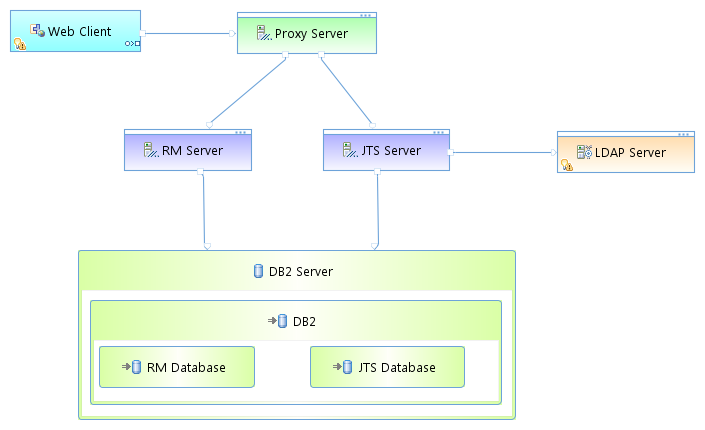
Appendix C: Topology
The topology that was used in our testing is based on the standard (E1) Enterprise - Distributed / Linux / DB2 topology
Key:
- RM Server: Rational DOORS Next Generation Server
- JTS: Jazz™ Team Server
All server machines and test clients are located on the same subnet. The LAN has 1000 Mbps of maximum bandwidth and 0.2 ms average latency in ping.
Tested hardware and software configurations
The specifications of machines used for most of the upgrade tests are listed below:
| Function | Machine Type | CPU / Machine | Total # of CPU Cores/Machine | Memory/Machine | Disk | Disk capacity | Network interface | OS and Version |
|---|---|---|---|---|---|---|---|---|
| RDNG Server | IBM System x3550 M4 | 2 x Intel Xeon E5-2640 2.5GHz (six-core) | 24 | 32GB | RAID 5 -- SAS Disk x 4 | 279GB | Gigabit Ethernet | Red Hat Enterprise Linux Server release 6.3 (Santiago) |
| Database Server | IBM System x3650 M4 | 2 x Intel Xeon E5-2640 2.5GHz (six-core) | 24 | 64GB | RAID 10 -- SAS Disk x 16 | 279GB | Gigabit Ethernet | Red Hat Enterprise Linux Server release 6.3 (Santiago) |
The tests comparing upgrade times between Oracle and DB2 used virtual systems with the following characteristics:
| Function | Machine Type | CPU / Machine | Total # of CPU Cores/Machine | Memory/Machine | Disk capacity | Network interface | OS and Version |
|---|---|---|---|---|---|---|---|
| RDNG Server | VM image | 8 | 8 | 32GB | 80GB | Gigabit Ethernet | Red Hat Enterprise Linux Server release 6.6 (Santiago) |
| Database Server | VM image | 8 | 8 | 16GB | 80GB | Gigabit Ethernet | Red Hat Enterprise Linux Server release 6.6 (Santiago) |
For more information
About the authors
Questions and comments:
- What other performance information would you like to see here?
- Do you have performance scenarios to share?
- Do you have scenarios that are not addressed in documentation?
- Where are you having problems in performance?
Warning: Can't find topic Deployment.PerformanceDatasheetReaderComments
-
 Deployment web
-
 Planning and design
- Installing and upgrading
- Migrating and evolving
- Integrating
- Administering
- Monitoring
- Troubleshooting
Status icon key:
-
 To do
To do
- Under construction
-
 New
New
-
 Updated
-
 Constant change
- None - stable page
- Smaller versions of status icons for inline text:
-


Contributions are governed by our Terms of Use. Please read the following disclaimer.
Dashboards and work items are no longer publicly available, so some links may be invalid. We now provide similar information through other means. Learn more here.