 Collaborative Lifecycle Management performance report: RDNG 5.0
Authors: GustafSvensson Date: June 2, 2014
Build basis: Rational DOORS Next Generation 5.0
- Introduction
- Findings
- Topology
- Methodology
- Results
- Observation
-
- Create a collection
- Filter a query
- Open nested folders
- Manage folders
- Query by ID
- View collections
- Check suspect links
- Create a multi-value artifact
- Create an artifact
- Show artifacts in a Tree view
- Open graphical artifacts
- Create and edit a storyboard
- Display the hover information for a collection
- Query by string
- Create a PDF report
- Create a Microsoft Word report
- Browse project folder
- Open collection and display first page
- Create artifact in large module
- Display module history
- Create traceability report using 50 artifact
- Open large module
- Scroll through a large module
- Switch between modules
- Edit a module artifact
- Save a module
- Create a large module report
- Uploading 4 MB file in new artifact
- Switch view
- Hover over linked artifact
-
- Appendix A
Introduction
This report compares the performance of Rational DOORS Next Generation (RDNG) version 5.0 to the previous Rational Requirements Composer (RRC) version 4.0.6 release. The test objective is achieved in three steps:
- Run version 4.0.6 with standard 1.5 hour test using 400 concurrent users.
- Run version 5.0 with standard 1.5 hour test using 400 concurrent users.
- The test is run three times for each version and the resulting six tests are compared with each other. Three tests per version is used to get a more accurate picture since there are variations expected between runs.
Disclaimer
The information in this document is distributed AS IS. The use of this information or the implementation of any of these techniques is a customer responsibility and depends on the customer’s ability to evaluate and integrate them into the customer’s operational environment. While each item may have been reviewed by IBM for accuracy in a specific situation, there is no guarantee that the same or similar results will be obtained elsewhere. Customers attempting to adapt these techniques to their own environments do so at their own risk. Any pointers in this publication to external Web sites are provided for convenience only and do not in any manner serve as an endorsement of these Web sites. Any performance data contained in this document was determined in a controlled environment, and therefore, the results that may be obtained in other operating environments may vary significantly. Users of this document should verify the applicable data for their specific environment.
Performance is based on measurements and projections using standard IBM benchmarks in a controlled environment. The actual throughput or performance that any user will experience will vary depending upon many factors, including considerations such as the amount of multi-programming in the user’s job stream, the I/O configuration, the storage configuration, and the workload processed. Therefore, no assurance can be given that an individual user will achieve results similar to those stated here.
This testing was done as a way to compare and characterize the differences in performance between different versions of the product. The results shown here should thus be looked at as a comparison of the contrasting performance between different versions, and not as an absolute benchmark of performance.
What our tests measure
We use predominantly automated tooling such as Rational Performance Tester (RPT) to simulate a workload normally generated by client software such as the Eclipse client or web browsers. All response times listed are those measured by our automated tooling and not a client.
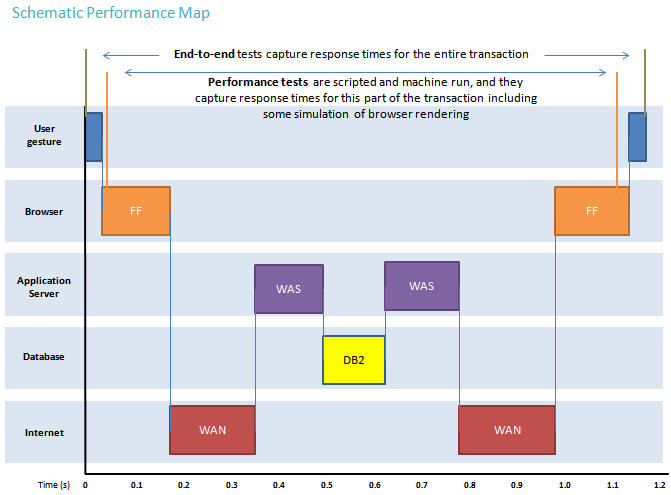
The diagram below describes at a very high level which aspects of the entire end-to-end experience (human end-user to server and back again) that our performance tests simulate. The tests described in this article simulate a large part of the end-to-end transaction as indicated. Performance tests include some simulation of browser rendering and network latency between the simulated browser client and the application server stack.
Findings
Performance goals
- Verify that there are no performance regressions between current release and prior release with 400 concurrent users using the workload described below.
- When comparing the three 5.0 runs with the three 4.0.6 runs the average of the three runs is used for comparison. Generally a 10% difference is accepted.
Findings
- Performance
- Several of the user actions, such as opening a project, have improved performance.
- There is a performance regression defect open that will negatively impact the time it will take to create reports.
- Impact by separating the RDNG repository from the JTS repository.
- This change has not negatively impacted performance.
- As expected this change has increased the workload for the RDNG application while it has lessened the workload for JTS.
- The impact can be seen in higher CPU and memory utilization by the RDNG server and a corresponding lesser utilization by JTS
- Note that it is now possible to have more than one RDNG server using the same JTS. This will allow scaling flexibility by adding additional RDNG servers.
- Other observations
- RDNG now maintains its own indices. Ensure that there is enough disk space to accommodate the indices on the RDNG server.
- In our test environment the RDNG indices created for a 240,000 artifact repository required 17.6 GB of disk space. Note that the new RDNG indices require more disk space than previously used by JTS 4.0.6 using the same data. In our test environment RDNG required 50% more disk space for indices.
- Putting the indices on a faster drive will improve performance.
- When upgrading from a previous version the JTS database will be cloned. This will require additional resources such as disk space and memory.
- Over time migrated data that is not required will be removed but initially the new RDNG database created will double the required disk space.
- Additional memory requirements by the database will depend on database vendor and configuration. It is strongly recommended to test thoroughly in a test environment before upgrading.
- RDNG now maintains its own indices. Ensure that there is enough disk space to accommodate the indices on the RDNG server.
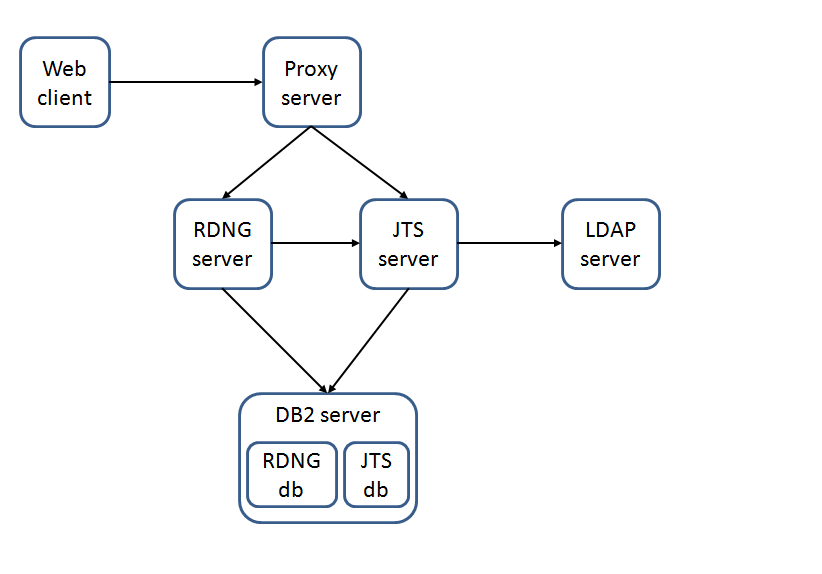
Topology
The topology under test is based on Standard Topology (E1) Enterprise - Distributed / Linux / DB2.
The specifications of machines under test are listed in the table below. Server tuning details listed in Appendix A
| Function | Number of Machines | Machine Type | CPU / Machine | Total # of CPU Cores/Machine | Memory/Machine | Disk | Disk capacity | Network interface | OS and Version |
|---|---|---|---|---|---|---|---|---|---|
| Proxy Server (IBM HTTP Server and WebSphere Plugin) | 1 | IBM System x3250 M4 | 1 x Intel Xeon E3-1240 3.4GHz (quad-core) | 8 | 16GB | RAID 1 -- SAS Disk x 2 | 279GB | Gigabit Ethernet | Red Hat Enterprise Linux Server release 6.3 (Santiago) |
| JTS Server | 1 | IBM System x3550 M4 | 2 x Intel Xeon E5-2640 2.5GHz (six-core) | 24 | 32GB | RAID 5 -- SAS Disk x 4 | 279GB | Gigabit Ethernet | Red Hat Enterprise Linux Server release 6.3 (Santiago) |
| RDNG Server | 1 | IBM System x3550 M4 | 2 x Intel Xeon E5-2640 2.5GHz (six-core) | 24 | 32GB | RAID 5 -- SAS Disk x 4 | 279GB | Gigabit Ethernet | Red Hat Enterprise Linux Server release 6.3 (Santiago) |
| Database Server | 1 | IBM System x3650 M4 | 2 x Intel Xeon E5-2640 2.5GHz (six-core) | 24 | 64GB | RAID 10 -- SAS Disk x 16 | 279GB | Gigabit Ethernet | Red Hat Enterprise Linux Server release 6.3 (Santiago) |
| RPT Workbench | 1 | VM image | 2 x Intel Xeon X7550 CPU (1-Core 2.0GHz 64-bit) | 2 | 6GB | SCSI | 80GB | Gigabit Ethernet | Microsoft Windows Server 2003 R2 Standard Edition SP2 |
| RPT Agent | 1 | xSeries 345 | 4 x Intel Xeon X3480 CPU (1-Core 3.20GHz 32-bit) | 4 | 3GB | SCSI | 70GB | Gigabit Ethernet | Microsoft Windows Server 2003 Enterprise Edition SP2 |
| RPT Agent | 1 | xSeries 345 | 4 x Intel Xeon X3480 CPU (1-Core 3.20GHz 32-bit) | 4 | 3GB | RAID 1 - SCSI Disk x 2 | 70GB | Gigabit Ethernet | Microsoft Windows Server 2003 Enterprise Edition SP2 |
| RPT Agent | 1 | Lenovo 9196A49 | 1 x Intel Xeon E6750 CPU (2-Core 2.66GHz 32-bit) | 2 | 2GB | SATA | 230GB | Gigabit Ethernet | Microsoft Windows Server 2003 Enterprise Edition SP2 |
| Network switches | N/A | Cisco 2960G-24TC-L | N/A | N/A | N/A | N/A | N/A | Gigabit Ethernet | 24 Ethernet 10/100/1000 ports |
Network connectivity
All server machines and test clients are located on the same subnet. The LAN has 1000 Mbps of maximum bandwidth and less than 0.3ms latency in ping.
Data volume and shape
The artifacts were distributed between 10 projects for a total of 240,659 artifacts.
The repository contained the following data:
- 219 modules
- 218,632 module artifacts
- 22,027 requirement artifacts
- 11,715 folders
- 150 collections
- 704 reviews
- 114,258 comments
- 3000 public tags
- 500 private tags
- 2,374 terms
- 75,941 links
- 2000 views
- 4.0.6
- Database size on disk = 20 GB
- JTS index size on disk = 11.5 GB
- 5.0
- JTS database size on disk = 20 GB (initial size before database cleanup has completed)
- RM database size on disk = 20 GB (initial size before database cleanup has completed)
- JTS index size on disk = 1.6 GB
- RM index size on disk = 17.3 GB
The large project contained the following data:
- 22 modules
- 1,170 folders
- 2,171 requirement artifacts
- 20,600 module artifacts
- 15 collections
- 62 reviews
- 11,350 comments
- 300 public tags
- 50 private tags
- 132 terms
- 7,676 links
Methodology
Rational Performance Tester was used to simulate the workload created using the web client. Each user completed a random use case from a set of available use cases. A Rational Performance Tester script is created for each use case. The scripts are organized by pages and each page represents a user action.
Based on real customer use, the test scenario provides a ratio of 70% reads and 30% writes. The users completed use cases at a rate of 30 pages per hour per user. Each performance test runs for 90 minutes after all of the users are activated in the system.
Test cases and workload characterization
| Use case | Description | % of Total Workload |
|---|---|---|
| Login | Connect to the server using server credentials. | None |
| Create a collection | Create collections with 10 artifacts. | 4 |
| Filter a query | Run a query that has100 results and open 3 levels of nested folders. | 3 |
| Open nested folders | Create review and complete review process. | 3 |
| Manage folders | Create a folder, move it to a new location, and then delete the folder. | 1 |
| Query by ID | Search for a specific ID in the repository. | 5.5 |
| View collections | View collections that contain 100 artifacts from the collections folders. | 10 |
| Check suspect links | Open an artifact that has suspect links. | 5 |
| Create a multi-value artifact | Create a multi-value artifact and then add a multi-value attribute. | 1.5 |
| Create an artifact | Create a requirement that contains a table, an image and rich text. Edit an artifact that has 100 enumerated attributes and modify an attribute. | 1.5 |
| Show artifacts in a Tree view | Open a folder that contains artifacts with links and show the data in a tree view. | 6 |
| Open graphical artifacts | Open business process diagrams, use cases, parts, images, sketches and story boards. | 4 |
| Create and edit a storyboard | Create and edit a storyboard. | 3.5 |
| Display the hover information for a collection | Open a collection that contains 100 artifacts and hover over the Artifacts page. | 1.5 |
| Query by String | Search for a string that returns 30 matched items. | 7.5 |
| Create a PDF report | Generate a 50-artifact PDF report. | 1.5 |
| Create a Microsoft Word report | Generate a 100-artifact Microsoft Word report. | 1.5 |
| Browse project folder | Open module folder and hover over large module | 2.5 |
| Open collection and display first page | Open filterable data collection page. | 1.5 |
| Create artifact in large module | Create an artifact from within a module. | 1.5 |
| Display module history | Open module and display history and audit history. | 1 |
| Create traceability report using 50 artifacts | Select 50 artifacts and generate report. | 1.5 |
| Open large module | Open a large module and jump to the bottom. | 7 |
| Scroll through a large module | Open a large module and scroll down to the bottom. | 7 |
| Swich between modules | First open medium sized module and then open a large module. | 6.5 |
| Edit a module artifact | Open a large module and inline edit a child artifact. | 4 |
| Save a module | Edit a module and save. | 1 |
| Create a large module report | Open a module and generate a report. | 1 |
| Upload 4MB file in new artifact | Upload 4MB file. | 3.5 |
| Switch view | Add columns and filters to view. | 1 |
| Hover over linked artifact | Open artifact with 50 links and hover over linked artifact. | 1 |
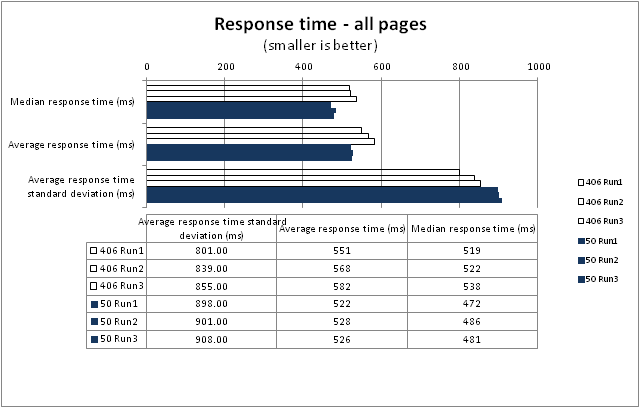
Response time comparison
The median response time provided more even results than the average response time. The nature of the high variance between tests where some tasks at time takes a longer time to run, such as when the server is under heavy load, makes the average response time less predictive. Both the median and average values are included in the following tables and charts for comparison.
In the repository that contained 240,000 artifacts with 400 concurrent users, no obvious regression was shown when comparing response times between runs.
The numbers in the following charts include all of the pages for all of the scripts that ran.
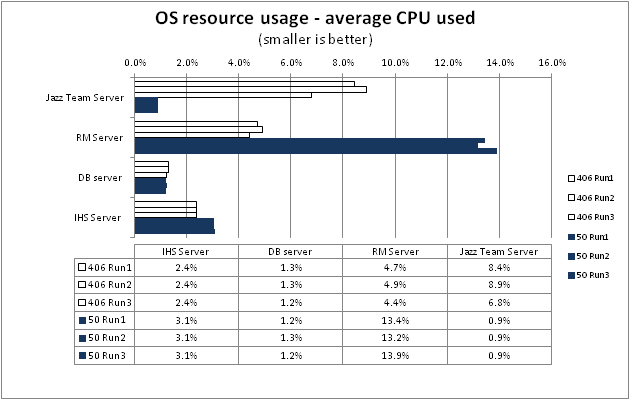
Results
Observation
- In 5.0 RDNG is utilizing its own repository instead of sharing it with JTS. Both memory and CPU utilization reflect the changed work distribution in 5.0 where RDNG is managing its own repository.
- Note that additional memory is used by the DB2 server due to the additional database required by RDNG 5.0.

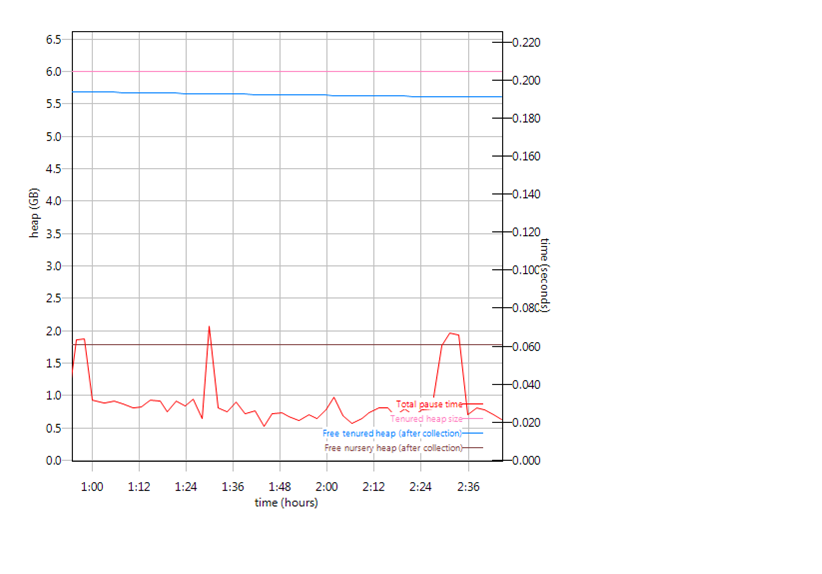
Garbage collection
Verbose garbage collection is enabled to create the GC logs. The GC logs show very little variation between runs. The difference between version 4.0.6 and 5.0 displayed by the GC logs reflect the additional work performed by RDNG 5.0 that was previously done by JTS . Below is an example of the output from the GC log for JTS and RDNG, including both versions 4.0.6 and 5.0 for each application server.
RM
- Observation: The graphs reflect the change in workload now when the RDNG application is performing all RDNG related tasks. In 4.0.6 queries and other database related interactions were done by JTS as the owner of the repository.
- RM 4.0.6

- RM 5.0

JTS
- Observation: The graphs reflect the change in workload now when the JTS application is not performing some of the RM related repository tasks. In RM 4.0.6 database related queries were done by JTS.
- JTS 4.0.6

- JTS 5.0
Create a collection
- Observation: All gestures, except open the project, show between 10 - 15% faster execution

Back to Test Cases & workload characterization
Filter a query
- Observation: Opening a project has a noticeable performance improvement as can be seen in several of the following graphs.
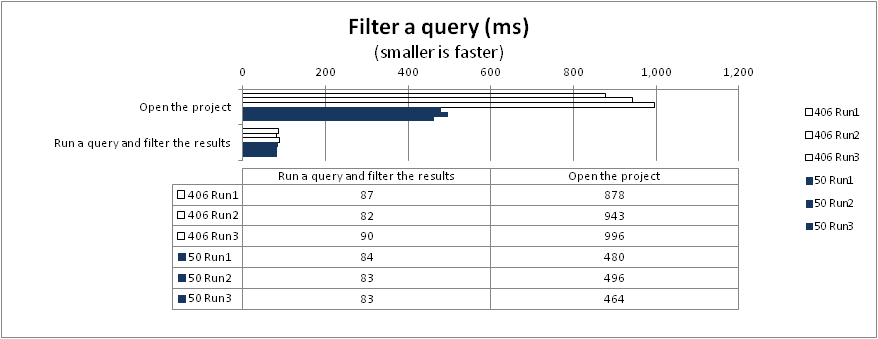
Back to Test Cases & workload characterization
Open nested folders

Back to Test Cases & workload characterization
Manage folders
- Observation: The create a folder gesture is on average 24% faster. More noticeable is the difference when moving a folder, a 35% improvement.

Back to Test Cases & workload characterization
Query by ID

Back to Test Cases & workload characterization
View collections

Back to Test Cases & workload characterization
Check suspect links

Back to Test Cases & workload characterization
Create a multi-value artifact

Back to Test Cases & workload characterization
Create an artifact
- Observation: Open the create artifact dialog box is 29% faster. Specify options for the new artifact is 22% faster. Open artifact improved with 13%.

Back to Test Cases & workload characterization
Show artifacts in a Tree view
- Observation: Open a folder that contains artifacts with links is 35% faster.

Back to Test Cases & workload characterization
Open graphical artifacts
- Observation: Open a sketch and open a use case are both in average 15% faster in 5.0.

Back to Test Cases & workload characterization
Create and edit a storyboard

Back to Test Cases & workload characterization
Display the hover information for a collection

Back to Test Cases & workload characterization
Query by string

Back to Test Cases & workload characterization
Create a PDF report
- Observation: The last step of creating a report is slower in 5.0. The root cause for this performance regression is still under investigation and a fix would be delivered to a future release (see work item (xxxxxx))

Back to Test Cases & workload characterization
Create a Microsoft Word report
- Observation: The last step of creating a report is slower in 5.0. The root cause for this performance regression is still under investigation and a fix would be delivered to a future release (see work item (xxxxxx))

Back to Test Cases & workload characterization
Browse project folder

Back to Test Cases & workload characterization
Open collection and display first page

Back to Test Cases & workload characterization
Create artifact in large module

Back to Test Cases & workload characterization
Display module history

Back to Test Cases & workload characterization
Create traceability report using 50 artifact
- Observation: The last step of creating a report is slower in 5.0. The root cause for this performance regression is still under investigation and a fix would be delivered to a future release (see work item (xxxxxx))
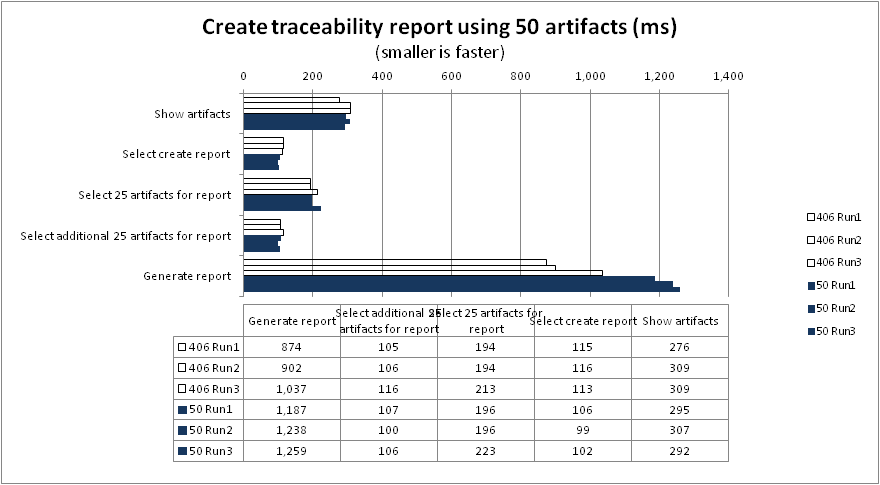
Back to Test Cases & workload characterization
Open large module
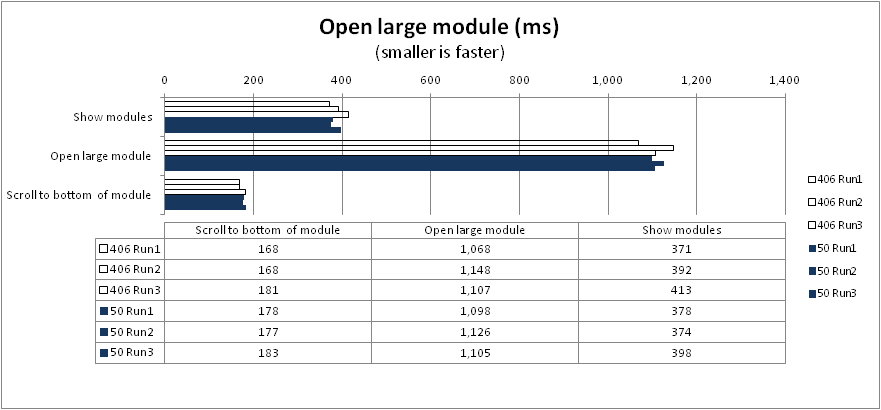
Back to Test Cases & workload characterization
Scroll through a large module

Back to Test Cases & workload characterization
Switch between modules

Back to Test Cases & workload characterization
Edit a module artifact

Back to Test Cases & workload characterization
Save a module

Back to Test Cases & workload characterization
Create a large module report

Back to Test Cases & workload characterization
Uploading 4 MB file in new artifact

Back to Test Cases & workload characterization
Switch view

Back to Test Cases & workload characterization
Hover over linked artifact

Back to Test Cases & workload characterization
Appendix A
| Product |
Version | Highlights for configurations under test |
|---|---|---|
| IBM HTTP Server for WebSphere Application Server | 8.5.5.1 | IBM HTTP Server functions as a reverse proxy server implemented
via Web server plug-in for WebSphere Application Server. Configuration details can be found from the CLM infocenter.
HTTP server (httpd.conf):
Web server plugin-in (plugin-cfg.xml):
OS Configuration:
|
| IBM WebSphere Application Server Network Deployment | 8.5.5.1 | JVM settings:
-XX:MaxDirectMemorySize=2g -Xgcpolicy:gencon -Xmx8g -Xms8g -Xmn2g -Xcompressedrefs -Xgc:preferredHeapBase=0x100000000 -Xverbosegclog:logs/gc.log Thread pools:
OS Configuration: System wide resources for the app server process owner:
|
| DB2 | DB2 10.1 | |
| LDAP server | ||
| License server | Hosted locally by JTS server | |
| RPT workbench | 8.3 | Defaults |
| RPT agents | 8.5.1 | Defaults |
| Network | Shared subnet within test lab |
For more information
About the authors
Questions and comments:
- What other performance information would you like to see here?
- Do you have performance scenarios to share?
- Do you have scenarios that are not addressed in documentation?
- Where are you having problems in performance?
Warning: Can't find topic Deployment.PerformanceDatasheetReaderComments
- All_pages_sorted_by_DNG_scripts_Chart_19.png:
-
 Deployment web
-
 Planning and design
- Installing and upgrading
- Migrating and evolving
- Integrating
- Administering
- Monitoring
- Troubleshooting
Status icon key:
-
 To do
To do
-
 Under construction
- New
-
 Updated
-
 Constant change
- None - stable page
- Smaller versions of status icons for inline text:
-


Contributions are governed by our Terms of Use. Please read the following disclaimer.
Dashboards and work items are no longer publicly available, so some links may be invalid. We now provide similar information through other means. Learn more here.