Case study: Comparing RTC 3.0.1.3 and 4.0.3 plan loading performance
Authors: GrantCovell, ChetnaWarade, MichaelFiedlerLast updated: July 11, 2013
Build basis: Rational Team Concert 3.0.1.3, 4.x
Planning is one of the most powerful and frequently used features of Rational Team Concert. Our clients are able to dynamically view and manage plans from very tiny team plans to multi-year large plans with thousands of items and complex team/owner/plan item relationships. With larger, more complex plans, some clients note sub-optimal performance of plan loading, have sought techniques to optimize their plan usage and have asked IBM to improve plan load response times. For the Rational Team Concert 4.x releases, the development team made significant improvements to plan loading behavior.
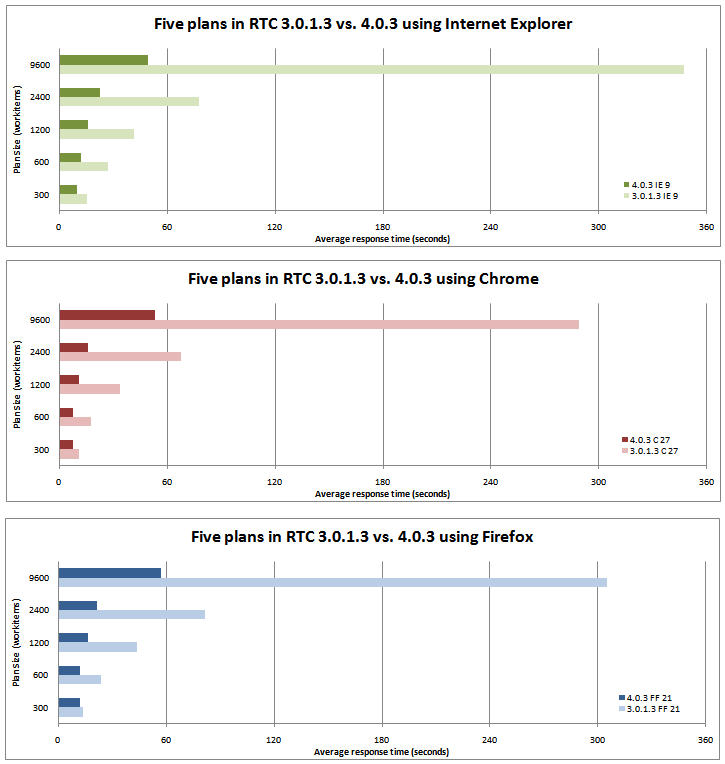
This case study compared identically structured plans of varying sizes with the goal of determining the difference in plan load time between Rational Team Concert 3.0.1.3 and 4.0.3. Using the 3.0.1.3 release the larger plans took more than a minute to load while in 4.0.3 all plans, regardless of size or browser used, took less than a minute to load. In this study plans of all sizes loaded faster in 4.0.3 than in 3.0.1.3. Notably, plans with larger numbers of work items loaded proportionally faster in 4.0.3.
NOTE: We delivered substantial changes to plan loading in 4.0.3. Several customers identified a prevalent use case / datashape which prevented the plan-loading improvements from being realized. For some 4.0.3 customers, there was a functional defect which prevented them from using plans; for other 4.0.3 customers, if they had timelines with data and workitems that weren't relevant to the current iteration, then they were retrieving extra data and didn't see plan-loading improvements. These defects were fixed in hot fixes for 4.0.3, and were resolved in 4.0.4 and 4.0.5. All customers using 4.0.5 or greater should see the plan-loading improvements.
Disclaimer
The information in this document is distributed AS IS. The use of this information or the implementation of any of these techniques is a customer responsibility and depends on the customer’s ability to evaluate and integrate them into the customer’s operational environment. While each item may have been reviewed by IBM for accuracy in a specific situation, there is no guarantee that the same or similar results will be obtained elsewhere. Customers attempting to adapt these techniques to their own environments do so at their own risk. Any pointers in this publication to external Web sites are provided for convenience only and do not in any manner serve as an endorsement of these Web sites. Any performance data contained in this document was determined in a controlled environment, and therefore, the results that may be obtained in other operating environments may vary significantly. Users of this document should verify the applicable data for their specific environment.
Performance is based on measurements and projections using standard IBM benchmarks in a controlled environment. The actual throughput or performance that any user will experience will vary depending upon many factors, including considerations such as the amount of multi-programming in the user’s job stream, the I/O configuration, the storage configuration, and the workload processed. Therefore, no assurance can be given that an individual user will achieve results similar to those stated here.
This testing was done as a way to compare and characterize the differences in performance between different versions of the product. The results shown here should thus be looked at as a comparison of the contrasting performance between different versions, and not as an absolute benchmark of performance.
Summary
Plan loading in Rational Team Concert 4.0.3 has improved markedly over version 3.0.1.3. Changes were made in the 4.0 release and the 4.0.1 release, but the most substantive changes were made in the 4.0.3 release. For simplicity we are comparing the 3.0.1.3 and 4.0.3 releases only.
The degree of improvement will vary from environment to environment, and is influenced by many factors including hardware, operating system, database, network latency, datashape, workload, workload rate and number of concurrent users using the application. In our tests with plans of varying work items, we observed that the greatest improvement in plan loading times is for those plans with many work items.
Topology
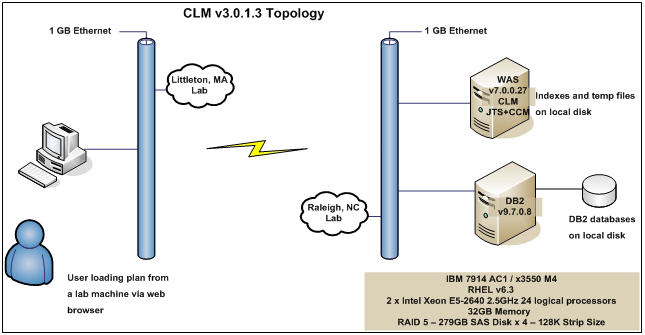
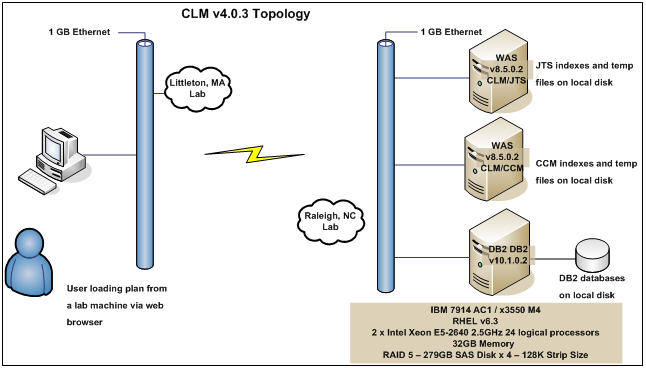
Two separate physical configurations were built to evaluate plan performance. No part of the two server configurations use virtualization. Both the RTC 3.0.1.3 and 4.0.3 environments are running on RHEL 6.3 on IBM 7914 AC1 / x3550 M4 servers at 2.5 GHz with 32 GB RAM and 24 logical processors (each physical machine has two sockets, six cores-per-socket, and two threads-per-core which in total appear as 24 logical processors).
In the 3.0.1.3 environment the application server is WebSphere 7.0.0.27, and in the 4.0.3 environment the application server is WebSphere 8.5.0.2. The database in the 3.0.1.3 environment is DB2 9.7.0.8, and in the 4.0.3 environment the database is DB2 10.1.0.2. In the 3.0.1.3 environment the JTS and CCM servers are co-located on the same server, and in the 4.0.3 environment the JTS and CCM servers are on separate servers. The max heap setting (-Xms) for the JTS and CCM JVMs is set to 6144 MB.
The plans are accessed using Internet browser applications from a client machine located in a separate lab (the client is located in Littleton, Massachusetts, and the servers are located in Raleigh, North Carolina). The average ping time between the clients and servers is 88 ms (in a multi-instance ping sample, the min ping was 48 ms and the max was 173 ms). This multi-state latency is typical of many WAN installations.
User authentication is managed by IBM Tivoli Directory server on AIX platform. Network latency between LDAP authentication server and CLM application server is less than one second. The web server is IBM HTTP Server 8.5.
These topologies are derived from the E1 Topology documented at Standard Topology (E1) Enterprise - Distributed / Linux / DB2.
Methodology
Using automation we developed five plans of different sizes, characterized as plans with 300, 600, 1200, 2400 and 9600 work items. Specific plan characteristics are indicated in the table below.

The five plans were accessed from a machine running Windows 2008 using three different browsers, Firefox (version 21), Chrome (version 27.0.1453.110) and Internet Explorer (version 9.0.8112.16421). Response times were measured using built-in web performance tools such as HttpWatch and Chrome's Developer Tools, as well as stopwatches. Eight samples were taken for each combination of plan, browser and RTC version, and the averages and standard deviations calculated.
Note that for the 9600-work-item plan in 3.0.1.3 for all three browsers that response times were rounded to the nearest second, and that to accomodate the Chrome Developer Tool's behavior of expressing times greater than 60 seconds as fractional minutes (eg. 1.1 minutes instead of 63.56 seconds) a combination of stopwatch and page additions were used to calculate times in Chrome for the 2400- and 9600-work-item plans.
The plans were accessed manually as a single user against a server with no other load. Admittedly these are ideal times given there is no server load, but the purpose of these tests was to isolate and document 4.0.3 plan loading improvements. We also did not track client or server CPU activity. We expect that plan performance in an enviroment with active server load could be less dramatic depending upon server hardware, network latency, database, and the number of concurrent users and their workload and workload rate.
Results
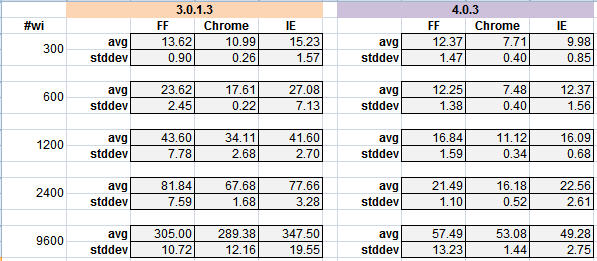
This data table shows response time results comparing 3.0.1.3 and 4.0.3 using three browsers to access the five plans. Overall, 4.0.3 performance is better with generally lower ranges of response times (standard deviation). Note that in 4.0.3, all plans return in less than one minute where as in 3.0.1.3 the 2400- and 9600-work-item plans returned in more than a minute.
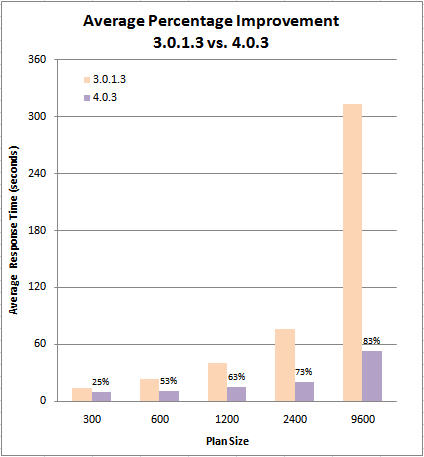
This bar graph averages the response times across the three browsers to show the relative performance improvements. Note that 4.0.3 response times improve as the size of the plans grows.
These graphs show the same data in the data table above, but grouped by browser.
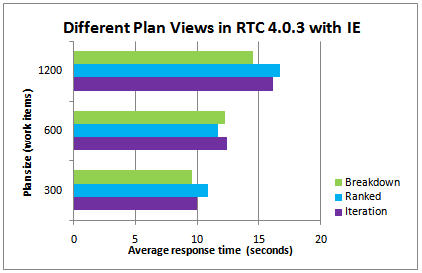
For the tests above, we used one type of plan view, the Iteration view. We also explored different views of a subset of plans. The default view is Iteration, but Ranked and Breakdown can be configurable defaults. For this exploration we stayed with Internet Explorer and RTC version 4.0.3 and looked at just the 300-, 600-, and 1200-work-item plan sizes.
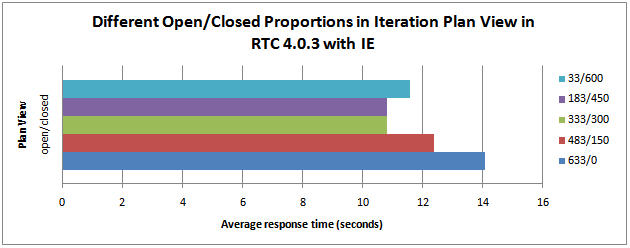
For all the tests above each plan had a constant ratio of open and closed work items. We took one plan size and explored different ratios of open and closed workitems to see if that made a significant difference.
For more information
- Jazz.net article: Getting Started with Planning in Rational Team Concert 4.0
- Jazz.net article: Effective Planning with Rational Team Concert 3.0
- Jazz.net article: Traditional planning: Managing formal projects in Rational Team Concert 4.0
- IBM technote: How to Improve Performance while loading large plans in the Web UI
- Jazz.net wiki article: Plan performance improvements in Rational Team Concert, Version 4.0.3
- Jazz.net Deployment wiki article: Why does my RTC plan take so long to load?
About the authors
GrantCovell has been working for IBM Rational software on performance-related things for nearly 10 years. He's now the Senior Performance Obsessor on the Jazz Jumpstart team. Before that, he managed the Rational Performance Engineering team. You can follow his Jumpstart team blog, called Ratl Perf Land.
ChetnaWarade is has been a Software Engineer at IBM for over 9 years. She is part of the Rational Performance Engineering group.
MichaelFiedler is the team lead for Rational Team Concert's planning component. He has also been actively involved in Eclipse Lyo and OSLC.
-
 Deployment web
-
 Planning and design
-
 Installing and upgrading
-
 Migrating and evolving
-
 Integrating
-
 Administering
-
 Monitoring
-
 Troubleshooting
Status icon key:
-
 To do
To do
-
 Under construction
-
 New
New
-
 Updated
-
 Constant change
- None - stable page
- Smaller versions of status icons for inline text:
-


Contributions are governed by our Terms of Use. Please read the following disclaimer.
Dashboards and work items are no longer publicly available, so some links may be invalid. We now provide similar information through other means. Learn more here.