Jenkins build stays on "pending"
we are facing the problem that our jenkins jobs stay only in state "pending".
We can start the jobs from jenkins and see the correct status in RTC when using the jenkins plugin.
But when we start the build job from RTC than it seems that no request left the RTC server - or arrives the build server...
In the logfiles nothing is written. I have put the log for log4j.category.com.ibm.rational.connector.hudson to TRACE but the only info I see in the logs are connection infos for when running "test connection".
It seems for me that the requested build comes not to the build engine as there is nothing within the build activity of the build engine.
Any idea?
Greetings,
Simon
7 answers
It happened immediately after I setup the new Build Definition.
However, when I restarted Jenkins and requested a new build, the operation was successful.
Within Jenkins UI, I did Jenkins->Manage Jenkins->"Reload Configuration from Disk"
The original 'pending' build did not succeed, but the builds requested after the Jenkins refresh worked fine.
Comments
hi John,
thanks for your answer - I checked it but unfortunately it did not work for us :(
Any other ideas?
Hi Simon,
Is it possible that the build is setup to require a parameter in Jenkins?
Regards,
John
As of 4.0.3 it is required for the Jenkins jobs to have parameters. We now use the Jenkins parameters to track which Jenkins job is linked to which RTC build result.
It may also help to click on the refresh icon to the right of the Builds tab in RTC Eclipse Client - that will update the 'Progress' and 'Estimated Completion' columns with the latest status from Jenkins.
I was thinking of additional custom parameters as configured in Jenkins. For example, if I require a new string parameter 'test' but don't supply that parameter within the Build Definition Properties tab, or within the 'Build Properties' section of the Request Build dialog, then the build remains 'pending' until I supply the value and refresh.
Hi John, Hi Spencer,
refreshing changes nothing. The build queue stays in pending and the build activity on the build engine stays empty. The "Show Builds for engine" stays empty, too. I have no manually defined properties inside my build.
When taking a look at the build engine sometimes I have a warning that this engine seems to be not running ... but this warning I have seen on working builds, too.
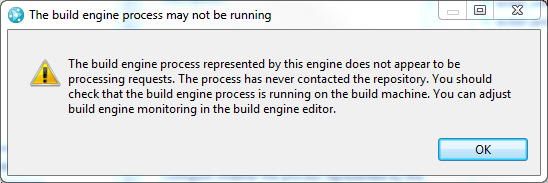
build definition properties:
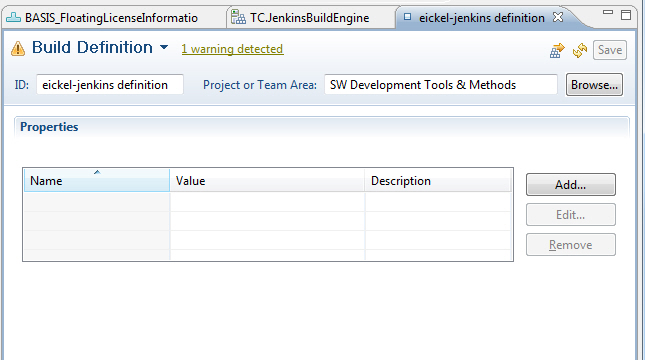
build queue:

build activity (build engine):

Hi Simon,
I think that warning might be important. If you open up the Build Engine, does it have the 'Build engine process polls for requests' toggle checked on?
Do you see the same behaviour if you create a new Build Engine using all default values?
John
Hi John,
yes, this option is enabled:
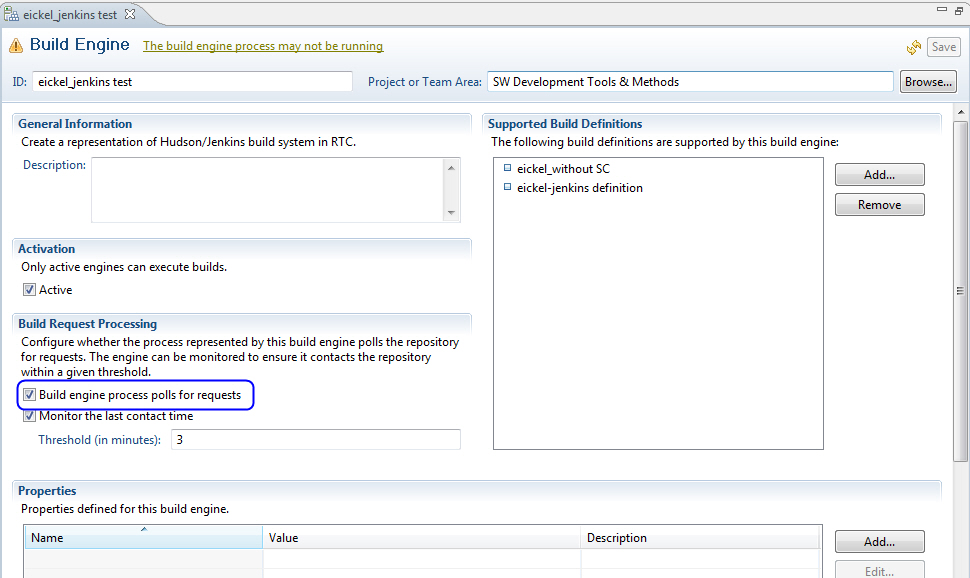
The warning is gone when creating a build engine and not to connect it to a build definition. As soon as I connect it the warning appears.
when creating a request using the predefined properties (e.g. take the build engine supported with) he tells me the following:

Hi Simon,
That particular message was reported before on a different OS (https://jazz.net/forum/questions/33874/build-enginee-process-is-not-running) and it was related to restrictive permissions on the run area. I am not sure if it's applicable to your case - but perhaps running the build engine as an Administrator may workaround such a problem.
Similarly, making sure that all the services are running with the same JRE as the JTS may help.
John
Hi John,
as the build were running on friday fine and just since monday they didn't work anymore I doubt that this is a permissions problem within the team area.
But thanks for this tipp :)
- do the RTC builds stay in pending, or are they showing as in-progress (but not actually making progress)?
- in the build engine config, ensure the Jenkins URL has a trailing slash (known regression in 4.0.3)
- do you have security enabled, i.e. are you using user id/password to login? If so ensure permissions are granted to be able to read/write the relevant job, their configs, and their builds (job config case is a known regression in 4.0.3, but you wouldn't have gotten log message above if it couldn't update the job).
- if the buildResultUUID parameter was not in fact added automatically, add it manually to the Jenkins job (its name is case sensitive; default value should be blank)
- check for any errors in the RTC build result's logs
- check for any other errors in the RTC server log
- check CCM admin web UI status page for any errors indicating if any services have stopped due to errors
Comments
Hi Nick
1) it stays in pending - nothing happens anymore no further progress
2) trailing slash is there but changes nothing
3) security is enabled and checked - everythings fine with
4) buildRequestUUID prop is set manually within build definition - value is empty - but changes nothing
5) there are no build results log's as the job does neither start nor finish
6) there are errors/warnings in the log files but for really other times and as I can say they do not belong to this problem:
ERROR .service.internal.save.notify.ChangeEventGenerator - CRRTC0255E: An error occurred while registering the approval request on a work item. The approval was saved, but a notification will not be sent to approvers.
All the warnings are warnings belonging to work items
7) no errors appears within CCM admin web UI
This is a very hard problem as no personal builds are running when created as Jenkins builds ...
thanks for all your ideas.
Since today the Jenkins builds are running fine again.
What did I do? - Nothing
Every week on Monday morning (1 AM) our productive server gets restarted.
Both the database server and the application server. I did a restart of the application server last week but this didn't resolve this issue.
The restart of both - database and application server seemed to get it working again.
Any idea what the issue could be?
Maybe a inconsistent entry in the db which got slapped by rebooting?
Greetings,
Simon
Since monday all our Builds stays on pending when starting them from the RTC client.
When starting using the Jenkins dashboard everything is fine.
When throwing an eye on the "active services" of ccm I noticed that the task "com.ibm.rational.hudson.team.internal.service.HudsonSyncLoopScheduledTask.executeTask" is open twice.

A restart of both servers (DB and Application) did not help this time.
Any more ideas would be great :)
Comments
The two tasks shown are actually different. The BuildLoop one checks for new builds in RTC and sends them to Hudson/Jenkins. The SyncLoop one monitors the status for existing builds, updating them with the latest info from Hudson/Jenkins.
Can you also check the RTC server log? Probably called ccm.log or jazz.log under tomcat/server/logs (if using Tomcat).
Hi Nick,
thanks for clarification. Yes, Right after posting I noticed that those tasks are different. But when checking our "quality assurance" server I noticed that there is just the HudsonSyncLoopScheduledTask and on this server everything is working fine. But on both server those tasks seems to get started when the server starts up and running from then on. So I don't think they are stuck.
Here is the stack for the HudsonSyncLoopScheduledTask:
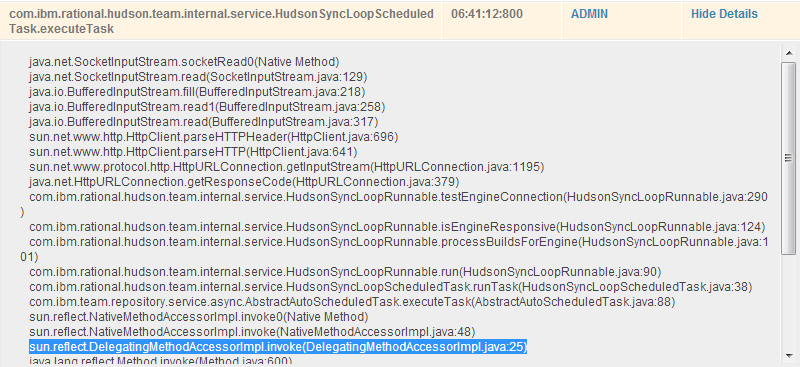

Here is the stack for the HudsonBuildLoopScheduledTask:
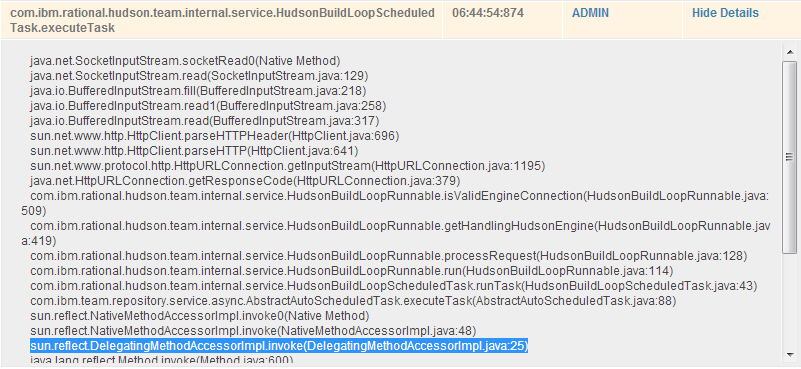

I restarted the server again tonight to have a clean overview of the logs and as expected there are not many entries inside.
Those are the only hudson entries:

I set my log4j that all hudson entried will be logged into an own file.
If the tasks show as being running for any length of time greater than a few minutes, then they're definitely stuck. They normally run once every 15 seconds, as a separate invocation each time. Can you please check whether there are any Hudson/Jenkins type build engines defined whose URL may refer to an unresponsive server? Test Connection should indicate this, but you could also try the URL in a browser.
Hi Nick,
thanks for that information.
You're right this task should run every 15 second. But why does everything work on our qual server even when this task seems to be stuck?
At the moment everything is working again on the prod system - but we did nothing.
Noting you're tip it could mean, that if someone is using a build engine definition whose URL may refer to an unresponsive server this could use our system to crash ...
Have to check this and will come back with my results ... maybe again in 3 months :D
not really a good part.
We are having the same problem and it was working fine up until about the time the "com.ibm.rational.hudson.team.internal.service.HudsonBuildLoopScheduledTask.executeTask" service started (it's been running for over 3 hours). Now our builds can not be started from RTC (they stay in pending state). Starting the job from the jenkins side works fine and results are visible in RTC.
I've followed all advise given in this thread without luck. Short of restarting the RTC server, is there anything else we can do? Good opportunity to debug this if development is up for it.
Hi Erik,
one suggestion is to check all your existing build engine (use administrative account for it to see all).
Is there one which could stuck? E.g. One definition with two build engines where one engine uses a Jenkins server on which the Jenkins job is not established?
We tried that (removed all engines and definitions) but the BuildLoop ("com.ibm.rational.hudson.team.internal.service.HudsonBuildLoopScheduledTask.executeTask" )service remains wedged and we are not able to start jobs from RTC.
The SyncLoop is working fine as I can start jobs in jenkins and see the results in RTC.
Restarting the server fixed our problem (starting jobs in RTC kicks off the jenkins job)
Hi Erik,
yes, that's the behavior we had, too. But unfortunately the last time a restart did not fix the problem (restarted both - db server and application server more than one time). :(
I noticed this defect in the recent Jenkins distributions: https://issues.jenkins-ci.org/browse/JENKINS-12994
If you're using 'Quiet period' in the Advanced Project Options of the build configuration in Jenkins, it might be worthwhile unchecking that toggle in case it is causing a problem.
I hope that helps,
John
Comments
Spencer Murata
FORUM MODERATOR / JAZZ DEVELOPER Jul 16 '13, 9:30 a.m.Can you try putting the log4j to ALL? You should see more than the test connection information. If the logging is done correctly you should see a continuous stream of logging as the loops look for updates and builds to run.
Simon Eickel
Jul 17 '13, 1:47 a.m.Hi Spencer,
logging is now "log4j.category.com.ibm.rational.connector.hudson=ALL, hudson" but at the moment nothing new in the logfile ... will investigate if there are some more entries after some time...
Simon Eickel
Jul 17 '13, 7:05 a.m.one entry is noticeable I think:
2013-07-17 12:03:32,400 [WebContainer : 8 @@ 12:03 <username> /ccm/service/com.ibm.rational.connector.hudson.internal.common.IHudsonService] WARN com.ibm.rational.connector.hudson - The Hudson/Jenkins job <jobname> was not parameterized with the RTC build parameter "buildResultUUID". Added the parameter to the given job.
But I think as this is only a warning it's no problem.