How to group the chart column in RRDI List Report?
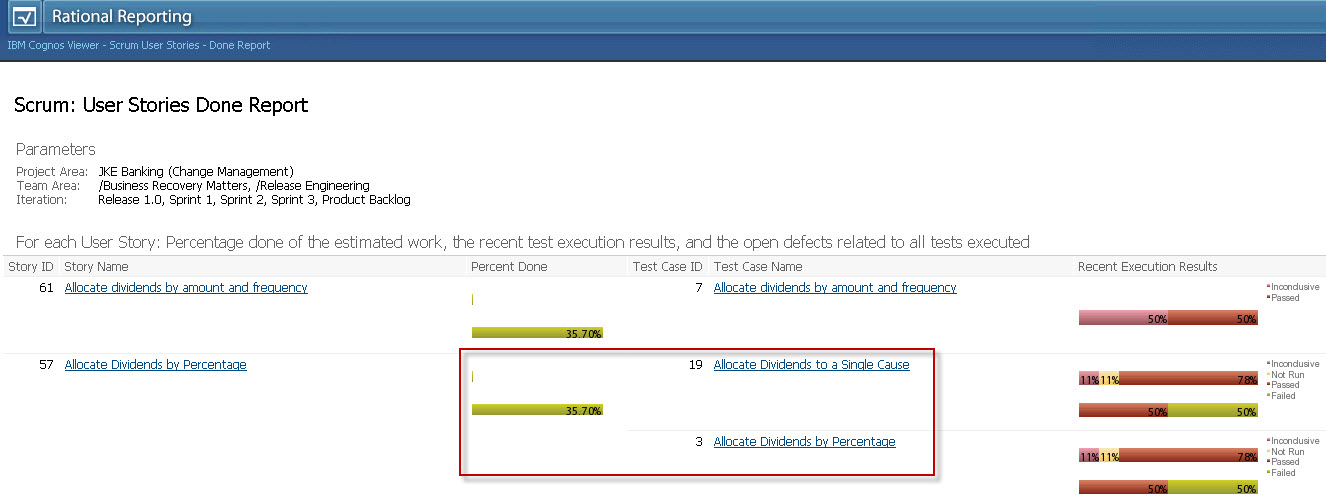
I want to create a report similar with User Story Done Report for CCM. It is group the story ID and story name column, and the third chart column is also grouped.


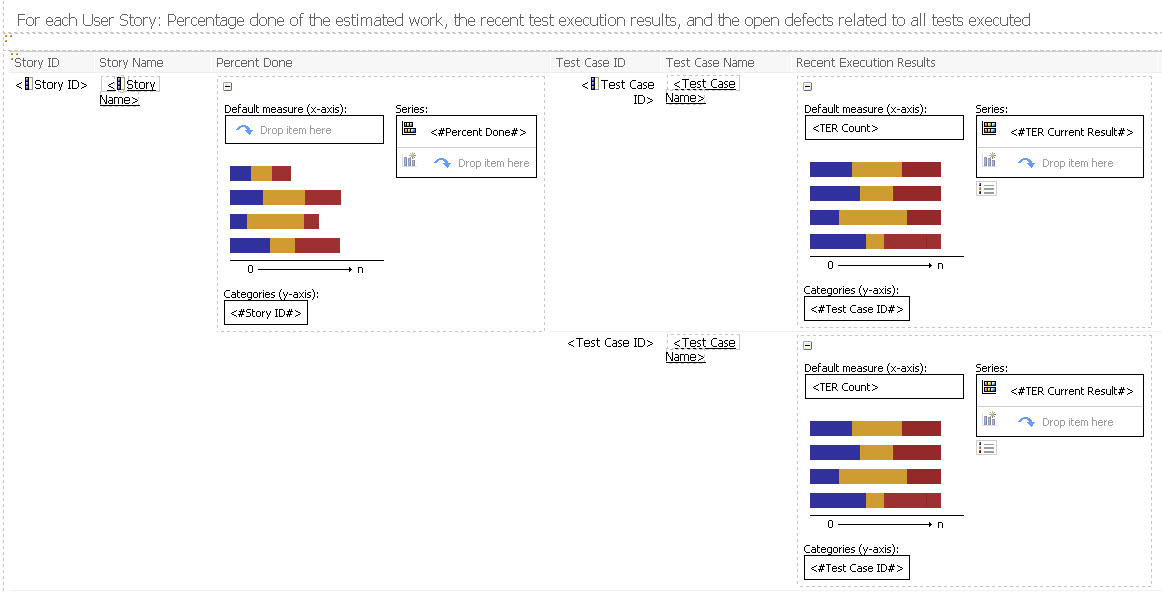
This is the User Story Done Report screen shot and its report studio file:


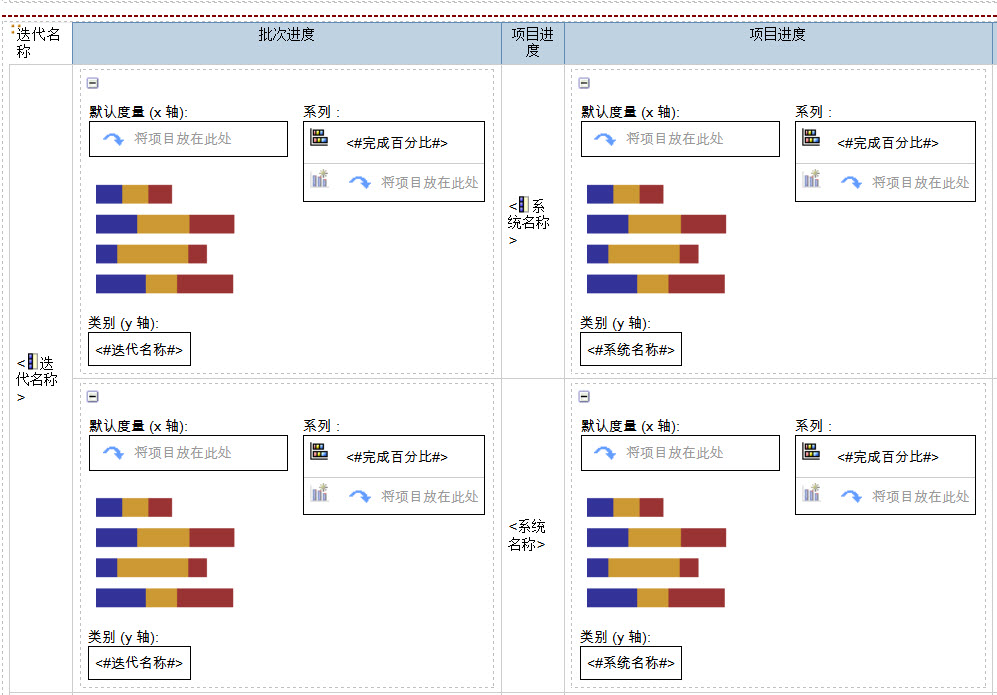
But when I create my own report like the above format, the chart column can not shown as grouped. Anyone can help that? How to config the chart column looks grouped? Thanks!
This is my report in studio, you can ignore the Chinese. I grouped the first column, but the second column I called the chart column can not be grouped.