This article is meant to help you troubleshoot problems in virtualized environments. Because virtualization can be complicated, the first section proposes some preliminary questions, and how to analyze possible problems in virtualized environments.
The second section shares several real-life situations which were analyzed and resolved.
The third section offers one vendors control panels (VMware ESX server) to illustrate some of the virtualization capabilities and settings discussed in
Principles of good virtualization and in a two-part series of articles
here (part 1), and
here (part 2) about best practices using virtualization with IBM Rational software.
| This article discusses basic virtualization concepts, but is not a comprehensive in-depth document. Involve your virtualization administrator in any virtualization troubleshooting. |
Initial assessment
Many IBM Rational Collaborative Lifecycle Management (CLM) deployments use virtualization. Virtualization can be used well and it can be used badly. Badly virtualized environments can be slow performing and unreliable.
The symptoms of a poorly managed virtualized environment can often be confused with a poorly designed environment, especially when the virtualized images compose such an essential part of the entire environment. The symptoms of a poorly behaving application server can include poor end-user performance, but a poorly virtualized server can also create bottlenecks, which can slow other environment components.
If you suspect a particular server (license, application, Jazz Team Server, etc.) might be a bottleneck, consider not just the application that runs on it, but also the server itself. If the server is virtualized, investigate the VM configuration to rule out some basic VM settings.
Poorly managed virtualized environments may sometimes have wildly variable performance regardless of end-user load. They also might appear to reach maximum capacity rather quickly, or slow down at inconsistent or random times.
Preliminary questions
The first step to troubleshooting problems is to understand your organizations virtualization strategy and the specifics of the virtualized environment which hosts IBM Rational software. Here follow some preliminary questions.
|
Question
|
Why we ask this
|
What sort of answers are we looking for
|
|
Are you using virtualization?
|
Over the past several years an evolving trend has been
that application administrators no longer own their infrastructure. We have
worked with customers who were diagnosing performance problems and they did
not realize that their servers had been virtualized.
|
Yes, virtualization is being used. This may seem like a
completely obvious question, but it is important to be sure before beginning
any troubleshooting.
|
|
How is your virtualized environment managed? Who owns the
environment?
|
Is there a responsible organization or individual tasked
with maintaining and monitoring the virtualized infrastructure?
|
Yes, there is a dedicated team responsible for maintaining
and monitoring virtualized infrastructure. This dedicated team proactively
monitors hypervisors and keeps an eye on resource consumption. If clustered
servers are in use, this team has triggers and reports that flag when unusual
patterns appear.
|
|
Has the VM configuration been defined in line with IBM Rationals
recommendations?
|
Have the product administrators or the VM administrators
asked IBM Rational for help or looked at our virtualization recommendations?
|
Ideally, product administrators and VM administrators
would work together to understand and configure the VMs according to our
recommendations, and understand the performance tradeoffs if our
recommendations arent followed.
|
|
Does the VM have dedicated resources?
|
Complex multi-tier applications such as the Rational CLM
products or Rational ClearCase require near constant access to dedicated
resources. It is our recommendation that the VM hosting the Rational product
have dedicated resources for CPU, memory and network.
|
Yes, resources are dedicated. Note that in some cases
where the hypervisor may be part of a cluster, pinning resources might
prevent the entire clan of VMs from performing optimally. There can be
performance tradeoffs for all VMs when CPU and memory resources cant be
dedicated or reserved.
|
|
Is the VM part of an automatically load-balanced cluster
such as VMwares vMotion?
|
When a VM is part of a cluster, resources cant be
dedicated or pinned. The hypervisor manages the resources based on the needs
for the specific VMs as well as the other VMs in the cluster.
|
Yes or No. If the VM is part of a cluster, resource
management is given to the hypervisor. If the VM is not part of a cluster,
then resources can be dedicated.
|
|
Do you permit overcommiting resources?
|
It is possible for the cumulative resource needs of
several VMs hosted by the same hypervisor to exceed the available physical
limits of CPU and memory. Depending upon how the VM infrastructure is
managed, this may be OK. In some cases, the theoretical hardware cost savings
outweighs the need to manage resources and performance may suffer.
|
Some organizations actively prevent this. Some
organizations have a target ratio, for example 2:1 where they will attempt to
host VMs whose combined CPU needs exceed physical CPU capacity by twice the
amount.
There are tradeoffs with either approach. Hardware costs
need to be balanced against server performance.
|
Possible symptoms
Virtualization problems do not always have obvious symptoms, or might have symptoms that suggest poorly behaving applications. Here are some possible symptoms:
- Multi-user performance slows down inconsistently or stops without any apparent pattern (inconsistent behavior)
- Server CPU utilization increases dramatically or remains at maximum for long periods (unexpected load)
- Unexpectedly high I/O activity (disk swapping, slow performance)
Usually investigating whether resources are dedicated and whether there is overcommitment in the VM environment is the first and most significant step to diagnosing and solving problems in virtualized environments.
Possible solutions
- Ensure that CPU and memory have access to dedicated resources. If your server appears to be four logical processors and 8 GB RAM, are those resources dedicated exclusively to that server?
- Additionally, ensure that CPU and memory resources have reservations, meaning if they are to have access to four logical processors and 8 GB RAM, do they have those resources when they start, or do they only get access to them when demand is at its peak
- Avoid overcommitment: Do not assume that the same principles that work well with physical hardware will also work within a VM environment. If the VM environment has access to extra CPU and memory, then the hypervisor might provide it to the VM in need without effecting other VMs. If the hypervisor is already at maximum capacity, then the hypervisor might write other images to disc to free up the desired resources.
Real-life situations seen in the wild: Troubleshooting poor VM performance
Situation No. 1: Poor performance because many VMs share one network connection
|
Troubleshooting Situation 1 |
|
What we heard
|
Consistently poor performance; general suspicion that performance ought to be better.
|
|
Initial suspicions
|
CPU and memory resources are not dedicated
|
|
Investigation steps
|
- Confirm VM requirements (how much CPU, RAM, network capacity, etc.)
- Ask to see hypervisor console
- Validate dedicated resources
|
| What we discovered | VMs were sharing a single network interface |
| Further analysis | In one of our tests, four VMs each with dedicated resources allocated for CPU and memory were found to be performing poorly. It was discovered that the four VMs were sharing a single 1 Gigibit network connection. Three of the VMs were ClearCase VOB servers and the fourth was a ClearCase view server (each VM had 4 vCPUs and 8 GB RAM).
Once the four images were reconfigured so that each had a dedicated 1 Gbit network connection (the hypervisor had four 1 Gbit NICs) we saw a 40% improvement for base ClearCase operations, 27% faster UCM operations and 22% faster build operations.
We recommend understanding your applications network needs and dividing up NICs appropriately. It may be a good idea for VMs which require ample access to a database to have a dedicated NIC, whereas other VMs whose traffic is predominantly across the same hypervisor may be able to share NICs.
|
|
Keep in mind
|
Poor performance in a VM could be attributable to any number of reasons. Generally, its important to validate the VMs requirements (vCPUs, RAM, et al.) and see what the actual settings and usage under load are like. If performance is poor, then there might be a bottleneck somewhere in the VM or the on the hypervisor hosting the VM.
If the running processes are consuming near 100% RAM then the image may be undersized and need more RAM. If the CPUs are consuming near 100% of their cycles, then the VM may simply need access to more cores. If CPU and RAM are low, but there are many packets in the queue, then perhaps the network is unavailable and bandwidth needs to be increased.
If the VM is not at capacity, but the hypervisor is running at high CPU%, then it is possible that the hypervisor is overcommitted and resources are being continually swapped and the VM alternately written to and read from disc to support the overcommitted hypervisor.
In this particular example, many VMs were sharing a single network card whose capacity was evenly distributed over several VMs. Poor performance of software hosted on VMs can be attributable to many different causes. Its best to analyze poorly performing product behavior on VMs with the VM administrators and Rational product support.
|
Situation No. 2: Fuzzy math
|
Troubleshooting Situation 2 |
|
What we heard
|
A poorly performing VM appears to have the same number of processors as a physical server which performs acceptably.
|
|
Initial suspicions
|
The hypervisor is multi-threaded and/or the way the hypervisor counts the number of available processors and cores is deceptive.
|
|
Investigation steps
|
Determine whether the hypervisor has hyper- or multi-threaded processors.
|
|
What we discovered
|
The hypervisor had multi-threaded processors which the hypervisor counted as separate CPUs. It was assumed that a 4 vCPU VM would be the same as a 4 CPU physical server.
|
|
Further analysis
|
Counting processors in some virtualized environments can be deceptive. On some Intel-based x86 architectures which are hyperthreaded, the virtualization software may double the number of processors, so that a hyperthreaded 16-core server may appear to have 32 cores from inside the virtualization software.
We have seen cases where IT departments that did not fully understand how hyperthreaded cores might be represented in virtualized consoles immediately assume that virtualization has spontaneously doubled their investment. Certainly it may be cheaper to buy virtualization software than invest in twice as much hardware. However it can be catastrophic to assume that a 4 vCPU VM will perform as well as a 4 CPU physical server. On a hyperthreaded server, the 4 vCPU may actually be only 2 physical processors and have half the capacity of the 4-core physical server.
We have seen cases where customers look at their new 32 vCPUs and start parceling out less important servers with 1 vCPU capacity (half a processor on a hyperthreaded server). In the physical world, an IT administrator will probably not assign a mission critical application to a single-core server, and so these 1 vCPU servers may not be mission critical.
We have seen cases where 1 vCPU servers were used as proxy servers, mail servers or HTTP servers (theoretically the less intensively stressed parts of a topology). In actuality, these half-processor equivalents show a wide variance in responsiveness.
If you are using VMs on hyperthreaded servers, we recommend never configuring a VM with less than 1 physical core, or less than 2 vCPUs on a hyperthreaded server. Consequently, when Rationals system requirements specify a minimum of 4 cores, this translates to a minimum of 8 vCPU on a hyperthreaded server.
|
|
Keep in mind
|
Note that some environments and vendors take pains to clarify the distinction between physical processors and virtual or logical cores. A physical machine with 4 processors may appear to have 8 virtual or logical cores.
Some vendors actually permit allocating partial cores to a VM. This would be like renting a car but not having complete control over the front set of tires. Additionally, some vendor tools actually permit allocated cores to be spread across sockets. To extend the car analogy, this would be like having to share a pair of tires with your neighbor. The extra work the server must do to manage this sharing directly impacts performance. See Figure 3 for a vendor specific example of how these settings may be set in one vendors hypervisor.
|
Situation No. 3: Dispensing 1 GB at a time
|
Troubleshooting Situation 3 |
|
What we heard
|
After noting initial poor performance, Rational product administrator asked for and received more VM resources but performance actually degraded further.
|
|
Initial suspicions
|
Hypervisor was becoming increasingly overcommitted.
|
|
Investigation steps
|
Confirm VM allocations and ask VM admin about resource allotment policies. |
|
What we discovered
|
Virtualization not closely managed; VM administrators did not understand how the hypervisor managed resources. |
|
Further analysis
|
Virtualization can permit dynamic resource allocation. An administrator can increase a VMs processor or RAM allocation from a console without having to physically open a box and manipulate components. Many dimensions of a VMs resources (CPU, memory, network, etc.) can be dynamically adjusted, often with just a reboot of the VM required for changes to take effect.
We have seen cases where a Rational product administrator notes a VM is starved for memory resources, and asks the VM administrator for more. In one particular instance, the VM administrator attempted to appease the Rational product administrator by offering 1 GB of memory at a time. Recall that in the physical server world, a 4 GB server really did perform better than a 3 GB server. In this case the VM administrator offered to increase a 12 GB RAM to 13 GB RAM, however performance did not improve. In fact, performance degraded with the added RAM.
In a poorly managed virtualized environment without dedicated resource allocation, that extra 1 GB RAM may be imaginary. If a 16 GB hypervisor hosts 4 GB VMs and increases memory on one of those images to 5 GB, then that hypervisor is trying to have 17 GB when there are actually only 16 GB. That 5 GB RAM server actually approximates 4.71 GB RAM ( 5 x 16/17 ), and the hypervisor will spend time swapping used and unused RAM to disc to make that extra RAM available.
|
|
Keep in mind
|
Be wary if your VM administrator offers unusual increments of any resource, for example RAM allocations such as 7, 11 or 13 GB.
Some VM administrators not only avoid overcommitment, but try to ensure that VMs themselves never exceed 50% consumption of their allotment of CPU and memory. We have heard of situations where performance degraded as soon as consumption crossed the 50% threshold.
We have also heard of situations where customers whose Rational products were performing perfectly fine on VM images but at less than 50% resource consumption, had their VM administrators proportionally reduce resources thinking they were excess (a 8 vCPU image at 50% could be as well served by a 6 vCPU or 4 vCPU image) and performance degraded immediately.
|
Situation No. 4: Poor performance because of undersized pooled resources
|
Troubleshooting Situation 4 |
|
What we heard
|
Very poor performance at single and 2-4 concurrent users.
|
|
Initial suspicions
|
CPU and memory resources were undersized, perhaps a global setting as we heard that slowness seemed to scale linearly, meaning one user took approx 1 second to complete a task, 2 users took approximately twice that amount of time, 3 users took approximately 3 times that time, etc.
|
|
Investigation steps
|
- Confirm VM requirements (how much CPU, RAM, network capacity, etc.)
- Ask to see hypervisor console
- Validate dedicated resources
|
| What we discovered | VMs were sharing an undersized pool of processor resources |
| Further analysis | Five VMs were sharing a 4 GHz pool. This meant each VM had essentially an average of 0.8 GHz processor which is vastly undersized for any application load.
Problem was solved by increasing the shared pool to 60 GHz.
|
|
Keep in mind
|
Because the slow performance appeared to be linear in growth (admittedly, it was a bit hard to tell because of the few data samples), we suspected a configuration or bottleneck at the hypervisor level, not just the individual application or VM.
Close examination of the VM console revealed the misconfiguration.
|
One vendors control panels
To guide our readers, we offer examples of one vendors control panels, in this case from VMware ESX.
Figure 1 shows the VMware ESX administration panel where CPU resources can be set. Note that CPU resources can be specified down to the individual cycle (MHz). In this example, the VM has reserved 10722 MHz or the entire available capacity of the CPU. The limit is set as high as is possible to ensure the image has the full CPU allotment. The Unlimited checkbox is selected which means that the VM has access to these resources and more if necessary.
FIGURE 1: VMware ESX administration panel: Specifying CPU affinity
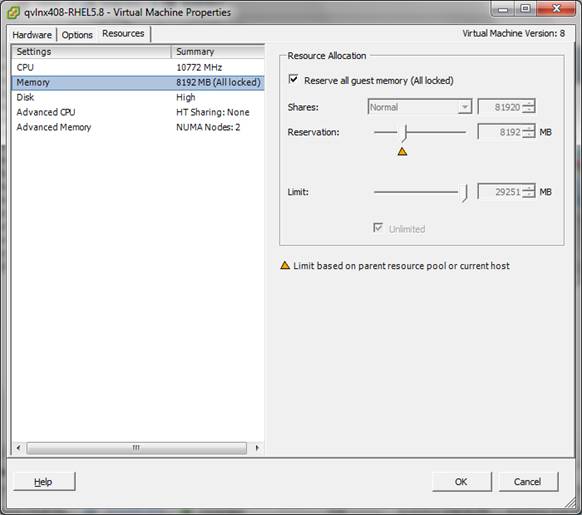
Figure 2 shows that the VM has a reservation of 8192 MB, and because the Reserve all guest memory checkbox is checked, the allocation is dedicated (locked).
FIGURE 2: VMware ESX administration panel: Specifying memory affinity
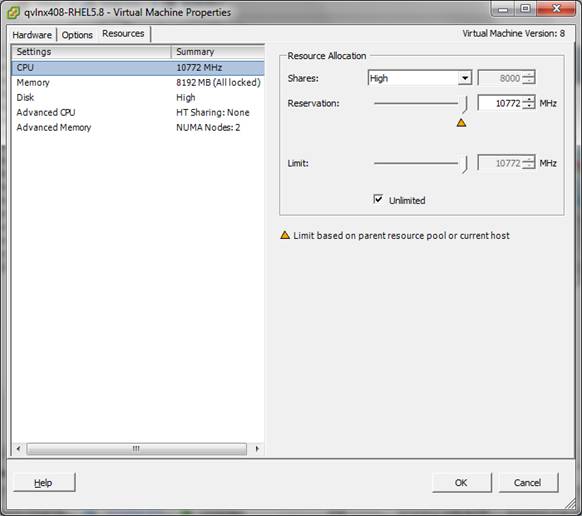
Figure 3 shows that this VMs logical processors will not be shared by any other VM, and that a contiguous region of processors will be allocated.
FIGURE 3: VMware ESX administration panel: Specifying processor affinity
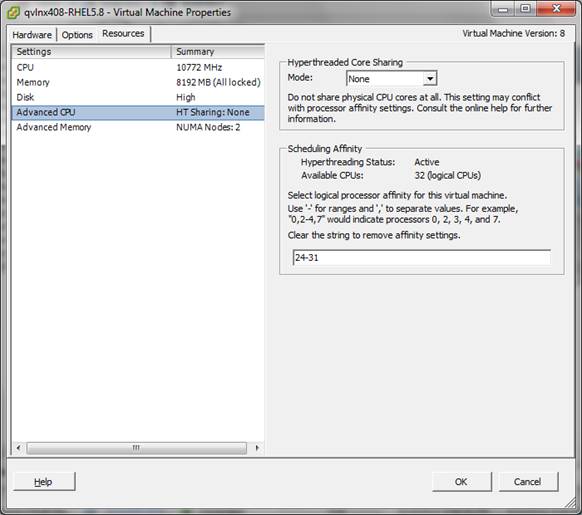
Figure 4 shows that memory for the VM will be taken from only one NUMA node.
FIGURE 4: VMware ESX Administration panel: Specifying NUMA affinity

Figure 5 shows the physical resources of the ESX server.
FIGURE 5: Physical resources of the ESX server
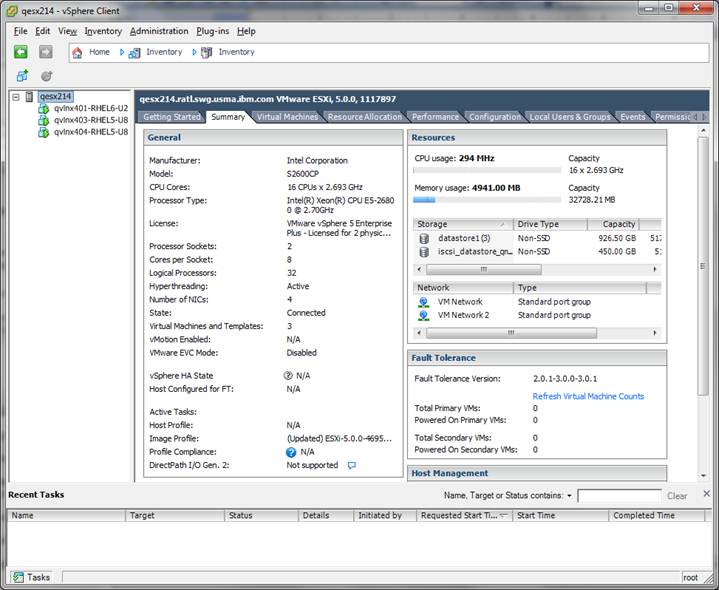
Figure 6 shows the CPU allocation of the VM images, in this case 20 cores are used.
FIGURE 6: CPU allocation of the VM images
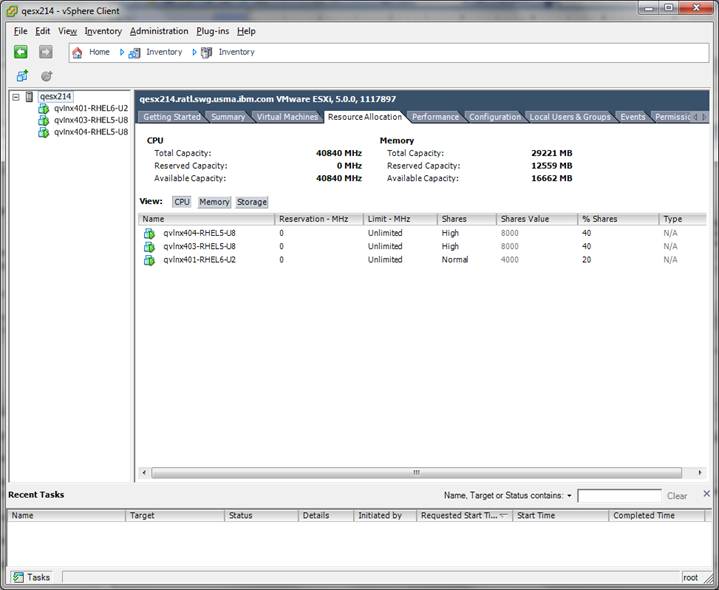
Figure 7 shows overcommitted CPU. Note that the Shares Value column totals 36000 when the physical is only 32000 (1 core = 1000).
FIGURE 7: An overcommitted CPU
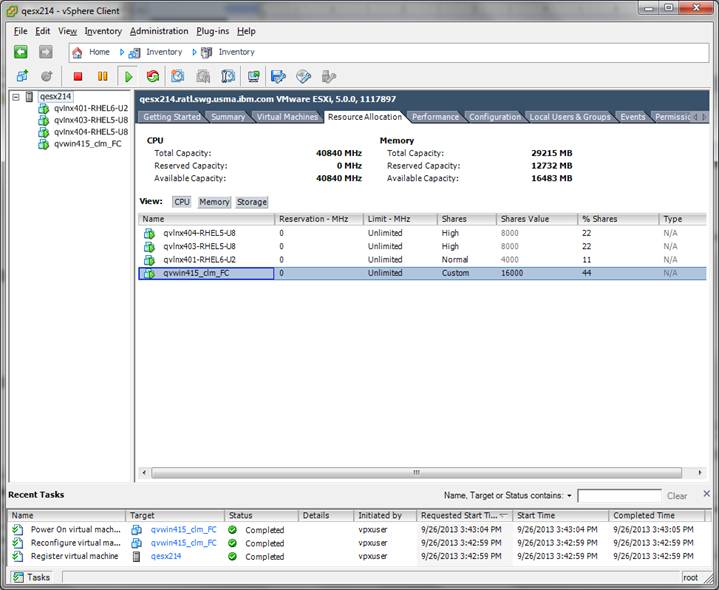
Figure 8 shows the Memory allocation of the images
FIGURE 8: Memory allocation
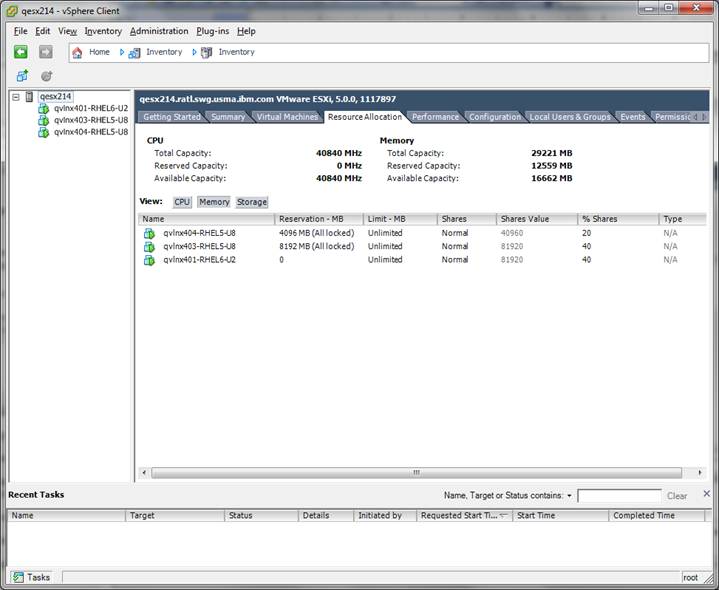
Figure 9 shows overcommitted memory. Note that the Shares Value column totals 36 GB when the physical is only 32 GB.
FIGURE 9: Overcommitted memory
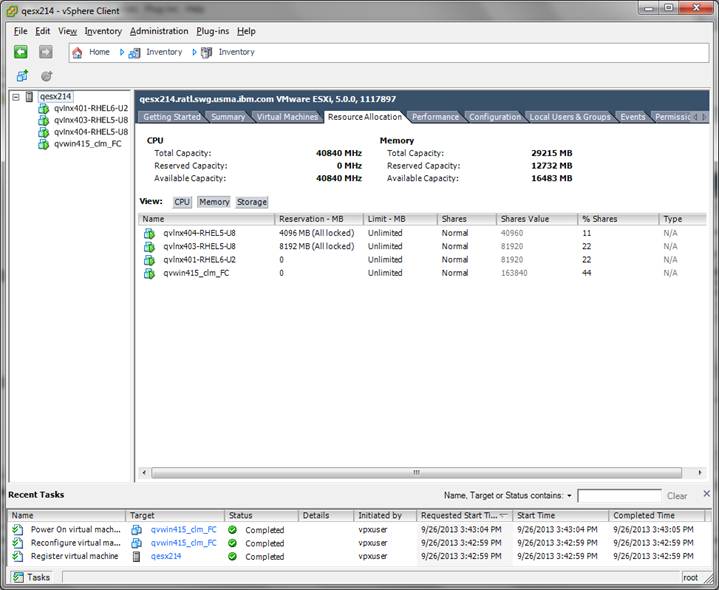
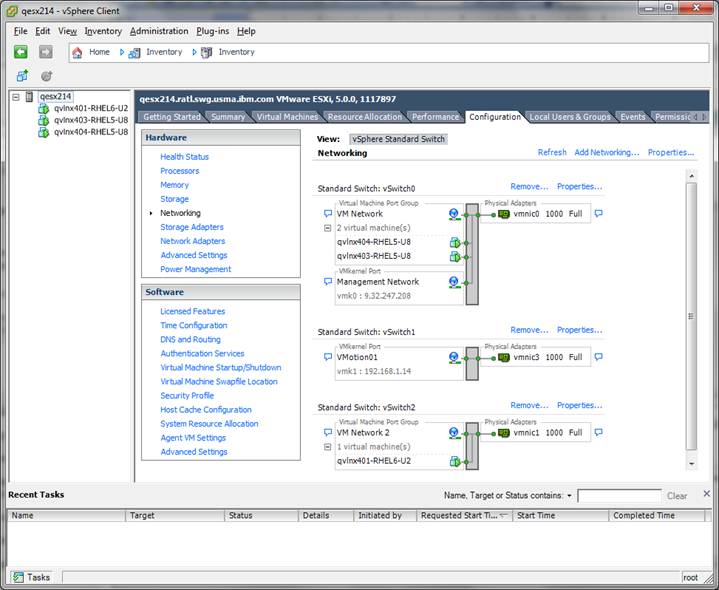
Figure 10 shows the Networking configuration of the images.
FIGURE 10: Networking configuration

Related topics:
External links:
Additional contributors: HarryIAbadi
![]() Troubleshooting problems in virtualized environments
Troubleshooting problems in virtualized environments  Figure 2 shows that the VM has a reservation of 8192 MB, and because the Reserve all guest memory checkbox is checked, the allocation is dedicated (locked).
FIGURE 2: VMware ESX administration panel: Specifying memory affinity
 Figure 3 shows that this VMs logical processors will not be shared by any other VM, and that a contiguous region of processors will be allocated.
FIGURE 3: VMware ESX administration panel: Specifying processor affinity
 Figure 4 shows that memory for the VM will be taken from only one NUMA node.
FIGURE 4: VMware ESX Administration panel: Specifying NUMA affinity
 Figure 5 shows the physical resources of the ESX server.
FIGURE 5: Physical resources of the ESX server
 Figure 6 shows the CPU allocation of the VM images, in this case 20 cores are used.
FIGURE 6: CPU allocation of the VM images
 Figure 7 shows overcommitted CPU. Note that the Shares Value column totals 36000 when the physical is only 32000 (1 core = 1000).
FIGURE 7: An overcommitted CPU
 Figure 8 shows the Memory allocation of the images
FIGURE 8: Memory allocation
 Figure 9 shows overcommitted memory. Note that the Shares Value column totals 36 GB when the physical is only 32 GB.
FIGURE 9: Overcommitted memory
 Figure 10 shows the Networking configuration of the images.
FIGURE 10: Networking configuration

 Figure 2 shows that the VM has a reservation of 8192 MB, and because the Reserve all guest memory checkbox is checked, the allocation is dedicated (locked).
FIGURE 2: VMware ESX administration panel: Specifying memory affinity
 Figure 3 shows that this VMs logical processors will not be shared by any other VM, and that a contiguous region of processors will be allocated.
FIGURE 3: VMware ESX administration panel: Specifying processor affinity
 Figure 4 shows that memory for the VM will be taken from only one NUMA node.
FIGURE 4: VMware ESX Administration panel: Specifying NUMA affinity
 Figure 5 shows the physical resources of the ESX server.
FIGURE 5: Physical resources of the ESX server
 Figure 6 shows the CPU allocation of the VM images, in this case 20 cores are used.
FIGURE 6: CPU allocation of the VM images
 Figure 7 shows overcommitted CPU. Note that the Shares Value column totals 36000 when the physical is only 32000 (1 core = 1000).
FIGURE 7: An overcommitted CPU
 Figure 8 shows the Memory allocation of the images
FIGURE 8: Memory allocation
 Figure 9 shows overcommitted memory. Note that the Shares Value column totals 36 GB when the physical is only 32 GB.
FIGURE 9: Overcommitted memory
 Figure 10 shows the Networking configuration of the images.
FIGURE 10: Networking configuration
