


DRAFT: This document is under review and is subject to change.
Introduction
This article presents the performance and correctness validation results for the LQE resumable TRS validation feature introduced in IBM Engineering Lifecycle Management (ELM) 7.3.0. The evaluation focused on LQE-side TRS validation performance, pause-and-resume behaviour, and validation correctness across multiple data providers. Starting with ELM 7.3.0, LQE supports resumable TRS validation. When resumable validation is enabled, LQE processes pre-built validation lists in configurable windows. The configuration is applied independently to each data provider and can be adjusted based on the number of resources and available disk space. The following parameters control Window Validation processing:| Parameter | Default value | Description |
|---|---|---|
| Window Count | 50,000 | Defines the number of URIs fetched from the TRS feed and retained in the in-memory buffer before the data is flushed to disk. |
| LQE Batch Size | 50,000 | Defines the number of records fetched from the LQE Relational Store in a single batch. |
| Merge Fan-In | 64 | Defines the maximum number of sorted chunk files that can be merged in a single pass. |
The performance evaluation used the default 50K/50K/64 Window Validation configuration and covered the following scenarios:
- Baseline vs. Window Validation: Compared LQE-side TRS validation duration with Window Validation disabled, establishing the baseline, against validation with the feature enabled.
- Pause-and-Resume Validation: Verified that an active Window Validation operation could be paused and resumed successfully, without introducing material additional processing overhead or affecting validation correctness.
- DOORS Next Resources (RM)
- Engineering Test Management Resources (QM)
- Engineering Workflow Management Tracking and Planning Resources (CCM)
Summary of Test Scenario
The LQE resumable TRS validation feature was evaluated on ELM 7.3.0 across DOORS Next, ETM, and EWM data providers using the default 50K/50K/64 Window Validation configuration. The evaluation measured the performance impact of enabling Window Validation and verified the behaviour, processing overhead, and correctness of pause-and-resume operations.- Baseline vs. Window Validation (Feature OFF vs. Feature ON): LQE-side TRS validation duration was compared with Window Validation disabled and enabled. No measurable performance overhead was observed for ETM (+1m 40s) and EWM (+4m 22s) as both differences remained within normal run-to-run variability. For DOORS Next (RM) data provider, Window Validation increased the average validation duration from 1h 09m 47s to 1h 29m 08s, an increase of 19m 21s ,confirming that the increase was beyond normal run-to-run variability.
- Pause-and-Resume Validation: An active Window Validation operation was paused and resumed to validate feature behaviour, processing overhead, and result correctness. After excluding the planned pause intervals, the active processing times remained within the expected Window Validation execution variability. No material processing overhead attributable specifically to the pause-and-resume operation was observed across the three data providers.
Standard Disclaimer
The information in this document is distributed AS IS. The use of this information or the implementation of any of these techniques is a customer responsibility and depends on the customer's ability to evaluate and integrate them into the customer's operational environment. While each item may have been reviewed by IBM for accuracy in a specific situation, there is no guarantee that the same or similar results will be obtained elsewhere. Customers attempting to adapt these techniques to their own environments do so at their own risk. Any pointers in this publication to external Web sites are provided for convenience only and do not in any manner serve as an endorsement of these Web sites. Any performance data contained in this document was determined in a controlled environment, and therefore, the results that may be obtained in other operating environments may vary significantly. Users of this document should verify the applicable data for their specific environment. Performance is based on measurements and projections using standard IBM benchmarks in a controlled environment. The actual throughput or performance that any user will experience will vary depending upon many factors, including considerations such as the amount of multi-programming in the user's job stream, the I/O configuration, the storage configuration, and the workload processed. Therefore, no assurance can be given that an individual user will achieve results similar to those stated here. This testing was done as a way to compare and characterize the differences in performance between different versions of the product. The results shown here should thus be looked at as a comparison of the contrasting performance between different versions, and not as an absolute benchmark of performance.Data Shapes
The test environment uses the standard CLM performance topology for LQE-side TRS validation. All validation activities were executed against a pre-indexed LQE Relational Store (LQE RS) that was fully rebased with each application server. Below are three data providers evaluated during LQE-side TRS validation:| Provider | Application | TRS2 Endpoint | Total Resources |
|---|---|---|---|
| RM | DOORS Next (DN) | /rm/trs2 | 3,740,956 |
| QM | Engineering Test Management (ETM) | /qm/trs2 | 3,451,996 |
| CCM | Engineering Workflow Management (EWM) | /ccm/oslc/workitems/trs2 | 2,185,699 |
All validations were performed after a full rebase and re-index on both the application and LQE sides. The default Window configuration used throughout is:
- Window Count: 50,000
- LQE Validation Batch Size: 50,000
- LQE Validation Merge Fan-In: 64
LQE-side TRS Resumable Testing
This section summarizes the LQE TRS Resumable Validation results across three data providers. The evaluation focused on performance impact, pause-and-resume behaviour, and validation correctness. All testing was conducted on the ELM 7.3.0 M10 release using an Oracle database backend and an LQE Relational Store (RS) database.- DOORS Next Resources (RM)
- Engineering Test Management Resources (QM)
- Engineering Workflow Management Tracking and Planning Resources (CCM)
Summary of results
Window Validation (50K/50K/64) was tested across three data providers covering ~2.1 and 3.7 million resources.| Provider | Resources | Overhead | vs normal run-to-run variation | Result |
|---|---|---|---|---|
| DN — (rm/trs2) | 3,740,956 | +27.7% (+19m 21s) | 5.8× above normal run-to-run variation | Significant overhead |
| ETM— (qm/trs2) | 3,451,996 | +2.4% (+1m 40s) | 0.25× below normal run-to-run variation | No measurable overhead |
| EWM — (ccm/workitems/trs2) | 2,185,699 | +7.1% (+4m 22s) | 0.14× below normal run-to-run variation | No measurable overhead |
Performance: The default (50K/50K/64) window configuration is performance-neutral for ETM (QM) and EWM (CCM) data providers. For DN (RM), a significant overhead of ~27.7%(+19m 21s) was observed — 5.8× above the normal run-to-run variation. Pause/Resume: Across all three data providers, the pause-and-resume functionality operated as expected. After excluding the intentional pause duration, the effective processing time remained consistent with comparable windowed validation runs. No additional overhead was introduced by the pause/resume operation itself.
| Provider | Total (incl. pause) | Pause Duration | Active Processing Time | Additional Overhead Observed |
|---|---|---|---|---|
| RM | 1h 39m 30s | ~14m 24s | ~1h 25m 06s | No |
| QM | 1h 20m 59s | ~10m 18s | ~1h 10m 41s | No |
| CCM | 1h 15m 08s | ~14m 00s | ~1h 01m 08s | No |
Correctness: All validation runs across all three providers and both scenarios completed with zero missing resources and zero stale resources.
Doors Next Resources Data provider validation
Scenario 1 — Feature OFF vs. Window Validation (Feature ON)
| Data Provider | Resources | Baseline Mean (Feature OFF) | Feature ON Mean | Increase | % vs Baseline Mean |
|---|---|---|---|---|---|
| Doors Next (RM) — rm/trs2 | 3,740,956 | 1h 09m 47s | 1h 29m 08s | +19m 21s | +27.7% |
Individual LQE-side TRS validation run results:
| Run | Baseline (Feature OFF) | Windowed (Feature ON) | vs Baseline Mean |
|---|---|---|---|
| Run 1 | 1h 13m 08s | 1h 28m 06s | +26.2% |
| Run 2 | 1h 09m 18s | 1h 37m 31s | +39.7% |
| Run 3 | 1h 09m 05s | 1h 27m 12s | +25.0% |
| Run 4 | 1h 08m 32s | 1h 24m 17s | +20.8% |
| Run 5 | 1h 08m 52s | 1h 28m 33s | +26.9% |
| Mean | 1h 09m 47s | 1h 29m 08s | +27.7% |
Statistical summary:
- Observed overhead: +19m 21s (+27.7%)
- Expected run-to-run variability threshold: 3m 21s (4.8%)
- Overhead relative to the variability threshold: Approximately 5.8× higher, indicating that the observed difference significantly exceeds normal run-to-run variability
- Correctness: 0 missing resources and 0 stale resources
Scenario 2 — Pause and Resume Validation
Configuration: Window count=50,000 / LQE Batch=50,000 / FanIn=64| Metric | Value |
|---|---|
| Total validation duration (incl. pause) | 1h 39m 30s |
| Pause duration | ~14m 24s |
| Active processing time (total – pause) | ~1h 25m 06s |
Observations
Scenario 1: Enabling Window Validation for the RM data provider resulted in a measurable performance overhead. The mean validation duration increased from 1h 09m 47s with the feature disabled to 1h 29m 08s with the feature enabled, representing an increase of 19m 21s (+27.7%). This overhead was approximately 5.8× higher than the expected run-to-run variability threshold, confirming a significant performance impact.
Scenario 2: After excluding the planned pause duration of 14m 24s, the active processing time was approximately 1h 25m 06s. This result was within the Scenario 1 Window Validation run range of 1h 24m 17s to 1h 28m 33s, indicating that the pause-and-resume operation did not introduce additional processing overhead. Validation correctness was maintained with zero missing resources and zero stale resources.
ETM Resources Data provider validation
Scenario 1 — Feature OFF vs. Window Validation(Feature ON)
| Data Provider | Resources | Baseline Mean (Feature OFF) | Feature ON Mean | Increase | % vs Baseline Mean |
|---|---|---|---|---|---|
| ETM (QM) — qm/trs2 | 3,451,996 | 1h 11m 01s | 1h 12m 42s | +1m 40s | +2.4% |
Individual LQE-side TRS validation run results:
| Run | Baseline (Feature OFF) | Windowed (Feature ON) | vs Baseline Mean |
|---|---|---|---|
| Run 1 | 1h 07m 55s | 1h 14m 02s | +4.3% |
| Run 2 | 1h 10m 30s | 1h 11m 40s | +0.9% |
| Run 3 | 1h 19m 10s | 1h 10m 42s | –0.4% |
| Run 4 | 1h 08m 49s | 1h 13m 35s | +3.6% |
| Run 5 | 1h 08m 57s | 1h 13m 02s | +2.8% |
| Run 6 | 1h 10m 46s | 1h 13m 06s | +2.9% |
| Mean | 1h 11m 01s | 1h 12m 42s | +2.4% |
Statistical summary:
- Observed overhead: +1m 40s (+2.4%)
- Expected run-to-run variability threshold: 6m 41s (9.4%)
- Overhead relative to the variability threshold: 0.25×, indicating that the observed difference is well within normal run-to-run variability
- Correctness: 0 missing resources and 0 stale resources
Scenario 2 — Pause and Resume Validation
Configuration: Window count=50,000 / LQE Batch=50,000 / FanIn=64| Metric | Value |
|---|---|
| Total validation duration (incl. pause) | 1h 20m 59s |
| Pause duration | ~10m 18s |
| Active processing time (total – pause) | ~1h 10m 41s |
Observations
Scenario 1: Enabling Window Validation for the ETM(QM) data provider did not result in a measurable performance impact. The mean validation duration increased from 1h 11m 01s with the feature disabled to 1h 12m 42s with the feature enabled, representing an increase of 1m 40s (+2.4%). This increase was only 0.25× the expected run-to-run variability threshold, confirming that the difference was within normal execution variation.
Scenario 2: After excluding the planned pause interval of approximately 10m 18s, the active processing time was approximately 1h 10m 41s. This was consistent with the Scenario 1 Window Validation run range of 1h 10m 42s to 1h 14m 02s, indicating that the pause-and-resume operation did not introduce additional processing overhead. Validation correctness was maintained, with zero missing resources and zero stale resources.
Resource Utilization:
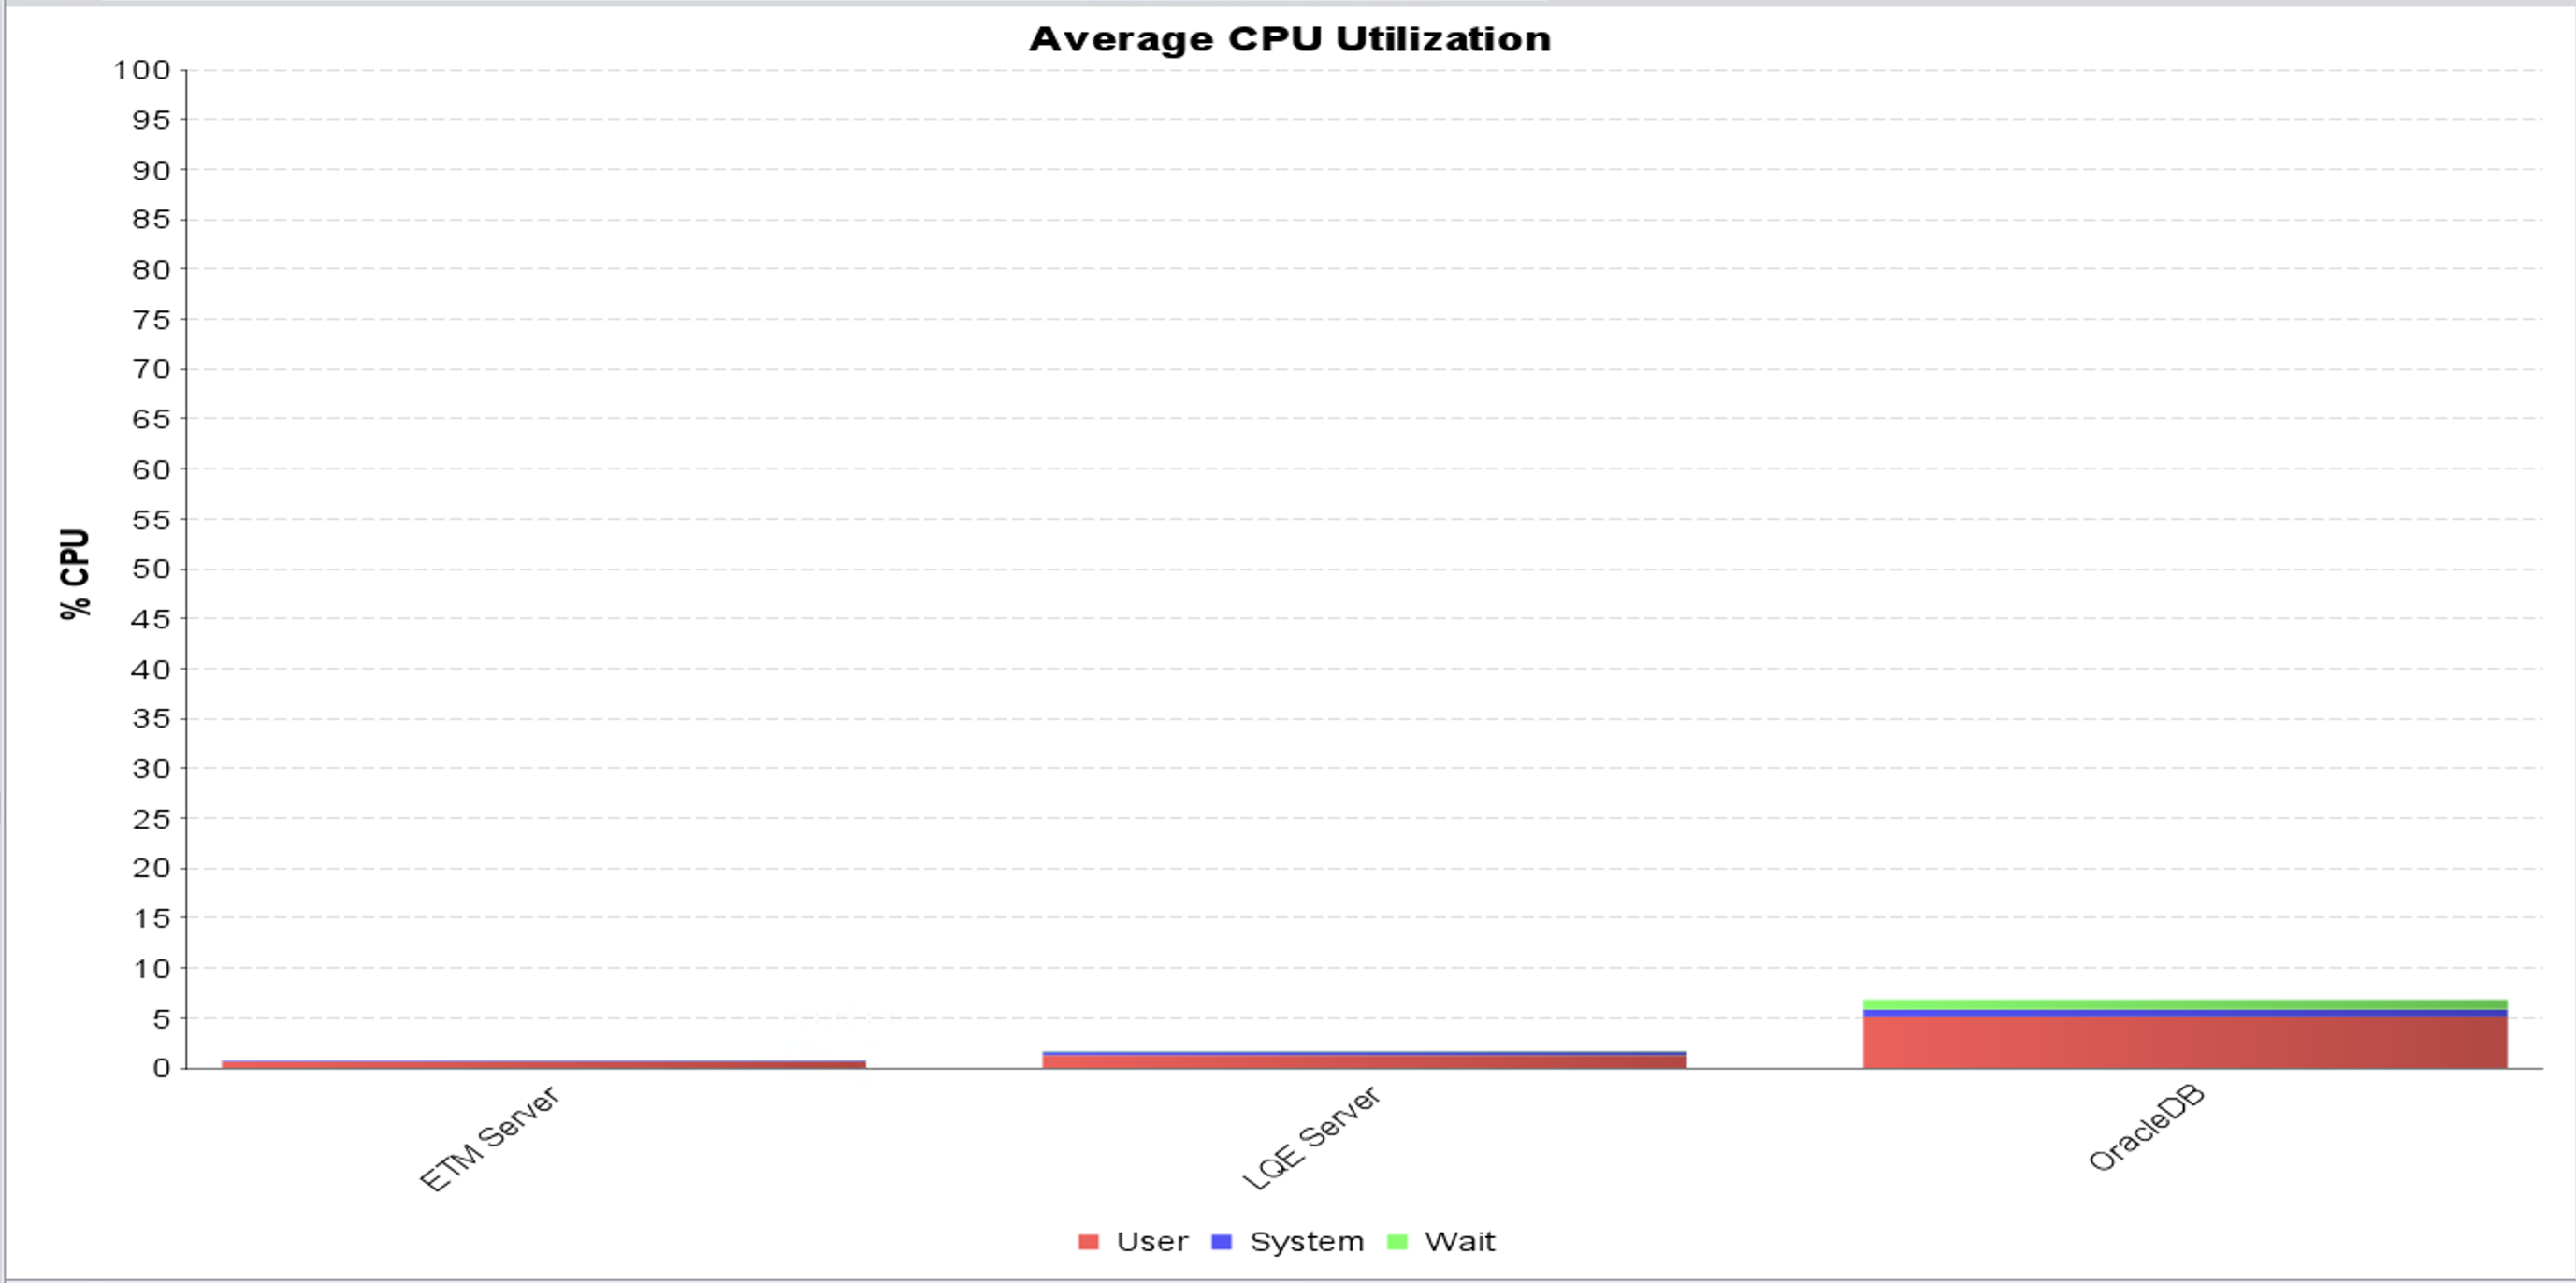
CPU Utilization- Oracle database server average CPU utilization remained low at approximately 5% throughout the validation run.
- LQE server average CPU utilization remained low at approximately 1.5% throughout the validation run.
- ETM application server average CPU utilization remained low at approximately 2% throughout the validation run.
 Disk Utilization
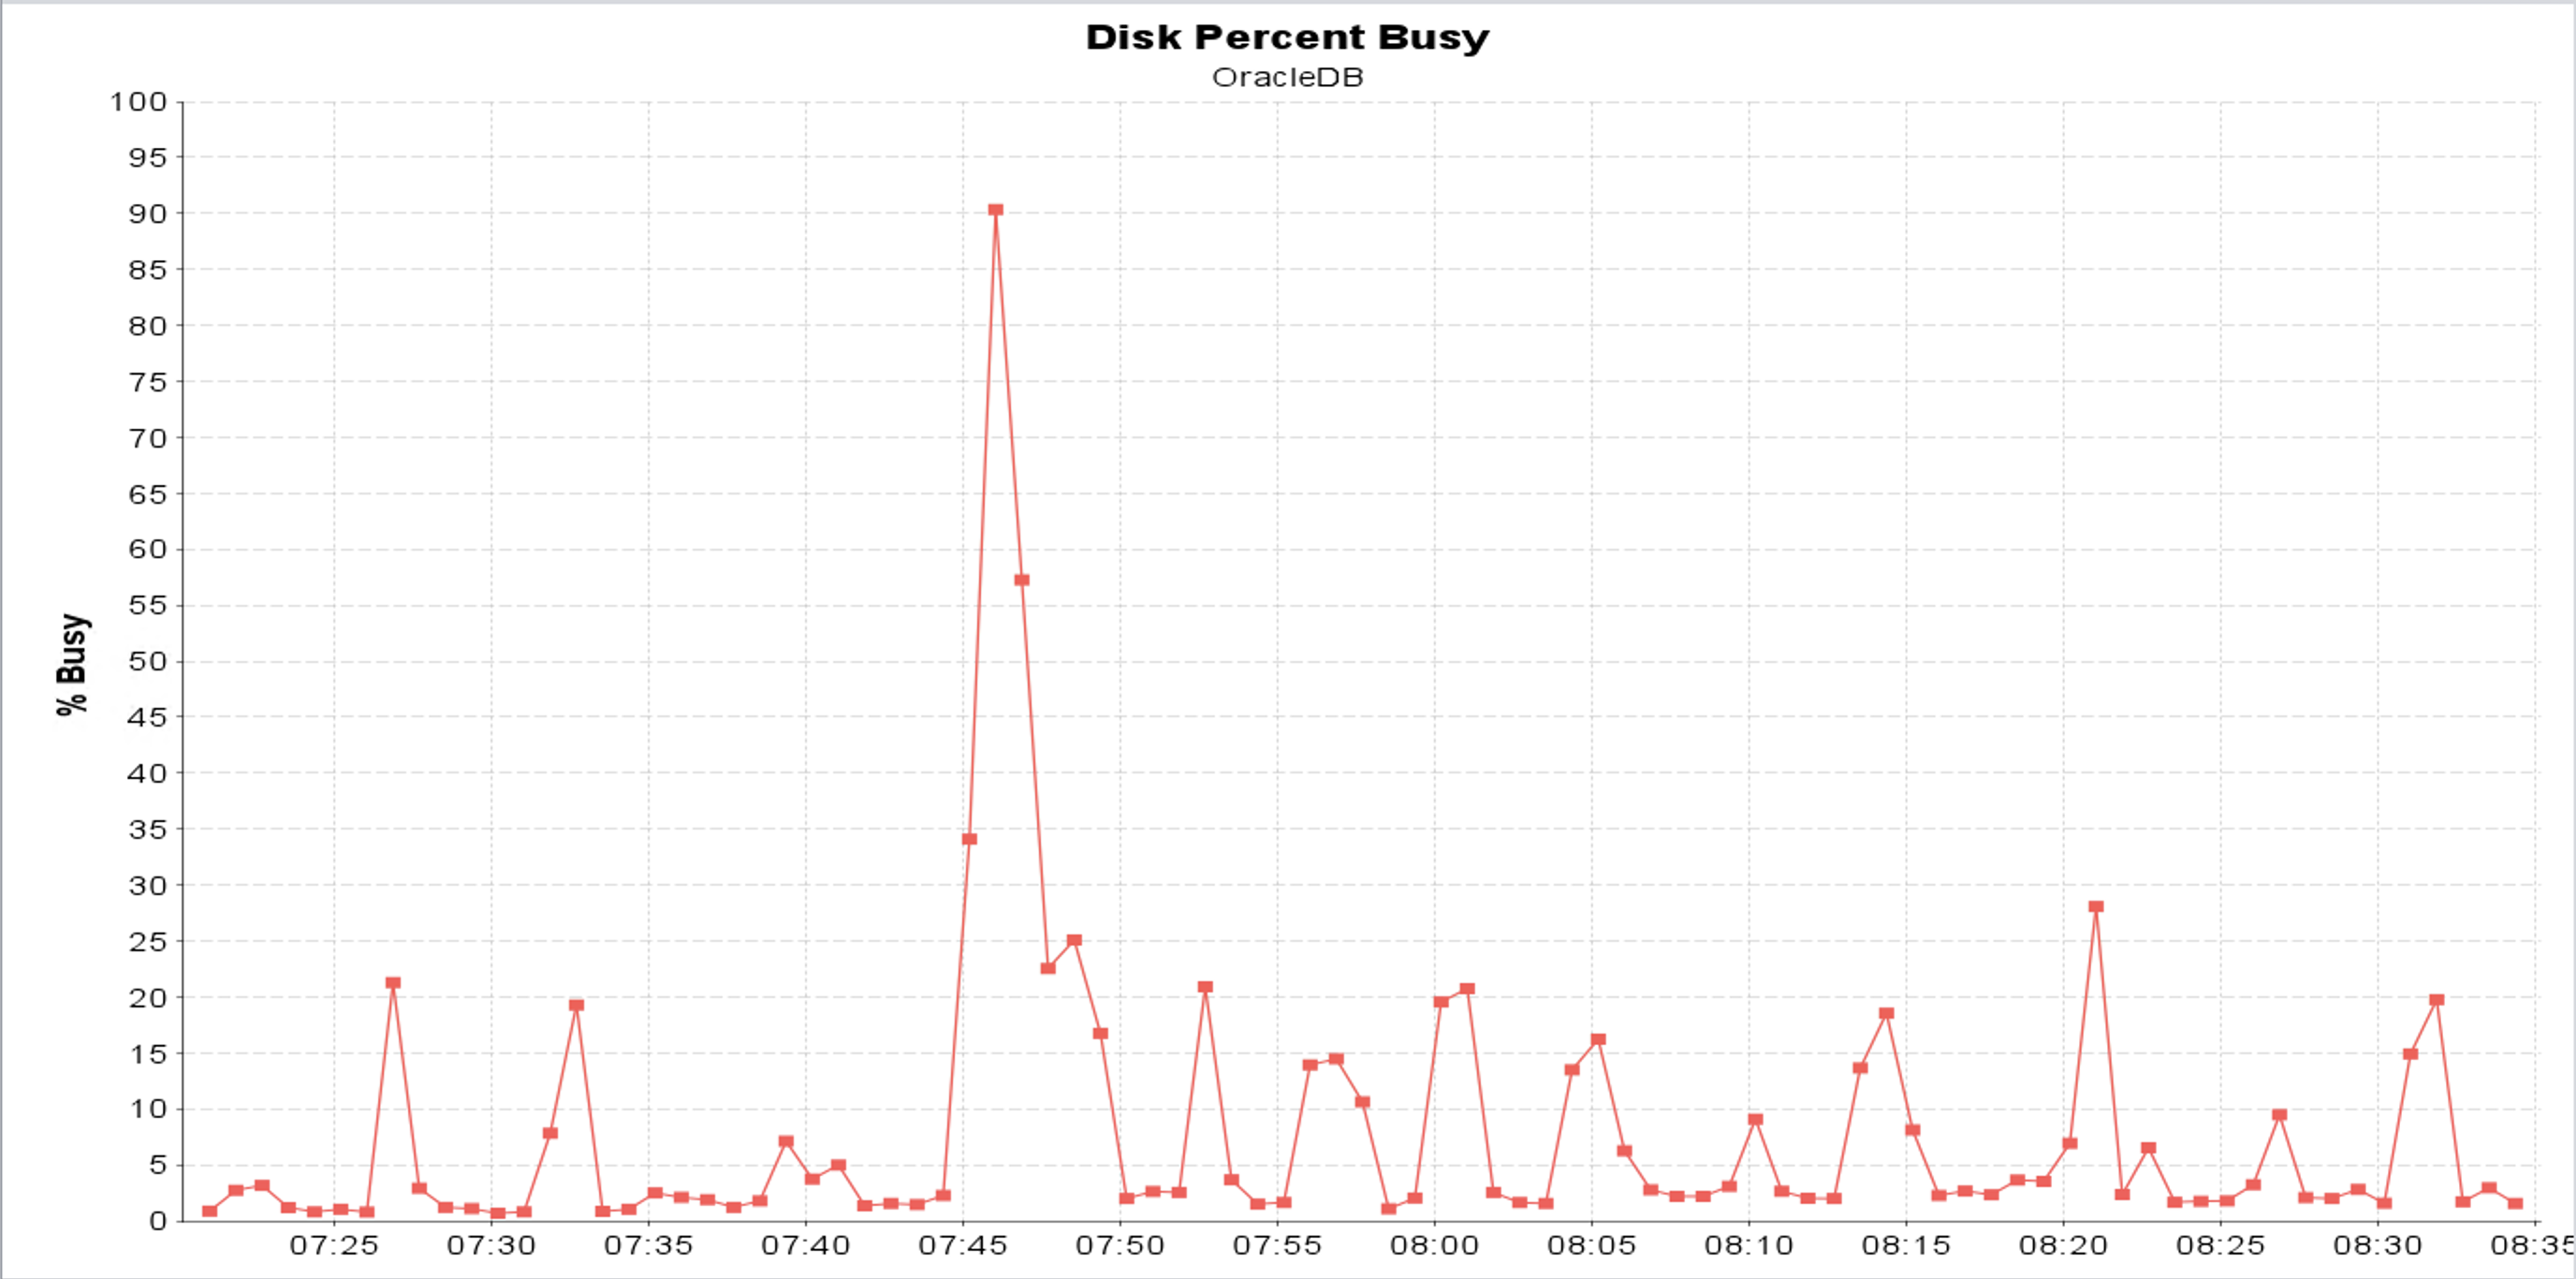
- Oracle database server average disk utilization was approximately 8% throughout the validation run.
- LQE server average disk utilization was approximately 1% throughout the validation run.
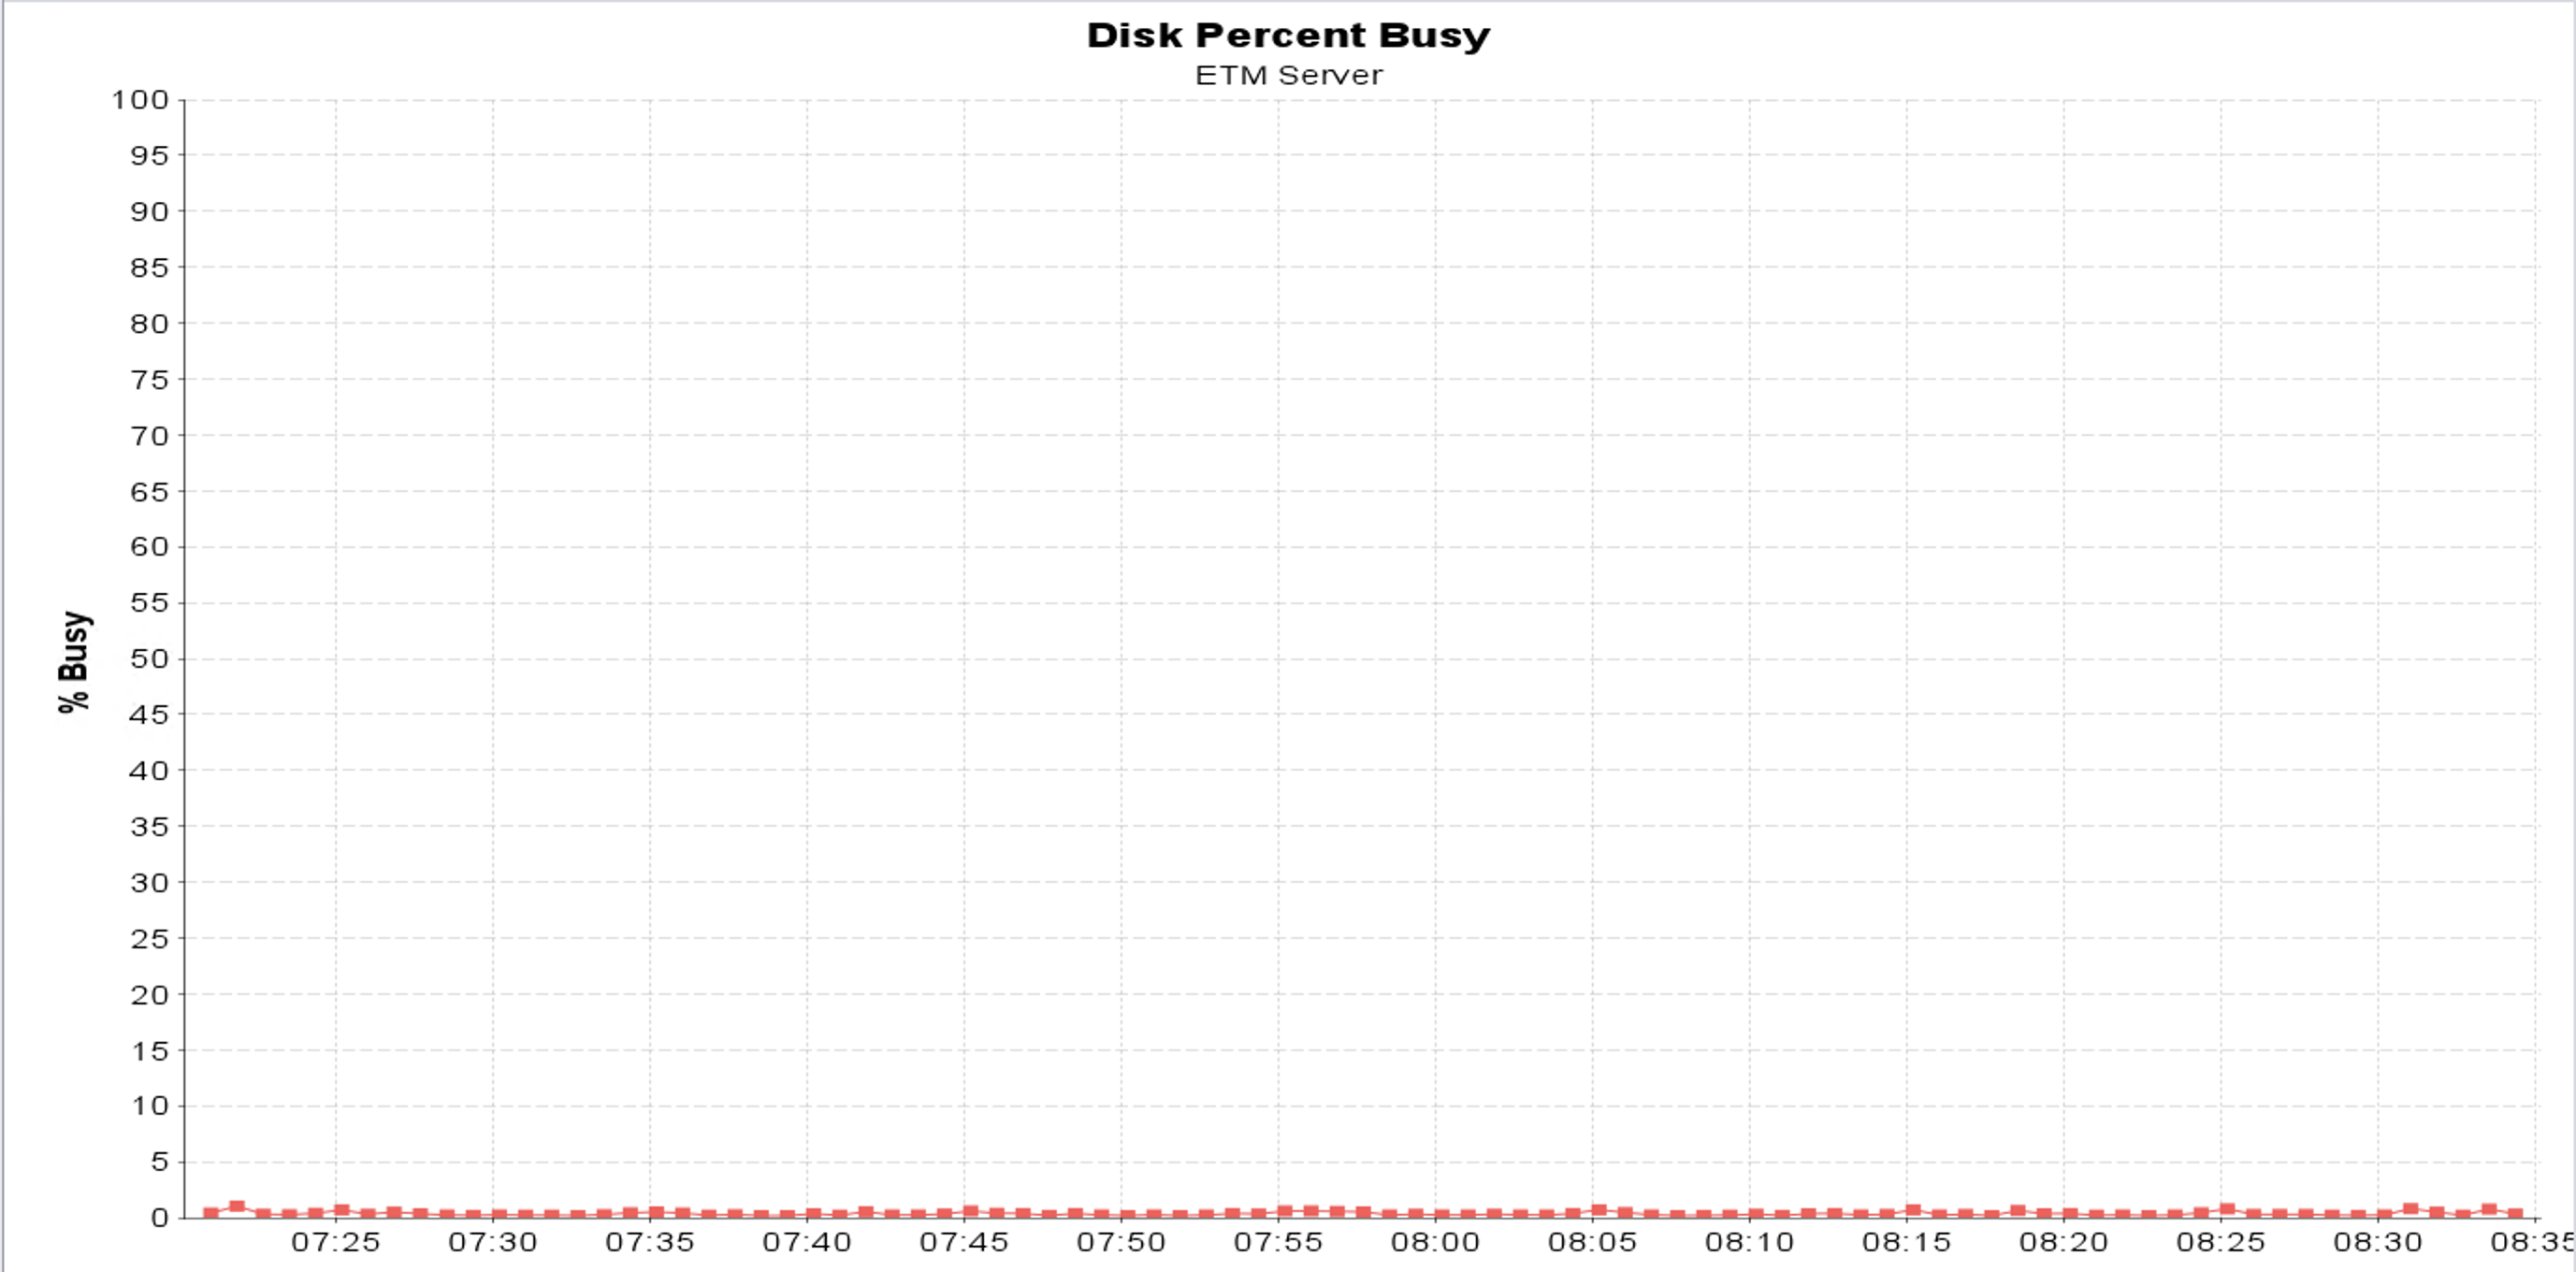
- ETM application server average disk utilization was approximately 0.3% throughout the validation run.

 JVM Heap Utilization
- Heap utilization remained well below the configured 32 GB JVM heap throughout the validation run, with consistently low GC pause times of approximately 0.2 seconds.

EWM Tracking and Planning Resources Data Provider Validation
Scenario 1 — Feature OFF vs. Window Validation(50K/50K/64)
| Data Provider | Resources | Baseline Mean (OFF) | Feature ON Mean | Increase | % vs Baseline |
|---|---|---|---|---|---|
| EWM (CCM) — ccm/workitems/trs2 | 2,185,699 | 1h 01m 35s | 1h 05m 56s | +4m 22s | +7.1% |
Individual LQE-side TRS validation run results:
| Run | Baseline (Feature OFF) | Windowed (Feature ON) 50K/50K/64 | vs Baseline Mean |
|---|---|---|---|
| Run 1 | 53m 40s | 56m 44s | –7.9% |
| Run 2 | 1h 34m 57s | 1h 45m 36s | +71.5% |
| Run 3 | 53m 26s | 55m 19s | –10.2% |
| Run 4 | 53m 03s | 57m 02s | –7.4% |
| Run 5 | 52m 47s | 55m 00s | –10.7% |
| Mean | 1h 01m 35s | 1h 05m 56s | +7.1% |
Statistical summary: * Observed overhead: +4m 22s (+7.1%) * Expected run-to-run variability threshold: 31m 18s (50.8%) * Overhead relative to the variability threshold: 0.14×, indicating that the observed difference is well within normal run-to-run variability * Correctness: 0 missing resources and 0 stale resources
Scenario 2 — Pause and Resume Validation
Configuration: Window count=50,000 / LQE Batch=50,000 / FanIn=64| Metric | Value |
|---|---|
| Total Validation duration (incl. pause) | 1h 15m 08s |
| Pause duration | ~14m 00s |
| Active processing time (total – pause) | ~1h 01m 08s |
Observations
Scenario 1: Enabling Window Validation for the EWM (CCM) data provider did not result in a measurable performance impact. The mean validation duration increased from 1h 01m 35s with the feature disabled to 1h 05m 56s with the feature enabled, representing an increase of 4m 22s (+7.1%). This increase was only 0.14× the expected run-to-run variability threshold, confirming that the difference was within normal execution variation.
Scenario 2: After excluding the planned pause interval of approximately 14m, the active processing time was approximately 1h 01m 08s. Although this was slightly higher than the typical Scenario 1 Window Validation run range of 55m 00s to 57m 02s, the difference remained within normal run-to-run variability. Therefore, no measurable additional processing overhead attributable to the pause-and-resume operation was observed. Validation correctness was maintained, with zero missing resources and zero stale resources.
Resource Utilization:
CPU Utilization- Oracle database server average CPU utilization remained low at approximately 11.8% throughout the validation run.
- LQE server average CPU utilization remained low at approximately 1.5% throughout the validation run.
- EWM application server average CPU utilization remained low at approximately 2.9% throughout the validation run.
 Disk Utilization
- Oracle database server average disk utilization was approximately 13.1% throughout the validation run.
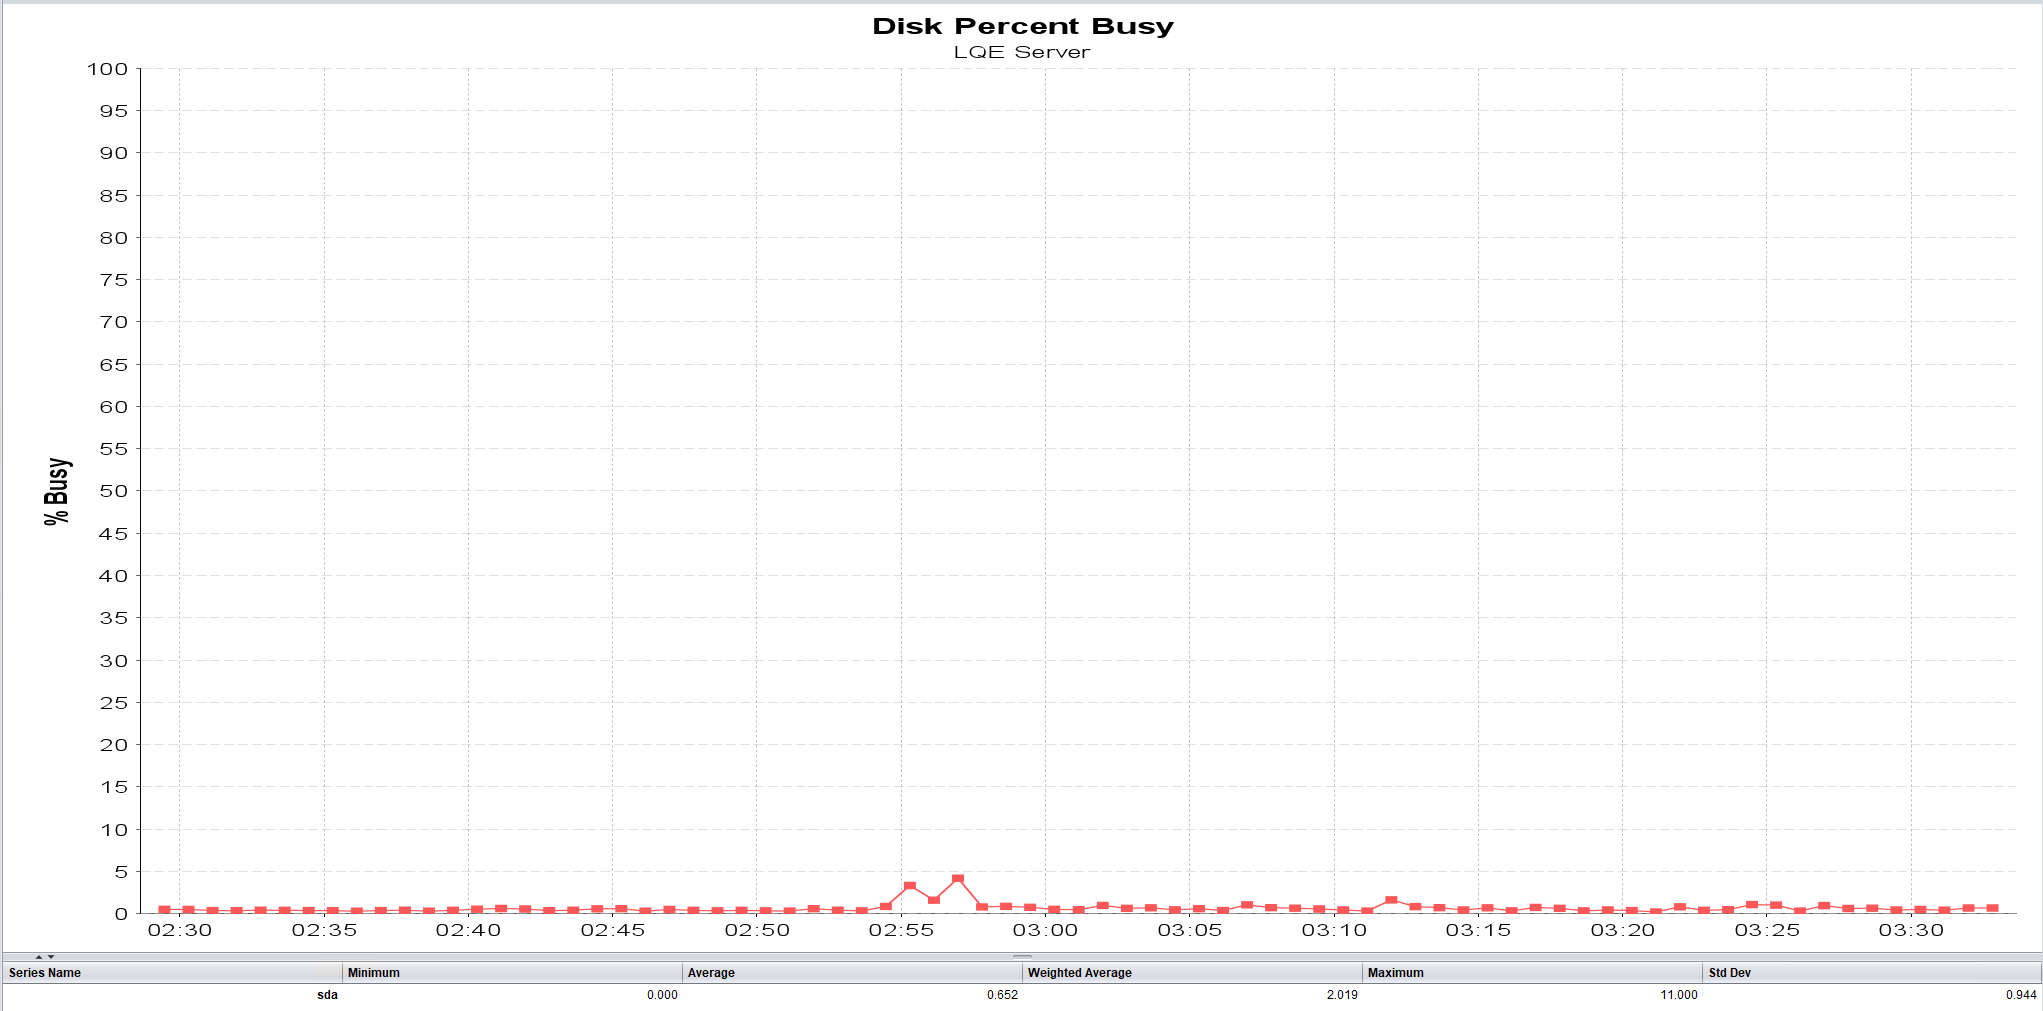
- LQE server average disk utilization was approximately 0.6% throughout the validation run.
- EWM application server average disk utilization was approximately 0.003% throughout the validation run.

 JVM Heap Utilization
- Heap utilization remained well below the configured 32 GB JVM heap throughout the validation run, with consistently low GC pause times of approximately 0.2 seconds.

DN TRS Resumable testing
ETM TRS Resumable Testing
EWM TRS Resumable Testing
Test Environment Details:
The performance test environment consists of:
- 1 LQE Server
- 1 JTS/GC Server
- 1 DN (RM) Server
- 1 QM (ETM) Server
- 1 CCM (EWM) Server
- 1 Oracle Database Server with Application DB and LQE DB
- DN Indexed Resources: 3.7 Million across application server
- QM Indexed Resources: 3.5 Million across application server
- CCM Indexed Resources: 2.0 Million across application server
- LQE RS
The servers in the test environment are all physical machines. The hardware specifications are listed below.
Hardware Specifications| Role | Server | Number of machines | Machine type | Processor | Total processors | Memory | Storage | Network interface | OS and version |
|---|---|---|---|---|---|---|---|---|---|
| Proxy Server | IBM HTTP Server and WebSphere Plugin | 1 | IBM System x3550 M3 | 1 x Intel Xeon X3480 3.07 GHz (quad-core) | 8 | 16 GB | RAID 0 – 279GB SAS Disk x 1 | Gigabit Ethernet | Red Hat Enterprise Linux Server 7 (Maipo) |
| JTS/GC | Embedded WebSphere Liberty | 1 | IBM System x3550 M3 | 2 x Intel Xeon X5649 2.53 GHz (six-core) | 24 | 32 GB | RAID 1 – 136GB SAS Disk x 2 | Gigabit Ethernet | Red Hat Enterprise Linux Server 8 (Maipo) |
| DN Server | Embedded WebSphere Liberty | 1 | IBM System x3550 M4 | 2 x Intel Xeon E5-2640 2.5GHz (six-core) | 24 | 32 GB | RAID 5 – 279GB SAS Disk x 4 | Gigabit Ethernet | Red Hat Enterprise Linux Server 7 (Maipo) |
| QM server | Embedded WebSphere Liberty | 1 | IBM System x3550 M4 | 2 x Intel Xeon E5-2640 2.5GHz (six-core) | 24 | 32 GB | RAID 5 – 279GB SAS Disk x 4 | Gigabit Ethernet | Red Hat Enterprise Linux Server 7 (Maipo) |
| CCM server | Embedded WebSphere Liberty | 1 | IBM System x3550 M4 | 2 x Intel Xeon E5-2640 2.5GHz (six-core) | 24 | 32 GB | RAID 5 – 279GB SAS Disk x 4 | Gigabit Ethernet | Red Hat Enterprise Linux Server 7 (Maipo) |
| LQE RS | Embedded WebSphere Liberty | 1 | IBM System x3550 M4 | 2 x Intel Xeon E5-2640 2.5GHz (six-core) | 24 | 128 GB | RAID 5 – 279GB SAS Disk x 4 | Gigabit Ethernet | Red Hat Enterprise Linux Server 9 (Maipo) |
| Database | Oracle 19c Enterprise Edition | 1 | IBM System x3550 M3 | 2 x Intel Xeon E5-2640 2.5GHz (six-core) | 24 | 64 GB | RAID 10 – 279GB SAS Disk x 16 | Gigabit Ethernet | Red Hat Enterprise Linux Server 8 (Ootpa) |
- JTS: Jazz Team Server
- GCM: Global Configuration Management
- DN: DOORS Next
- RM: Requirements Management
- ETM : Engineering Test Management
- EWM : Engineering Workflow Management
- LQE RS: Lifecycle Query Engine (Relational Store)
- TRS: Tracked Resource Set


 Copyright © by IBM and non-IBM contributing authors. All material on this collaboration platform is the property of the contributing authors.
Contributions are governed by our Terms of Use. Please read the following disclaimer.
Dashboards and work items are no longer publicly available, so some links may be invalid. We now provide similar information through other means. Learn more here.