Introduction
This article presents the results of Report Builder (RB) performance testing for the Rational Collaborative Lifecycle Managment (CLM) 6.0.1 release.
RB allows users to create reports based on Lifecycle Query Engine (LQE) or Data Warehouse (DW) data sources. This article will show performance benchmarks from RB executing reports (queries) against a DW data source.
Disclaimer
The information in this document is distributed AS IS. The use of this information or the implementation of any of these techniques is a customer responsibility and depends on the customers ability to evaluate and integrate them into the customers operational environment. While each item may have been reviewed by IBM for accuracy in a specific situation, there is no guarantee that the same or similar results will be obtained elsewhere. Customers attempting to adapt these techniques to their own environments do so at their own risk. Any pointers in this publication to external Web sites are provided for convenience only and do not in any manner serve as an endorsement of these Web sites. Any performance data contained in this document was determined in a controlled environment, and therefore, the results that may be obtained in other operating environments may vary significantly. Users of this document should verify the applicable data for their specific environment.
Performance is based on measurements and projections using standard IBM benchmarks in a controlled environment. The actual throughput or performance that any user will experience will vary depending upon many factors, including considerations such as the amount of multi-programming in the users job stream, the I/O configuration, the storage configuration, and the workload processed. Therefore, no assurance can be given that an individual user will achieve results similar to those stated here.
This testing was done as a way to compare and characterize the differences in performance between different versions of the product. The results shown here should thus be looked at as a comparison of the contrasting performance between different versions, and not as an absolute benchmark of performance.
Methodology
Report Builder used the JMeter performance measurement tool from Apache to simulate clients as JMeter Threads. Each user is represented by 1 JMeter thread. For these tests, the load is incremented by 50 threads (users) between 50 and 1000.
The performance test models a dashboard refresh initiated by a user. When a user refreshes a dashboard, each widget (that represents one query) gets refreshed, resulting on multiple queries being executed in parallel.
Each thread (user) refreshes their dashboard resulting in 3 queries executed at the same time. The total number of threads are ramped up over a period of 10 minutes. Then each thread will continue to refresh their dashboard 15 times with a think time of 60 seconds between refreshes. Between concurrency tests there is 2.67 minute pause to allow the system to quiesce.
Queries are tested against a DB2 data warehouse that contains thousands of records created using an internal data generator utility. For these tests, Report Builder is configured to include only up to 3,000 records in the output. All queries used in the test return the maximum number of records (i.e 3,000). Report Builder queries can get the information from a single artifact (single-artifact queries) or from multiple linked artifacts (traceability queries). In these tests, all queries are single-artifact.
Total number of queries executed per run
| Users |
Total Queries Executed |
| 50 |
2250 |
| 100 |
4500 |
| 150 |
6750 |
| 200 |
9000 |
| 250 |
11250 |
| 300 |
13500 |
| 350 |
15750 |
| 400 |
18000 |
| 450 |
20250 |
| 500 |
22500 |
| 550 |
24750 |
| 600 |
27000 |
| 650 |
29250 |
| 700 |
31500 |
| 750 |
33750 |
| 800 |
36000 |
| 850 |
38250 |
| 900 |
40500 |
| 950 |
42750 |
| 1000 |
45000 |
Test data warehouse characteristics
The data in the data warehouse was created using an internal data generator utility. These are the number of records for some of the files:
| Artifact |
File |
Records |
| Requirement |
RIODS.REQUIREMENT |
831,475 |
| Test Case |
RIODS.TESTCASE |
10,001 |
| Work Item |
RIODS.REQUEST |
100,090 |
| Test Case Execution Record |
RIODS.EXECUTION_WORKITEM |
58,157 |
| Test Case Execution Result |
RIODS.EXECUTION_RESULT |
250,001 |
Performance Goals
The goal of this performance test was to determine how many users Report Builder could support in a Data Warehouse-report-based scenario when the users refreshed their dashboards throughout the day.
Topology
Both, the CLM Server and the Test Framework are located on a Windows machine, while the Data Warehouse is located in a remote DB2 Server running on Linux.
The specifications of machines under test are listed in the table below. Server tuning details are listed in Appendix A
Results
The following results are based on Data Warehouse query performance. The values displayed are in milliseconds and measure the time that it took for the Report Builder server to respond to the http request that executes a Data Warehouse query. Only requests that are successfully responded to are included in these measurements.
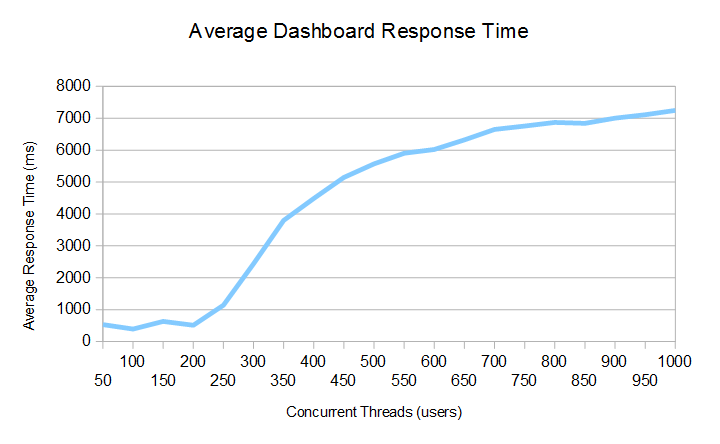
Illustration 1: Average Dashboard Response Time
In illustration 1, the average dashboard response time is less than 1 second with concurrent loads of 50, 100, 150 and 200 users. For larger loads, the average response time increases steadily until reaching a little over 7 seconds for 1000 concurrent users. In this test, there was a think time of 60 secs between dashboard refreshes. When the refresh think time is expanded the average response time improves, as well as the number of successful requests answered by the server.
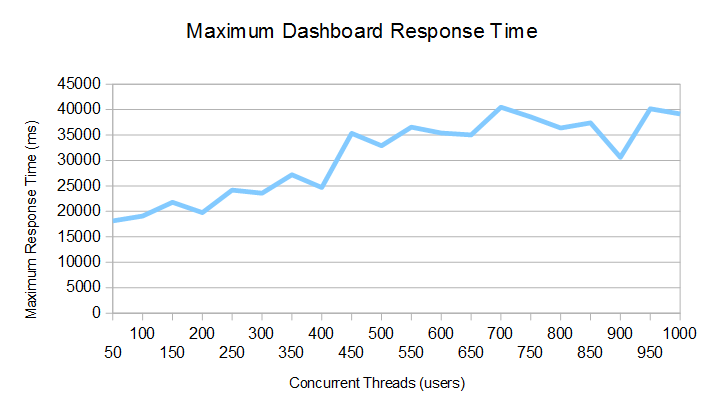
Illustration 2: Maximum Dashboard Response Time
In illustration 2, the maximum dashboard response time varies from 19 to 41 seconds depending on the number of concurrent threads (users). The maximum dashboard response time never exceeded 45 secs which most users would find acceptable. Something to keep in mind is that the queries used for testing returned 3,000 records each. During normal operation, queries returning such a large number of records would not be advised to be added to a dashboard. Instead, tuned queries returning significantly less records are expected to be the norm and for them, the expected execution times would decrease accordingly.
Appendix A - Server Tuning Details
| Product |
Version |
Highlights for configurations under test |
| Rational Collaborative Lifecycle Managment (CLM) |
6.0.1 |
JVM settings: |
| Max and init heap sizes: |
| JAVA_OPTS="$JAVA_OPTS -Xmx16G" |
| JAVA_OPTS="$JAVA_OPTS -Xms4G" |
| JAVA_OPTS="$JAVA_OPTS -Xmn512M" |
| Jazz Reporting Server |
6.0.1 |
Product Max number of http connections: |
| http.max.connections.route=50000 |
| http.max.connections.total=50000 |
| Apache Tomcat |
CLM packaged Version 7.0.54 |
JVM settings: |
| Maximum queue length for incoming connection requests : |
| acceptCount="1000" |
Appendix B Considerations
* In general, it is not advisable to return a large number of records on dashboards reports, specially on dashboards with high traffic. If there is a high number of concurrent users trying to refresh a such dashboard at the same time, the performance could be affected.
* If an environment needs to handle a large number of concurrent users (e.g. > 200), then the default values for http connections in the RB app.properties file may need some tuning. The authentication on RB is done through JTS, therefore the two apps need to talk using http requests. If the dashboards containing RB reports seem to be slow when all users try to refresh them at the same time (e.g. after logging in in the morning), increasing the values for http connections could help.
External links:

