How to profile the Rational Team Concert client for Eclipse IDE
Authors: PerformanceTroubleshootingTeamBuild basis: RTC 4.0.x
Profiling allows you to get very detailed timing information about individual method calls in the Rational Team Concert Client for Eclipse IDE. Profiling is only recommended if you are trying to address a very specific performance concern, and typically you will want to supply the gathered information to IBM support for more investigation. In general, Profiling produces a very large amount of trace data. It is best to keep the profiling session as short as possible, and perform only the steps that are strictly required to reproduce the observed performance issue.
If you are using a standalone installation of the Rational Team Concert Client for Eclipse IDE, you can use the Eclipse Test & Performance Tools Platform Project (TPTP) profiling capabilities, which are freely available.
| If the Rational Team Concert Client for Eclipse IDE is installed in the same Installation Manager Package Group with Rational Application Developer or Rational Software Architect (for WebSphere), you have the additional option of using a built-in profiling agent. See the technote How can you tell what is the exact cause of the slow response of the product?. |
Eclipse Test & Performance Tools Platform Project (TPTP) installation prerequisites
- The required TPTP software is included in the following products:
- Rational Application Developer
- Rational Software Architect
- Rational Software Architect for WebSphere
- Alternatively, you can install a standalone Eclipse 3.6.2 (Helios). You will have to add TPTP 7.2.4 as described in: Install TPTP with Update Manager. Note that Eclipse 3.6.2 is the highest version of Eclipse that includes TPTP.
Launching the Rational Team Concert Client for Eclipse IDE in profiling mode
Prepare the Rational Team Concert Client for Eclipse IDE for profiling
Prepare the Rational Team Concert Client for Eclipse IDE for profiling as follows:- Open the file eclipse.ini, located in the RTC Client for Eclipse IDE installation directory.
- Determine what is the location of the JVM used (found after the -vm argument)
- Determine the version and the bitness of the JVM, by launching the command:
java -version
from the directory where the JVM is located - If the RTC Client JVM version is 32bits, then you will need to use the 32bits profiler agent, if the RTC Client JVM is 64bits, you will need to use the 64bits profiler agent.
- The location of the Java profiler agents (referred to as Java profilers absolute path in the following sections) is as follows:
For Windows:<<Eclipse Home>>\plugins\org.eclipse.tptp.platform.jvmti.runtime_<version>\agent_files\<os_platform>
For Linux:<<Eclipse Home>>/plugins/org.eclipse.tptp.platform.jvmti.runtime_<version>/agent_files/<os_platform>
- To profile the RTC Client for Eclipse IDE with the CPU Profiler in standalone mode, with filters contained in filters.txt and writing the results into log.trcxml, add the following line at the very end of the eclipse.ini file (after the -vmargs argument)
For Windows:-agentpath:<Java profilers absolute path>\JPIBootLoader=JPIAgent:server=standalone,file=log.trcxml,filters=filters.txt;CGProf
For Linux the entire library file name must be used. So libJPIBootLoader.so should be used instead of JPIBootLoader or libJPIBootLoader:-agentpath:<Java profilers absolute path>/libJPIBootLoader.so=JPIAgent:server=standalone,file=log.trcxml,filters=filters.txt;CGProf
- For example, for a Windows installation of RTC Client for Eclipse 64 bits, you would use:
-agentpath:C:\eclipse-java-helios-SR2-win32-x86_64\eclipse\plugins\org.eclipse.tptp.platform.jvmti.runtime_4.6.3.v201102041710\agent_files\win_em64t\JPIBootLoader=JPIAgent:server=standalone,file=log.trcxml,filters=filters.txt;CGProf
- Save the eclipse.ini file.
Prepare the filters
Filtering is mandatory in this case: if you do not filter anything the RTC Client for Eclipse IDE will be unacceptably slow and the resulting log.trcxml file will be multiple Gigabytes just to complete the startup phase.- Create a file called filters.txt in the same directory where eclipse.ini is located.
- Use the following contents to start with:
com.ibm.team.* * INCLUDE
* * EXCLUDE
This means that all the methods of all the classes in packages that start with com.ibm.team are included, and all other methods are excluded. You might be able to restrict the filters further based on your knowledge of the problem area, or you might want to include some of the Eclipse packages if they are relevant to the problem at hand. For the full syntax of the filters, see Profiling an application in stand-alone mode.
Launch the RTC Client for Eclipse and reproduce the issue
- Open a command prompt.
- Change directory to the installation directory of the Rational Team Concert Client for Eclipse, so that the file filters.txt is found in the current directory.
- Launch the RTC Client for Eclipse from that directory.
- Reproduce the problem (note that the execution time will be significantly slower than normal, depending on how many methods you included in the filters). Make sure to keep the session as short as possible (do not include unnecessary operations, or reading the resulting data will be more difficult).
- Collect the file log.trcxml
- Remember to remove the additional line from the eclipse.ini file.
Read the profiling data
To read the profiling data, you need to launch one of the products listed in the Installation prerequisites section above. Then proceed as follows:- Open the Profiling and Logging Perspective: Window > Open Perspective > Other > Profiling and Logging
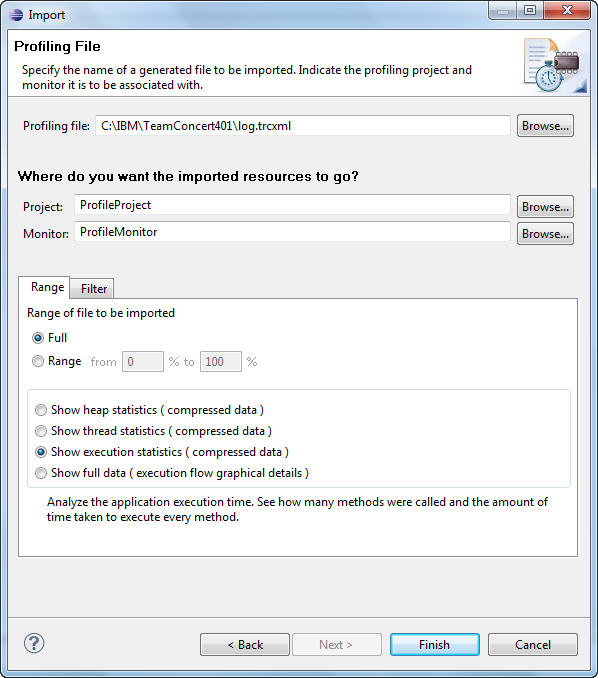
- Right click on the Profiling Monitor view and select: Import > Profiling and Logging > Profiling file, as follows:

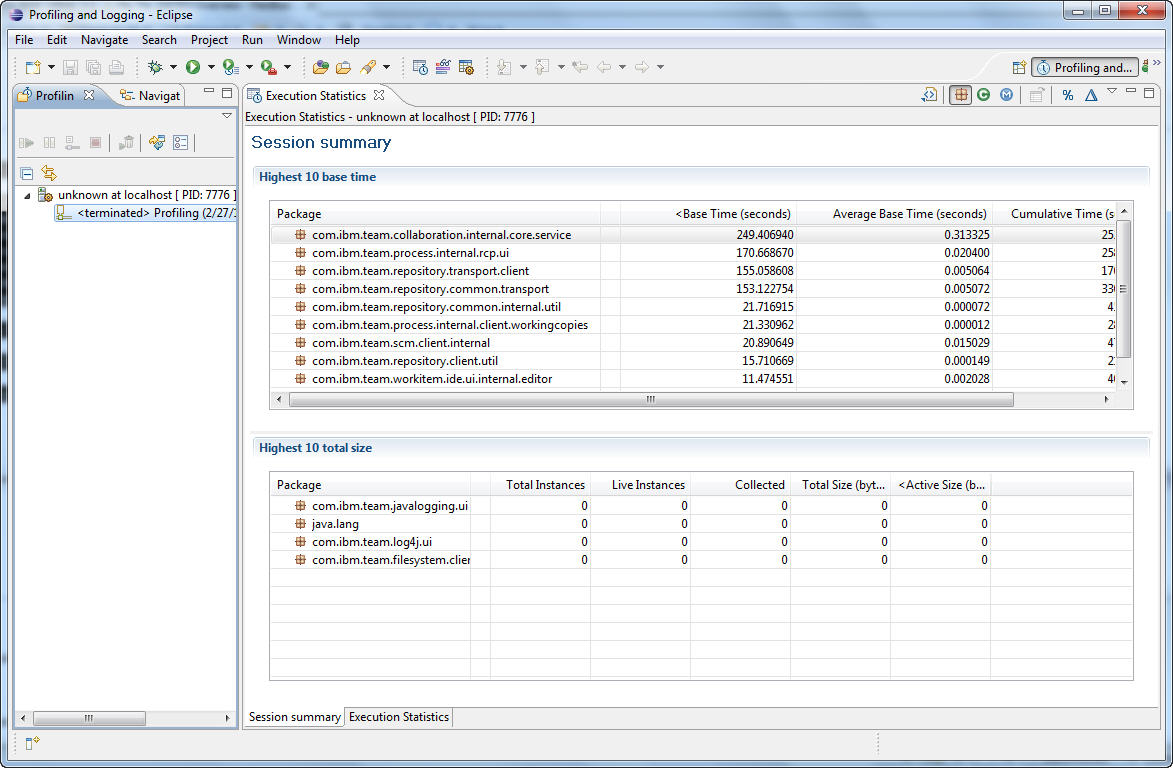
- Wait for the file to be imported, then right-click on it and choose: Open with > Execution statistics. You will see results like the following:

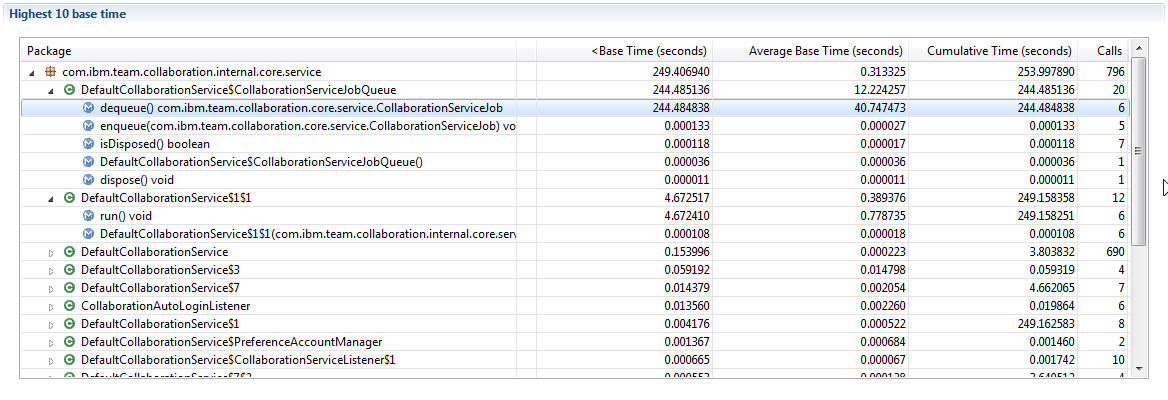
- You can drill down to the individual method level. You can see how many times a method was called and how much time it took.

- This data helps in identifying which specific methods contribute to the performance bottleneck. For the interpretation of the data, you might want to contact IBM support and supply the generated file.
Related topics:
External links:
- Eclipse 3.6.2: http://www.eclipse.org/downloads/packages/release/helios/sr2
- Install TPTP with Update Manager: http://wiki.eclipse.org/Install_TPTP_with_Update_Manager
- Profiling an application in stand-alone mode using Rational Application Developer or Rational Software Architect for WebSphere: http://publib.boulder.ibm.com/infocenter/radhelp/v8r5/index.jsp?topic=%2Forg.eclipse.tptp.platform.doc.user%2Ftasks%2Fteprofsa.htm
- Java Application profiling with TPTP: http://www.eclipse.org/articles/Article-TPTP-Profiling-Tool/tptpProfilingArticle.html
- How can you tell what is the exact cause of the slow response of the product?: http://www-01.ibm.com/support/docview.wss?uid=swg21627067
- How to contact IBM support: http://www-01.ibm.com/software/rational/support/contact.html
- How to send data to IBM support: http://www.ecurep.ibm.com/app/upload
Additional contributors: Lara Ziosi
Questions and comments:
Warning: Can't find topic Deployment.ProfileRationalTeamConcertClientForEclipseCommentsContributions are governed by our Terms of Use. Please read the following disclaimer.
Dashboards and work items are no longer publicly available, so some links may be invalid. We now provide similar information through other means. Learn more here.