Performance impact of different vCPU sizes within a VMware hypervisor
Authors: JosephStellrecht, VaughnRokosz Last updated: July 29, 2013 Build basis: Rational Team Concert 4.0.3, Rational Quality Manager 4.0.3, Rational Requirements Server 4.0.3Introduction
This report looks at the performance impact of changing the vCPU sizes of VMware Virtual Machines on Rational Team Concert.Summary of results
The physical CPU cores can not be directly translated to virtual CPUs within VMware. In this study, we were using dual 6-core physical hyper-threaded CPUs that were not able to be translated to 12 or 24 vCPUs within the virtual environment. We found better performance using 16 vCPUs in our Virtual Machines.Disclaimer
The information in this document is distributed AS IS. The use of this information or the implementation of any of these techniques is a customer responsibility and depends on the customers ability to evaluate and integrate them into the customers operational environment. While each item may have been reviewed by IBM for accuracy in a specific situation, there is no guarantee that the same or similar results will be obtained elsewhere. Customers attempting to adapt these techniques to their own environments do so at their own risk. Any pointers in this publication to external websites are provided for convenience only and do not in any manner serve as an endorsement of these websites. Any performance data contained in this document was determined in a controlled environment, and therefore, the results that may be obtained in other operating environments may vary significantly. Users of this document should verify the applicable data for their specific environment.Server topology
The topology used for this testing was based on the standard enterprise topology E1. The E1 topology uses the WebSphere Application Server and DB2, and installs all of the CLM applications onto separate servers. We extended this topolopy by adding a second RQM server and a second RTC server, creating a topology where up to 5 CLM servers are interacting with a single JTS server. We only used a single RRC server because multiple RRC servers are not supported by the 4.0.3 release. We also changed this topology by using Virtual Machines instead of physical servers for the CLM components. The DB2 and IHS servers were still kept as separate physical machines. This deployment used floating licenses provided by the JTS server. A single IBM HTTP server was used as a reverse proxy. Here are the specific versions of software we used:| Software | Version |
|---|---|
| CLM applications | 4.0.3 M2 |
| IBM HTTP Server | 8.5.0.2 |
| IBM DB2 Enterprise Server Edition | 10.1.0.2 |
| IBM WebSphere Application Server | 8.5.0.2 |

Hardware description
This table lists the servers that were used for our testing:| Role | Manufacturer / Model | CPU | Number of CPU/Cores | CPU Speed | Memory | OS |
|---|---|---|---|---|---|---|
| IBM HTTP Server | IBM x3250 M4 | Intel Xeon E3-1240 v2 | 1 / 4 | 3.4 GHz | 16 GB | RedHat Enterprise Linux Server 64-bit v6.3 |
| VMware Hypervisor | IBM System X iDataPlex dx360 M4 | Intel Xeon E5-2640 | 2 / 12 | 2.5 GHz | 262 GB | ESXi 5.0.0 |
| CLM - DB2 Server | IBM x3650 M4 | Intel Xeon E5-2640 | 2 / 12 | 2.5 GHz | 64 GB | RedHat Enterprise Linux Server 64-bit v6.3 |
Test methodology - maximum throughput measurement
 The tests described
in this report determine the maximum throughput (in requests per
second) that can be handled by a given topology. The tests
are carried out by applying a simulated workload against the
target system. The simulation uses multiple threads of
execution which are sending transactions to the server as fast as
possible. The number of threads starts out small, and then
is slowly increased while we monitor the total number of
transactions per second processed by the system. When the
transactions per second stops increasing (or drops), the system is
at its limit.
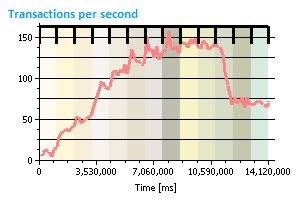
The chart at the right is an example of the output from a typical
test. Initially, the throughput increases as the number of
threads increases. Midway through the test, the throughput
flattens out and this is the range from which the maximum
throughput is calculated. Past this point, the system is
overloaded and the system cannot process the requests of
additional threads.
We used this technique to measure the maximum throughput for each
of the application nodes in the test system, both singly and in
combination, while also monitoring CPU utilization on the JTS
server. For example, we first ran a test that applied load
to a single RTC server. Then, we ran another test that
applied load to 2 RTC servers at the same time. We continued
looking at server combinations up to the point where we were
applying load against all servers at once (both RQM servers, both
RTC servers, and the RM server). We were looking for signs
that the JTS was becoming overloaded, such as high CPU utilization
or a drop in maximum throughput at one or more nodes.
Please note that the throughput results do not have a precise
relationship to the number of users that can be supported by a
configuration. The throughput numbers represent an absolute
maximum that the system can sustain when stressed by a simulation
that uses a small number of parallel threads running as fast as
possible. In production systems, the traffic generated by
each real user is much lower than the traffic generated by a
simulated thread, because real users pause between
operations. In theory, you should be able to increase the
number of real users until you reach the maximum throughput (e.g.
if each real user generated 2 transactions per second on average,
and your maximum transaction rate is 150 - then you have an upper
limit of 75 users). In practice, however, the actual user
load will be lower than the upper limit. Response times, for
example, may degrade before the maximum throughput is reached,
which then lowers the effective number of supported users.
Understanding how user capacity is related to maximum throughput
is outside the scope of this article.
The tests described
in this report determine the maximum throughput (in requests per
second) that can be handled by a given topology. The tests
are carried out by applying a simulated workload against the
target system. The simulation uses multiple threads of
execution which are sending transactions to the server as fast as
possible. The number of threads starts out small, and then
is slowly increased while we monitor the total number of
transactions per second processed by the system. When the
transactions per second stops increasing (or drops), the system is
at its limit.
The chart at the right is an example of the output from a typical
test. Initially, the throughput increases as the number of
threads increases. Midway through the test, the throughput
flattens out and this is the range from which the maximum
throughput is calculated. Past this point, the system is
overloaded and the system cannot process the requests of
additional threads.
We used this technique to measure the maximum throughput for each
of the application nodes in the test system, both singly and in
combination, while also monitoring CPU utilization on the JTS
server. For example, we first ran a test that applied load
to a single RTC server. Then, we ran another test that
applied load to 2 RTC servers at the same time. We continued
looking at server combinations up to the point where we were
applying load against all servers at once (both RQM servers, both
RTC servers, and the RM server). We were looking for signs
that the JTS was becoming overloaded, such as high CPU utilization
or a drop in maximum throughput at one or more nodes.
Please note that the throughput results do not have a precise
relationship to the number of users that can be supported by a
configuration. The throughput numbers represent an absolute
maximum that the system can sustain when stressed by a simulation
that uses a small number of parallel threads running as fast as
possible. In production systems, the traffic generated by
each real user is much lower than the traffic generated by a
simulated thread, because real users pause between
operations. In theory, you should be able to increase the
number of real users until you reach the maximum throughput (e.g.
if each real user generated 2 transactions per second on average,
and your maximum transaction rate is 150 - then you have an upper
limit of 75 users). In practice, however, the actual user
load will be lower than the upper limit. Response times, for
example, may degrade before the maximum throughput is reached,
which then lowers the effective number of supported users.
Understanding how user capacity is related to maximum throughput
is outside the scope of this article.
Overview of simulated workloads
The operations used to test Rational Team Concert's maximum throughput is listed below:- Rational Team Concert: login, select a predefined query, edit a workitem, create a new workitem
Data Volume
The data repository has an initial population of 100K RTC workitems, 100K RQM data, and 200K RRC requirement data. There were 5 projects in the RTC server with 10K workitems and 20 plans per project.Test Results - Details
Throughput Summary
The maximum throughputs (in transactions per second) are listed in the following table:| vCPU count | Maximum Throughput |
|---|---|
| 2 | 122 |
| 4 | 216 |
| 6 | 301 |
| 8 | 339 |
| 12 | 490 |
| 16 | 530 |
| 24 | 492 |
| Physical Server (12 cores) | 581 |
Rational Performance Tester Run Comparison
The chart below shows the throughputs (in transactions per second) for each level of CPU. Also included is the physical server run for comparison.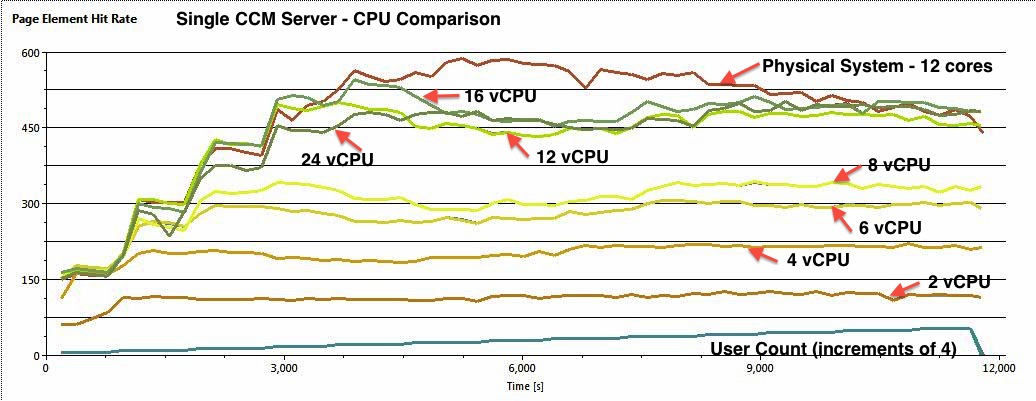
CPU Comparison
The chart below shows the CPU percent for each of the runs. As more vCPUs were added, the strain on the CPU became less. Also included is the physical server CPU (at 12 cores) for comparison.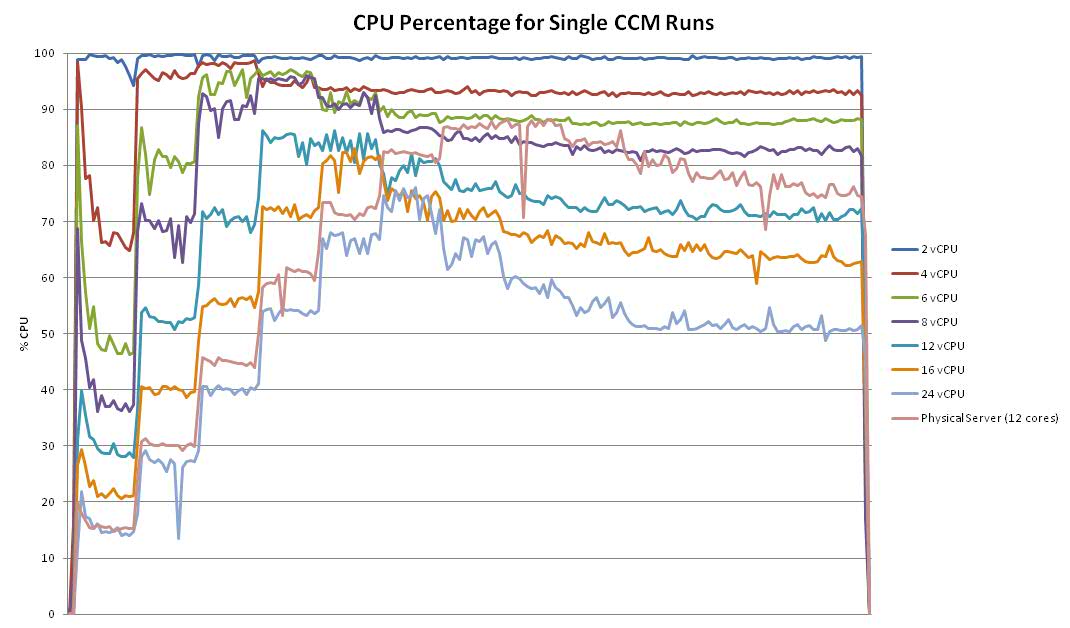
Key Tuning Parameters
WebSphere Application Servers
WebContainer set to Min 300 Max 300JVM max heap set to 4 GB
JVM arguments set to:
-Xdump:none
-Xdump:heap+java:events=systhrow+user,filter=java/lang/OutOfMemoryError,request=exclusive+prepwalk
-Xgcpolicy:gencon -Xmx4g -Xms4g -Xmn1g -Xcompressedrefs
-Xgc:preferredHeapBase=0x100000000 -Xverbosegclog:gc.log
-Xdump:heap:file=/home/wasdumps/heapdump.%Y%m%d.%H%M%S.%pid.%seq.txt
-Xdump:java:file=/home/wasdumps/javacore.%Y%m%d.%H%M%S.%pid.%seq.txt
IBM HTTP Server
In httpd.conf:
<IfModule worker.c>
      ThreadLimit           25
      ServerLimit           100
      StartServers          2
      MaxClients            2500
      MinSpareThreads       25
      MaxSpareThreads       500
      ThreadsPerChild       25
      MaxRequestsPerChild   0
</IfModule>
Related Information
Deployment.PerformanceImpactOfvCPUSizes moved from Deployment.PerformanceImpactOfvCPULevels on 2013-08-02 - 17:57 by Main.gcovell -
Contributions are governed by our Terms of Use. Please read the following disclaimer.
Dashboards and work items are no longer publicly available, so some links may be invalid. We now provide similar information through other means. Learn more here.