Performance Impact of Sharing a Jazz Team Server within a Deployment of Multiple RDNG Servers
Authors: SentellaCystrunk, VaughnRokosz Last updated: September 29, 2014 Build basis: Rational DOORS Next Generation (RDNG) 5.0Introduction
Beginning with Rational DOORS Next Generation (RDNG) 5.0 release, the storage for Requirements Management (RM) application is decoupled from Jazz Team Server (JTS). With this architectural change comes the ability for multiple RDNG servers to share a single JTS server for common user and license information. This report looks at the performance impact of sharing an instance of JTS among multiple instances of RDNG.Disclaimer
The information in this document is distributed AS IS. The use of this information or the implementation of any of these techniques is a customer responsibility and depends on the customers ability to evaluate and integrate them into the customers operational environment. While each item may have been reviewed by IBM for accuracy in a specific situation, there is no guarantee that the same or similar results will be obtained elsewhere. Customers attempting to adapt these techniques to their own environments do so at their own risk. Any pointers in this publication to external Web sites are provided for convenience only and do not in any manner serve as an endorsement of these Web sites. Any performance data contained in this document was determined in a controlled environment, and therefore, the results that may be obtained in other operating environments may vary significantly. Users of this document should verify the applicable data for their specific environment.Summary of Results
Results from the set of tests conducted for this study show virtually no performance impact when up to 3 instances of RDNG share a Jazz Team Server.
- 1 JTS, 1 RDNG
- 1 JTS, 2 RDNG
- 1 JTS, 3 RDNG
Server Topology
The following topology was used for this testing:
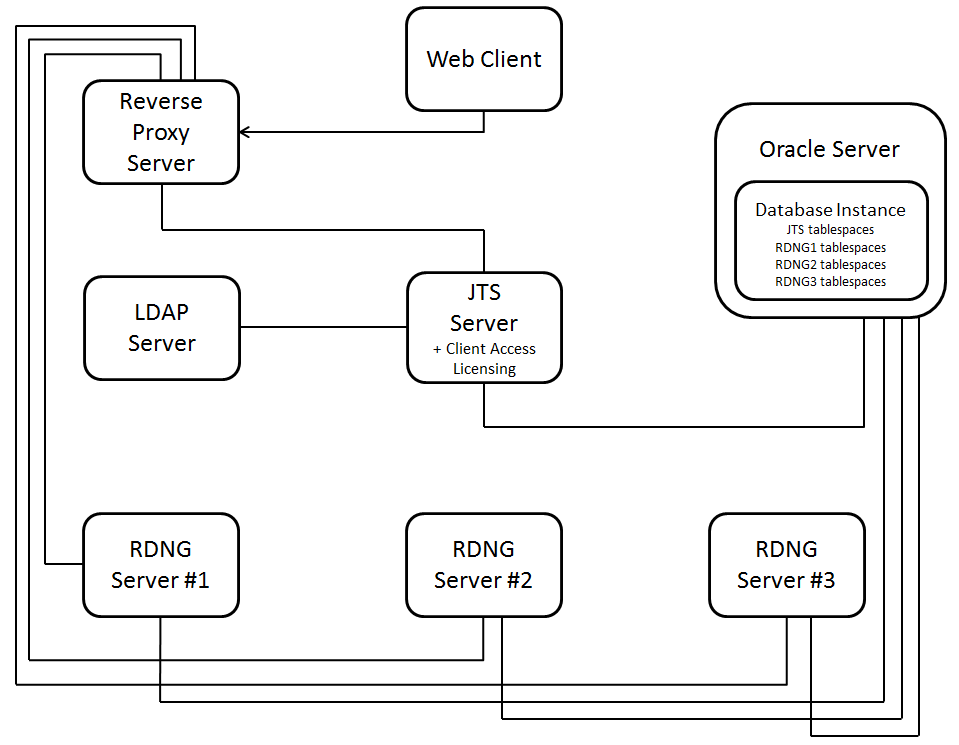
The specific versions of software used were:
| Software |
Version |
|---|---|
| IBM Rational CLM Applications |
5.0 |
| IBM HTTP Server and Web Server Plugin for WebSphere |
8.5.5.2 |
| IBM WebSphere Application Server |
8.5.5.2 |
| Oracle Database |
11.2.0.3.0 |
Hardware Description
This table lists the servers that were used for our testing:
| Role |
Manufacturer / Model |
CPU |
Number of CPU/Cores |
CPU Speed |
Memory |
Disk |
Disk Capacity |
OS |
|---|---|---|---|---|---|---|---|---|
| Reverse Proxy Server |
IBM x3250 M3 |
Intel Xeon CPU X3480 (1 quad-core) |
8 / 4 |
3.07 GHz |
15.5 GB | RAID 0 SAS Disk x 1 |
279 GB | RedHat Enterprise Linux Server 6.3,
64-bit |
| JTS Server |
IBM Flex System x240 Compute Node (Hypervisor) |
Intel Xeon CPU E5-2670 0 (Virtual Processor) |
4 / 4 |
2.6 GHz | 16 GB | VMWare Virtual Disk - SCSI |
60 GB | Windows Server 2012 Standard, 64-bit |
| DNG Server #1 |
IBM Flex System x240 Compute Node (Hypervisor) |
Intel Xeon CPU E5-2670 0 (Virtual Processor) |
4 / 4 |
2.6 GHz | 16 GB | VMWare Virtual Disk - SCSI | 60 GB | Windows Server 2012 Standard, 64-bit |
| DNG Server #2 |
IBM Flex System x240 Compute Node (Hypervisor) |
Intel Xeon CPU E5-2670 0 (Virtual Processor) |
4 / 4 |
2.6 GHz | 16 GB | VMWare Virtual Disk - SCSI | 60 GB | Windows Server 2012 Standard, 64-bit |
| DNG Server #3 |
IBM Flex System x240 Compute Node (Hypervisor) |
Intel Xeon CPU E5-2670 0 (Virtual Processor) |
4 / 4 |
2.6 GHz | 16 GB | VMWare Virtual Disk - SCSI | 60 GB | Windows Server 2012 Standard, 64-bit |
| Database Server |
IBM x3650 M3 | Intel Xeon CPU X5667 (2 quad-core) |
16 / 8 |
3.07 GHz | 31.3 GB |
RAID 10 SAS Disk x 8 (with write-back caching) |
279 GB | RedHat Enterprise Linux Server 6.3, 64-bit |
Data Volume and Shape
For each DNG server, the artifacts were distributed between 6 projects for a total of 517,080 artifacts. The repository contained the following data:- 312 modules
- 510,000 module artifacts
- 7,080 requirement artifacts
- 714 folders
- 84 collections
- 1,563,492 comments
- 1,800 Public Tags
- 1,428 Terms
- 1,824,174 Links
- 600 Views
RM index size on disk = 40.2 GB
Each project contained the following data:
- 52 modules
- 85,000 module artifacts
- 1,180 requirement artifacts
- 119 folders
- 14 collections
- 260,582 comments
- 300 Public Tags
- 238 Terms
- 304,029 Links
- 100 Views
Test Methodology
IBM® Rational® Performance Tester was used to simulate the workload. A Rational Performance Tester script was created for each use case. The scripts are organized by pages; each page represents a user action. Users were distributed into many user groups and each user group repeatedly runs one script (use case). Tests were run as quickly as possible with a 1 minute think time between pages for each user. Test were run against a single JTS, single RDNG server configuration to find the maximum user load that could be supported with the given workload and sustained over an eight hour period with acceptable response times. This maximum user load was then executed against the remaining configurations to determine if there is any performance impact.Workload Description
This table shows the use cases and the number of simulated users who were repeatedly running each script:|
Use case |
Description |
Percentage of 100 users |
|---|---|---|
|
Copy/Paste/Move/Delete |
Open a module that contains 1500 artifacts, select 25 artifacts, move them by using the copy and paste functions, and then delete the copied artifacts. |
1% |
|
Create an artifact |
Create non-module artifacts. |
3% |
|
Create a collection |
Create collections that contain 10 artifacts. |
2% |
|
Create a module artifact end-to-end scenario |
Open a medium module that contains 1500 artifacts, create a module artifact, edit the new artifact, and delete the new artifact. |
20% |
|
Create a small module artifact end-to-end scenario |
Open a small module that contains 500 artifacts, create a module artifact, edit that new artifact, and delete the new artifact. |
11% |
|
Display module history |
Open a module that contains 1500 artifacts and show the module history and the module audit history. |
1% |
|
Hover over a module artifact and edit it |
Open a module that contains 1500 artifacts and hover over an artifact. When the rich hover is displayed, edit the artifact text. |
2% |
|
Hover over and open a collection |
Display all of the collections, hover over a collection, and then open it. |
1% |
|
Manage folders |
Click Show Artifacts to display folder tree and then create a folder. Move the new folder into another folder and then delete the folder that you just created. |
1% |
|
Open the RM admin page |
Open the rm/admin page. |
1% |
|
Open the project dashboard |
Open a dashboard that displays the default dashboard. |
4% |
|
Search by ID and string |
Open a project, select a folder, search for an artifact by its numeric ID, and click a search result to display an artifact. Search for artifacts by using a generic string search that produces about 50 results. |
9% |
|
Scroll 20 pages in a module |
Open a module that contains 1500 artifacts and then scroll through 20 pages. |
19% |
|
Switch the module view |
Open a module that contains 1500 artifacts and then change the view to add columns that display user-defined attributes. |
18% |
|
Upload a 4 MB file as a new artifact |
Upload a file and create an artifact. |
7% |
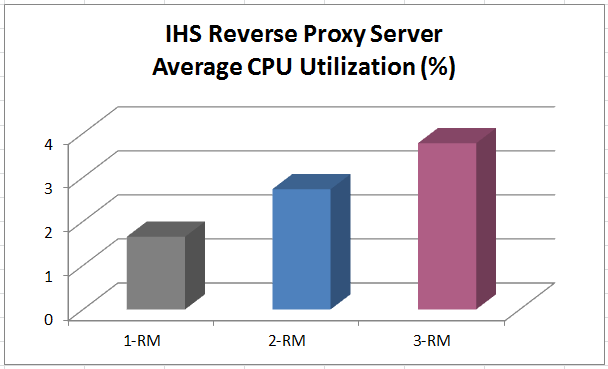
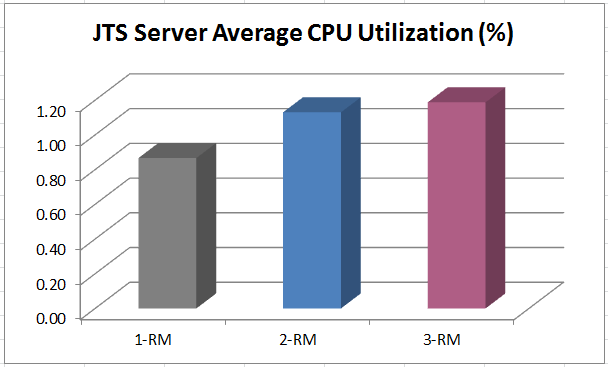
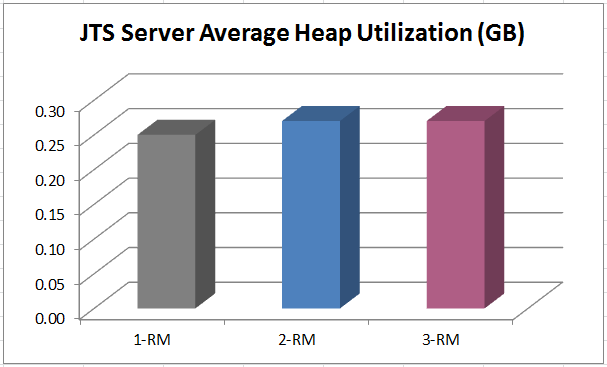
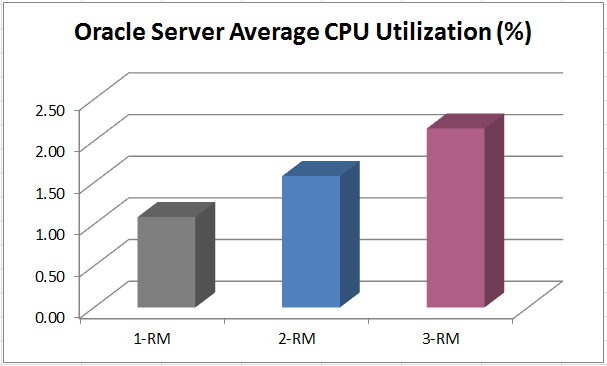
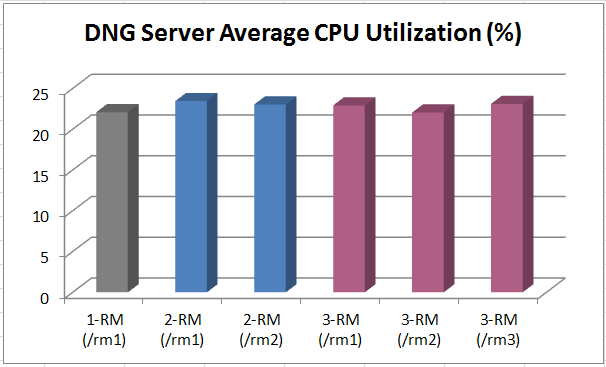
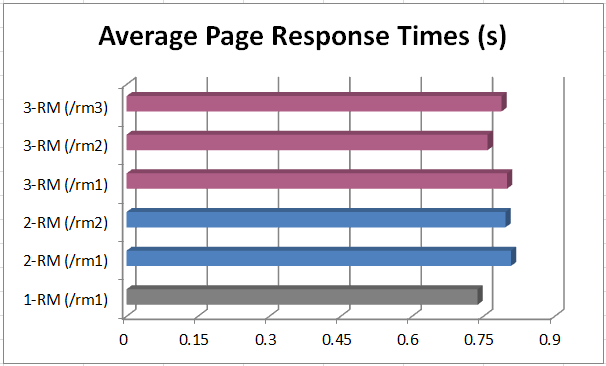
Test Results - Compare Configurations
The following charts display the average server resource utilization and page response times in all tested configurations.
The configurations are labeled as follows:- 1 JTS, 1 RDNG = 1-RM
- 1 JTS, 2 RDNG = 2-RM
- 1 JTS, 3 RDNG = 3-RM
Key Configuration & Tuning Parameters
WebSphere Application Servers
JTS
JVM arguments set to:-Xmx4g -Xms4g -Xmn1g -Xcompressedrefs -Xgc:preferredHeapBase=0x100000000 -Xverbosegclog:gc.log -XX:MaxDirectMemorySize=1G -Xgcpolicy:gencon -Xloaminimum0.02
DNG
Each DNG server functions independently. Thus, a separate converter application is deployed for each DNG server. Using the RM administration console for each server, configure the ConverterURL property to reflect the unique name of its converter installation.WebContainer thread pool set to Min 500 Max 500
JVM arguments set to:
-Xmx8g
-Xms8g
-Xmn2g
-Xcompressedrefs
-Xgc:preferredHeapBase=0x100000000
-Xverbosegclog:gc.log
-XX:MaxDirectMemorySize=1G
-Xgcpolicy:gencon
-Xloaminimum0.02
IBM HTTP Server
In httpd.conf:
<IfModule worker.c>
      ThreadLimit           25
      ServerLimit           80
      StartServers          1
      MaxClients            2000
      MinSpareThreads       25
      MaxSpareThreads       75
      ThreadsPerChild       25
      MaxRequestsPerChild   0
</IfModule>
Oracle Database
Initialization parameters:processes = 500
shared_servers = 20
dispatchers = 5
Related Information
- RDNG 5.0 - Storage separation for the Requirements Management application
- RDNG 5.0 - Multiple Requirements Management applications on the same Jazz Team Server
Contributions are governed by our Terms of Use. Please read the following disclaimer.
Dashboards and work items are no longer publicly available, so some links may be invalid. We now provide similar information through other means. Learn more here.