Introduction
The report presents the performance impact of the ETL with different RAID Write Cache Policy for the data warehouse.
Data Manager ETL (A.K.A DM ETL) is the powerful tool to extract/transform/load the CLM operational data into the data warehouse, then the reporting of CLM can show the complex statistics and trends charts. Our client can use the DM ETL to load their historical operational data from one or multiple CLM servers. The DM ETL has initial load and delta load. During ETL working, there are frequent and larege amount of INSERT and UPDATE operation. That is one kind of high frequent write IO with small size of random data. These two operations are all need Disk Write operation onto the data warehouse. The Disk Write maybe the IO bottleneck or the key factor of the ETL performance. RAID controoler has Write Cache Policy that has differenct IO Write performace against different policies. This article is target to try to find the IO Write bottle neck for JAVA/DM ETL. And try to find the ETL performance impact of RAID write cache policy on the data warehouse.
Summary of results
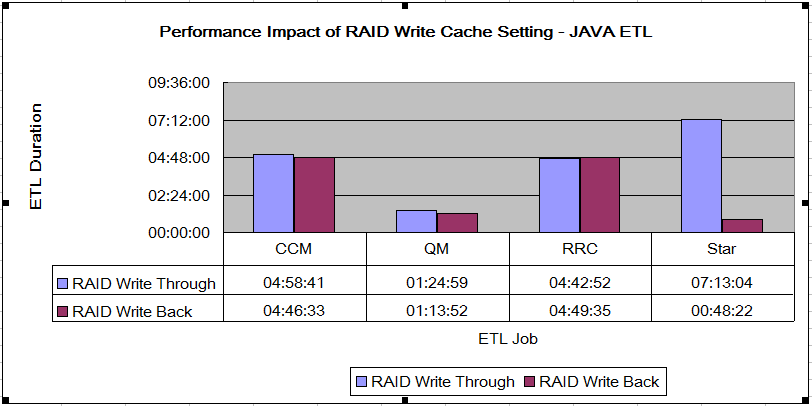
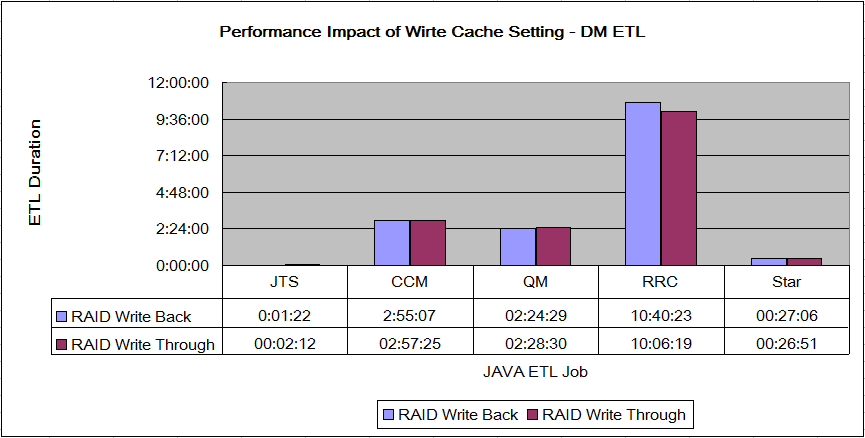
The setting of RAID Write Cache Policy has two kinds of typical policy: Write Through and Write Back. Write Back mode will get significant gain on the random IO and small size committed to Disk. ETL fetches the data from point products and insert/update them into data warehouse.We make the comparison of the ETL performance with only one change factor - The RAID Write Cache policy of data warehouser. We run twice of the JAVA and DM ETL with the different RAID Write Cache Policy:Write Through VS.Write Back. Based on performance teams test data and test configuration, the Java Star job improves significantly compared with Write Through mode. The duration reduced from 7 hour to 50 minutes. And the performance of JAVA CCM/QM/RM also has a little improvement. However, there is no significant performance impact for the DM ETL.
NOTE: You can get the knowlege of RAID and RAID Write Cache from the links mentioned in
For More Information
Disclaimer
The information in this document is distributed AS IS. The use of this information or the implementation of any of these techniques is a customer responsibility and depends on the customers ability to evaluate and integrate them into the customers operational environment. While each item may have been reviewed by IBM for accuracy in a specific situation, there is no guarantee that the same or similar results will be obtained elsewhere. Customers attempting to adapt these techniques to their own environments do so at their own risk. Any pointers in this publication to external Web sites are provided for convenience only and do not in any manner serve as an endorsement of these Web sites. Any performance data contained in this document was determined in a controlled environment, and therefore, the results that may be obtained in other operating environments may vary significantly. Users of this document should verify the applicable data for their specific environment.
Performance is based on measurements and projections using standard IBM benchmarks in a controlled environment. The actual throughput or performance that any user will experience will vary depending upon many factors, including considerations such as the amount of multi-programming in the users job stream, the I/O configuration, the storage configuration, and the workload processed. Therefore, no assurance can be given that an individual user will achieve results similar to those stated here.
This testing was done as a way to compare and characterize the differences in performance between different versions of the product. The results shown here should thus be looked at as a comparison of the contrasting performance between different versions, and not as an absolute benchmark of performance.
What our tests measure
We use predominantly automated tooling such as Rational Performance Tester (RPT) to simulate a workload normally generated by client software such as the Eclipse client or web browsers. All response times listed are those measured by our automated tooling and not a client.
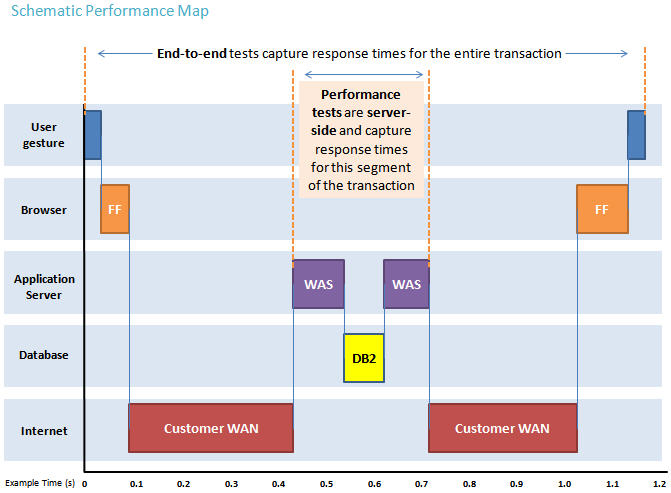
The diagram below describes at a very high level which aspects of the entire end-to-end experience (human end-user to server and back again) that our performance tests simulate. The tests described in this article simulate a segment of the end-to-end transaction as indicated in the middle of the diagram. Performance tests are server-side and capture response times for this segment of the transaction.
Topology
The topology under test is based on
Standard Topology (E1) Enterprise - Distributed / Linux / DB2.

The test uses IBM X3550 M3 (ServeRAID M5015 SAS/SATA Controller, 3 of IBM 300 GB 2.5in SFF Slim-HS 10K 6Gbps SAS HDD) as the ESX server. And the 3 HDD combined with RAID0. The specifications of machines under test are listed in the table below. Server tuning details listed in
Appendix A
This case study used the same test environment and same test data to test the ETL performance for CLM 4.0.3 and CLM 4.0.4. Test data was generated using automation. The test environment for the latest release was upgraded from the earlier one by using the CLM upgrade process.
The WebSphere Application Server was version 8.5.1, 64-bit. The database server was IBM DB2 9.7.5, 64-bit. The Rational Reporting for Development Intelligence tool was version 2.0.4. The Jazz Team Sever, CCM, QM, and RM applications co-existed in the same WebSphere Application Server profile. The JVM setting was as follows:
-verbose:gc -XX:+PrintGCDetails -Xverbosegclog:gc.log -Xgcpolicy:gencon
-Xmx8g -Xms8g -Xmn1g -Xcompressedrefs -Xgc:preferredHeapBase=0x100000000
-XX:MaxDirectMemorySize=1g
IBM Tivoli Directory Server was used for managing user authentication.
| Function |
Number of Machines |
Machine Type |
CPU / Machine |
Total # of CPU Cores/Machine |
Memory/Machine |
Disk |
Disk capacity |
Network interface |
OS and Version |
| ESXServer1 |
1 |
IBM X3550 M3 7944J2A |
1 x Intel Xeon E5-2640 2.5GHz (six-core) |
12 |
36GB |
RAID0 SAS x3 300G 10k rpm |
900G |
Gigabit Ethernet |
ESXi4.1 |
| JTS/RM Server |
1 |
VM on IBM System x3550 M3 |
EsxServer 1 |
4 vCPU |
16GB |
|
120G |
Gigabit Ethernet |
Red Hat Enterprise Linux Server release 6.2 |
| Database Server |
1 |
VM on IBM System x3550 M3 |
EsxServer 1 |
4 vCPU |
16GB |
|
120G |
Gigabit Ethernet |
Red Hat Enterprise Linux Server release 6.2 |
| RRDI Development Tool |
1 |
VM on IBM System x3550 M3 |
EsxServer 1 |
2 vCPU |
4GB |
|
120G |
Gigabit Ethernet |
Windwos 2008 Enterprise R2 |
| ESXServer2 |
1 |
IBM X3550 M3 7944J2A |
1 x Intel Xeon E5-2640 2.5GHz (six-core) |
12 |
36GB |
RAID0 SAS x3 300G 10k rpm |
900G |
Gigabit Ethernet |
ESXi4.1 |
| CCM Server |
1 |
VM on IBM System x3550 M3 |
EsxServer 2 |
4 vCPU |
16GB |
|
120G |
Gigabit Ethernet |
Red Hat Enterprise Linux Server release 6.2 |
| QM Server |
1 |
VM on IBM System x3550 M3 |
EsxServer 2 |
4 vCPU |
16GB |
|
120G |
Gigabit Ethernet |
Red Hat Enterprise Linux Server release 6.2 |
| Data Warehouse Server |
1 |
VM on IBM System x3550 M3 |
EsxServer 1 |
4 vCPU |
16GB |
|
120G |
Gigabit Ethernet |
Red Hat Enterprise Linux Server release 6.2 |
Data volume and shape
The data volume listed in
Appendix B
Network connectivity
All server machines and test clients are located on the same subnet. The LAN has 1000 Mbps of maximum bandwidth and less than 0.3ms latency in ping.
Methodology
The tests determine the performance impact of the ETL benchmark based on the give topology and data volume. CLM server provides the start point of the JAVA ETL on the admin web page. ETL performance test of JAVA ETL collects the ETL logs and makes the result analysis after the JAVA ETL completed. The DM ETL works on the RRDI Develoment Tool (Cognos Data Manager). The Cognos Data Manager help to do the ETL via the RRDI JDBC/ODBC Driver. The performance test collects the ETL log and make the result analysis. This test make the comparison of performance through changing the RAID Write Cache Polocy.
Risk and Mitigation
In Write-Through caching, the controller sends a data-transfer completion signal to the host system when the disk subsystem has received all the data in a transaction. In Write-Back caching, the controller sends a data transfer completion signal to the host when the controller cache has received all the data in a transaction. The controller then writes the cached data to the storage device in the background.
The risk of using Write Back is that the cached data can be lost if such conditions:
- The power down before the cached data written to disk. The mitigation:
- By adding the BBU (Battery Backup Unit), the cached data can be write into disk after the power on.
- By using UPS as backup power.
- The RAID Controller crashed. The mitigation:
- Replace the RAID Controller with same type, the RAID BIOS will rebuild the RAID info.
The cached data lost will lead to the current Delta ETL failure. However, it is
Low risk for ETL and data warehouse. In another word, we can think there is no delta ETL happened on that day. After the RAID recovery, the next delta ETL will keep the data integrity by loading the data again. However, if there are other databases exists on the same server where the data warehouse locates, please
be careful to use this recommendation. The risk is that you may lost the key trasaction data once the RAID broken, if the application has no remedial measures.
Test Results Details
JAVA ETL Comparison
From the test result comparison shown, the JAVA star job get big performance gain. The performance of star job improved about 8 times using Write Back policy compared with Write Through Policy. The CCM job
has 10% improvement. And the performance of the others keep flat result.

DM ETL Comparison
From the test result comparison shown, the DM ETL jobs has similar ETL duration compared with the setting of Write Back policy and Write Through Policy. So, there is no significant performance impact for the DM ETL along with the change of the RAID Write cache policy.

Appendix A
Product
|
Version |
Highlights for configurations under test |
| IBM WebSphere Application Server |
8.5.0.1 |
JVM settings:
- GC policy and arguments, max and init heap sizes:
-verbose:gc -XX:+PrintGCDetails -Xverbosegclog:gc.log -Xgcpolicy:gencon
-Xmx8g -Xms8g -Xmn1g -Xcompressedrefs -Xgc:preferredHeapBase=0x100000000
-XX:MaxDirectMemorySize=1g
|
| DB2 |
DB2 9.7.5 |
Transaction log setting of data warehouse:
* Transaction log size changed to 40960
db2 update db cfg using LOGFILSIZ=40960
|
| LDAP server |
IBM Tivoli Directory Server 6.3 |
|
| License server |
|
Hosted locally by JTS server |
| Network |
|
Shared subnet within test lab |
Appendix B
|
Record type |
Initial load |
Delta load |
| CCM |
APT_ProjectCapacity |
1 |
1 |
| |
APT_TeamCapacity |
0 |
0 |
| |
Build |
0 |
0 |
| |
Build Result |
0 |
0 |
| |
Build Unit Test Result |
0 |
0 |
| |
Build Unit Test Events |
0 |
0 |
| |
Complex CustomAttribute |
0 |
0 |
| |
Custom Attribute |
0 |
0 |
| |
File Classification |
3 |
3 |
| |
First Stream Classification |
3 |
3 |
| |
History Custom Attribute |
0 |
0 |
| |
SCM Component |
2 |
0 |
| |
SCM WorkSpace |
2 |
1 |
| |
WorkItem |
100026 |
10000 |
| |
WorkItem Approval |
100000 |
10000 |
| |
WorkItem Dimension Approval Description |
100000 |
10000 |
| |
WorkItem Dimension |
3 |
0 |
| |
WorkItem Dimension Approval Type |
3 |
0 |
| |
WorkItem Dimension Category |
2 |
0 |
| |
WorkItem Dimension Deliverable |
0 |
0 |
| |
WorkItem Dimension Enumeration |
34 |
0 |
| |
WorkItem Dimension Resolution |
18 |
0 |
| |
Dimension |
68 |
0 |
| |
WorkItem Dimension Type |
8 |
0 |
| |
WorkItem Hierarchy |
0 |
0 |
|
WorkItem History |
242926 |
20100 |
| |
WorkItem History Complex Custom Attribute |
0 |
0 |
| |
WorkItem Link |
112000 |
10000 |
| |
WorkItem Type Mapping |
4 |
0 |
| RM |
CrossAppLink |
0 |
0 |
| |
Custom Attribute |
422710 |
51010 |
| |
Requirement |
422960 |
51150 |
| |
Collection Requirement Lookup |
1110 |
21000 |
| |
Module Requirement Lookup |
22000 |
2000 |
| |
Implemented BY |
100 |
0 |
| |
Request Affected |
5988 |
0 |
| |
Request Tracking |
0 |
0 |
| |
REQUICOL_TESTPLAN_LOOKUP |
0 |
0 |
| |
REQUIREMENT_TESTCASE_LOOKUP |
0 |
0 |
| |
REQUIREMENT_HIERARCHY |
12626 |
0 |
| |
REQUIREMENT_EXTERNAL_LINK |
0 |
0 |
| |
RequirementsHierarchyParent |
6184 |
0 |
| |
Attribute Define |
10 |
10 |
| |
Requirement Link Type |
176 |
176 |
| |
Requirement Type |
203 |
203 |
| QM |
Record type |
|
Initial load |
Delta load |
| TestScript | | 0 | 0 |
| BuildRecord | | 0 | 0 |
| Category | | 0 | 0 |
| CategoryType | | 0 | 0 |
| Configuration | | 0 | 0 |
| CustomAttribute | | 0 | 0 |
| EWIRelaLookup | | | |
| | CONFIG_EXECUTIONWORKITM_LOOKUP | 0 | 0 |
| | EXECWORKITEM_REQUEST_LOOKUP | 0 | 0 |
| | EXECWORKITEM_ITERATION_LOOKUP | 18000 | 1800 |
| | EXECWORKITEM_CATEGORY_LOOKUP | 0 | 0 |
| ExecResRelaLookup | | | |
| | EXECRES_EXECWKITEM_LOOKUP | 54000 | 5400 |
| | EXECRES_REQUEST_LOOKUP | 6001 | 0 |
| | EXECRESULT_CATEGORY_LOOKUP | 0 | 0 |
| | EXECUTION_STEP_RESULT | 0 | 0 |
| ExecStepResRequestLookup | | 0 | 0 |
| ExecutionResult | | 0 | 0 |
| ExecutionStepResult | | 0 | 0 |
| ExecutionWorkItem | | 0 | 0 |
| Job | | 0 | 0 |
| JobResult | | 0 | 0 |
| KeyWord | | 0 | 0 |
| KeyWordTestScriptLookup | | 0 | 0 |
| LabRequestChangeState | | 0 | 0 |
| LabRequest | | 0 | 0 |
| LabResource | | 0 | 0 |
| Objective | | 0 | 0 |
| Priority | | 0 | 0 |
| RemoteScript | | 0 | 0 |
| Requiremen | | 0 | 0 |
| Reservation | | 0 | 0 |
| ReservationRequestLookup | | 0 | 0 |
| ResourceGroup | | 0 | 0 |
| State | | 0 | 0 |
| StateGroup | | 0 | 0 |
| TestCase | | 0 | 0 |
| TestCaseRelaLookup | | | |
| | TESTCASE_RemoteTESTSCRIPT_LOOKUP | 0 | 0 |
| | TESTCASE_TESTSCRIPT_LOOKUP | 6000 | 600 |
| | TESTCASE_CATEGORY_LOOKUP | 16106 | 1598 |
| | REQUIREMENT_TESTCASE_LOOKUP | 6000 | 0 |
| | REQUEST_TESTCASE_LOOKUP | 6000 | 0 |
| | TestCase RelatedRequest Lookup | 0 | 0 |
| TestPhase | | 0 | 0 |
| TestPhaseExecDetail | | 0 | 0 |
| TestPlan | | 0 | 0 |
| TestPlanObjectiveStatus | | 0 | 0 |
| TestPlanRelaLookup | | | |
| | REQUIREMENT_TESTPLAN_LOOKUP | 0 | 0 |
| | TESTSUITE_TESTPLAN_LOOKUP | 600 | 0 |
| | TESTPLAN_CATEGORY_LOOKUP | 0 | 2 |
| | TESTPLAN_TESTCASE_LOOKUP | 6000 | 600 |
| | TESTPLAN_OBJECTIVE_LOOKUP | 0 | 0 |
| | REQUIREMENT COLLECTION_TESTPLAN_LOOKUP | 32 | 0 |
| | TESTPLAN_TESTPLAN_HIERARCHY | 0 | 0 |
| | TESTPLAN_ITERATION_LOOKUP | 120 | 12 |
| | REQUEST_TESTPLAN_LOOKUP | 0 | 0 |
| TestScript | | 0 | 0 |
| TestScriptRelaLookup _ Manual | | | |
| | TESTSCRIPT_CATEGORY_LOOKUP | 0 | 0 |
| | REQUEST_TESTSCRIPT_LOOKUP | 0 | 0 |
| TestScriptRelaLookup _ Remote | | 0 | 0 |
| TestSuiteElement | | 0 | 0 |
| TestSuite | | 0 | 0 |
| TestSuiteExecutionRecord | | 0 | 0 |
| TestSuiteLog | | 0 | 0 |
| TestSuiteRelaLookup | | | |
| | TESTSUITE_CATEGORY_LOOKUP | 1595 | 155 |
| | REQUEST_TESTSUITE_LOOKUP | 0 | 0 |
| TestSuLogRelaLookup | | | |
| | TESTSUITE_TESTSUITELOG_LOOKUP | 3000 | 300 |
| | TESTSUITELOG_EXECRESULT_LOOKUP | 21303 | 2106 |
| | TESTSUITELOG_CATEGORY_LOOKUP | 0 | 0 |
| TSERRelaLookup | | 0 | 0 |
| Total | | 144757 | 12573 |
N/A: Not applicable.
For more information
About the authors
PengPengWang
Questions and comments:
- What other performance information would you like to see here?
- Do you have performance scenarios to share?
- Do you have scenarios that are not addressed in documentation?
- Where are you having problems in performance?
Warning: Can't find topic Deployment.PerformanceDatasheetReaderComments

 The test uses IBM X3550 M3 (ServeRAID M5015 SAS/SATA Controller, 3 of IBM 300 GB 2.5in SFF Slim-HS 10K 6Gbps SAS HDD) as the ESX server. And the 3 HDD combined with RAID0. The specifications of machines under test are listed in the table below. Server tuning details listed in Appendix A
This case study used the same test environment and same test data to test the ETL performance for CLM 4.0.3 and CLM 4.0.4. Test data was generated using automation. The test environment for the latest release was upgraded from the earlier one by using the CLM upgrade process.
The WebSphere Application Server was version 8.5.1, 64-bit. The database server was IBM DB2 9.7.5, 64-bit. The Rational Reporting for Development Intelligence tool was version 2.0.4. The Jazz Team Sever, CCM, QM, and RM applications co-existed in the same WebSphere Application Server profile. The JVM setting was as follows:
